. 2025 Aug 11;15(17):8873-8896.
doi: 10.7150/thno.119712. eCollection 2025.

Targeting CB1R Rewires Ca2+-Dependent Mitophagy to Promote Nerve Regeneration

Affiliations

Targeting CB1R Rewires Ca2+-Dependent Mitophagy to Promote Nerve Regeneration

Ningning Wang et al. Theranostics. .

Abstract

Background: Ion homeostasis is disrupted following nerve injury, and elevated Ca2+ levels have been reported to induce Schwann cell (SC) death. Notably, clinical interventions such as electrical stimulation enhance Ca2+ influx and facilitate nerve regeneration. These findings highlight the need to clarify the precise role of Ca2+ signaling in nerve regeneration. Methods: We assessed extracellular Ca2+ concentrations in both human and murine peripheral nerve tissues after injury. Transcriptomic profiling identified CB1R as a key Ca2+-related gene and in vitro validation was performed with primary cultured SC and nerve explants. A sciatic nerve crush model was established in SC-specific CB1R knockout mice. Mitophagy, cellular metabolic homeostasis, and axonal regeneration were systematically assessed using proteomics, calcium imaging, and in vivo analyses. Additionally, the CB1R antagonist JD5037 was administered in both sciatic and optic nerve injury models to evaluate its translational potential. Results: Peripheral nerve injury (PNI) leads to elevated extracellular Ca2+ levels at the injury site, where a moderate increase (~1.5-fold) favors SC survival. PNI also induces upregulation of CB1R, genetic ablation of CB1R enhances Ca2+ influx, promotes SC survival, and maintains metabolic homeostasis. Mechanistically, CB1R interference upregulates adenine nucleotide translocase 2 (ANT2) expression, promotes mitochondrial permeability transition pore (mPTP) opening and mitochondrial membrane depolarization, thereby activating PINK1/Parkin-mediated mitophagy. This process improves mitochondrial quality and enhances energy metabolic efficiency, ultimately promoting axonal regeneration and functional recovery. Furthermore, systemic administration of the CB1R antagonist JD5037 similarly enhances regeneration of both peripheral and optic nerves in vivo. Conclusion: Moderate extracellular Ca2+ elevation establishes a pro-regenerative microenvironment after nerve injury. Targeting CB1R facilitates Ca2+ influx, enhances mitophagy via the PINK1/Parkin pathway, and promotes nerve regeneration. These findings identify CB1R as a viable therapeutic target and support the translational potential of JD5037 for nerve injury treatment.

Keywords: Ca2+; Schwann cell; cannabinoid receptor 1; mitophagy; nerve regeneration..


Conflict of interest statement

Competing Interests: The authors have declared that no competing interest exists.

Figures
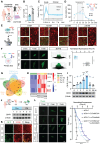
Figure 1
Figure 1
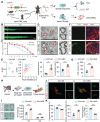
Moderate extracellular calcium promotes Schwann cell survival via CB1R-mediated Ca2+ influx. (A) Schematic illustration: Sciatic nerve tissues excised intraoperatively from patients with severe peripheral nerve injury (PNI group) and digital nerves from patients with congenital polydactyly (Con group) were collected. A mouse sciatic nerve crush model was also established. All samples were used for calcium concentration analysis. (B) [Ca2+] in sciatic nerves collected 6 h after injury compared with control (n = 3). (C) Relative Ca2+ levels in injured and distal sciatic nerves at 3 h, 1 d, 3 d, 7 d, and 14 d post-injury (n = 5). (D) Cell viability of primary Schwann cells (SCs) cultured under graded extracellular Ca2+ concentrations in PBS- or LPS-treated conditions (n = 3). (E) Representative IF images of ex vivo-cultured sciatic nerves treated with indicated Ca2+ concentrations. Myelin labeled with S100β (red), axons with NF200 (green). Scale bar = 20 μm. (F) Intracellular Ca2+ levels in primary SCs stimulated with 2.6 mM Ca2+ under LPS or PBS treatment, measured by Fluo-4 fluorescence at 0, 4, and 8 min. Right: 3D surface plot and quantification of fluorescence intensity at 8 min (n = 12 cells/group). Scale bar = 10 μm. (G) Venn diagram of DEGs at 3, 7, and 14 d post-injury intersected with calcium homeostasis-related genes. (H) Heatmap showing expression of selected DEGs (Ccl19, Ccl21a, Ccl8, Cnr1) across time points from GSE218702. (I) Western blot analysis of CB1R expression at indicated time points post-injury. Upper: quantification of CB1R/β-Actin; lower: representative blot (n = 4). (J) Western blot analysis of CB1R protein expression in human nerve tissues before and after injury. Top: Schematic illustration; bottom: representative blots (n = 3). (K) IF staining of CB1R (green) and S100β (red) in sciatic nerves at baseline and 14 d post-injury. Scale bar = 20 μm. (L) Time-lapse Fluo-4 imaging of Ca2+ influx in CB1R-knockdown SCs (siCnr1) treated with 2.6 mM Ca2+ or ω-conotoxin. Right: normalized fluorescence intensity quantification (n = 3). Scale bar = 10 μm. All data are presented as mean ± SD. Statistical tests: unpaired two-tailed t-test (B, C, F); one-way ANOVA with Tukey's post hoc test (I); two-way ANOVA with Bonferroni's post hoc test (D, L). *p < 0.05, ****p < 0.0001. CB1R, cannabinoid receptor 1; SCs, Schwann cells; PNI, peripheral nerve injury; SNC, sciatic nerve crush.
Figure 2
Figure 2
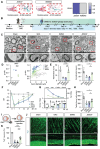
Schwann cell-specific deletion of Cnr1 enhances axonal regeneration, remyelination, and neuromuscular reinnervation. (A) Schematic of TAM-induced SC-specific Cnr1 knockout mice (Cnr1-cKO, Cnr1fl/fl; PLP-CreERT2) and experimental timeline. (B) Representative IF images of regenerating axons in the distal sciatic nerve labeled with Tuj1 (green). Scale bar = 1 mm. n = 3 mice. (C) Quantification of axon regeneration at 3-9 mm distal to the injury site. n = 3 mice. (D) TEM images of remyelinated axons in the distal stump. Red boxes indicate magnified regions. Scale bars: 5 μm (overview), 2 μm (zoomed). (E) Quantification of myelin g-ratio (left), number of myelinated axons (middle), and amyelinated axons (right) in Cnr1-cKO and control groups. n = 5 mice. (F) Representative IF staining of DRG neurons labeled with NeuN (red), CTB-traced neurons (green), and DAPI (blue). Scale bar = 100 μm. (G) Quantification of CTB-positive DRG neurons showing a significant increase in the Cnr1-cKO group. n = 4 mice. (H) Schematic workflow of muscle analysis at 14 days post-injury. (I) Quantification of wet weight of TA and GA muscles on the injured side. TA muscle weight was significantly increased in the Cnr1-cKO group, while GA showed no significant difference. n = 4 mice. (J) Representative IF images of NMJs labeled with α-BTX (red), NFL/Syn (green). Scale bar = 100 μm. (K) Quantification of NMJ morphology, showing a reduced proportion of fragmented endplates (left), decreased partially innervated NMJs (middle), and enhanced AChR clustering (right) in the Cnr1-cKO group. n = 4 mice. All data are presented as mean ± SD. Statistical analysis: two-way ANOVA with Bonferroni's post hoc test (C), bivariate linear regression and one-way ANOVA with Tukey's post hoc test (E, I), unpaired two-tailed t-test (G, K). *p < 0.05, **p < 0.01, ***p < 0.001, ****p < 0.0001.; ns, not significant. TAM, tamoxifen; TEM, transmission electron microscopy; IM, Intramuscular injection; IHC, Immunohistochemistry; CTB, Cholera Toxin Subunit B; DRG, Dorsal Root Ganglion; TA,tibialis anterior; GA, gastrocnemius; NMJs, neuromuscular junctions; α-BTX, acetylcholine receptors; NFL/Syn, neurofilament/synaptic vesicles.
Figure 3
Figure 3
Schwann cell-specific Cnr1 deletion enhances functional recovery following sciatic nerve injury. (A) Schematic of experimental workflow for functional assessment in Cnr1-cKO and control mice. (B) Representative image of the DigiGait system used to evaluate gait performance post-injury. (C) Quantification of SFI showing significantly improved motor recovery in the Cnr1-cKO group at 14 and 21 days post-injury. n = 6 mice (control), n = 5 mice (Cnr1-cKO). (D) Representative gait heatmaps from DigiGait analysis showing improved paw placement and stride in Cnr1-cKO mice. Scale bar = 1 cm. (E) Schematic and representative footprint images demonstrating increased plantar contact area in Cnr1-cKO mice at 14 days post-injury. Scale bar = 1 cm. (F) Schematic of the ladder rung walking test used to assess fine motor coordination. (G) Quantification of ladder rung walking performance showing significantly higher scores in Cnr1-cKO mice at 7, 14, and 21 days post-injury. n = 6 mice. (H) Schematic of muscle force testing setup for hindlimb muscle strength evaluation. (I) Quantification of twitch force at 14 days post-injury, showing enhanced muscle contractile strength in the Cnr1-cKO group. n = 5 mice. (J) Diagram showing sciatic nerve tissue collection from Cnr1-ctrl and Cnr1-cKO mice for calcium concentration analysis. (K) Extracellular calcium concentrations in sciatic nerves of Cnr1-ctrl and Cnr1-cKO mice at day 0 and 14 post-injury (n = 5). All data are presented as mean ± SD. Statistical analysis: two-way ANOVA with Bonferroni's post hoc test (C, G, K), unpaired two-tailed t-test (I). **p < 0.01, ***p < 0.001, ****p < 0.0001; ns, not significant. SFI, sciatic functional index; TA,tibialis anterior; SNC, sciatic nerve crush.
Figure 4
Figure 4
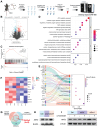
Proteomic analysis of CB1R-mediated Ca2+ regulation and its downstream pathways. (A) Schematic diagram of the proteomic analysis. (B) Volcano plot showing differentially expressed proteins between Cnr1-cKO and Cnr1-ctrl groups with 135 upregulated and 98 downregulated. (C) Gene Set Enrichment Analysis (GSEA) indicating significant upregulation of the oxidative phosphorylation pathway in the Cnr1-cKO group. Normalized enrichment score (NES) = 1.79, **p < 0.001. (D) Gene Ontology (GO) enrichment analysis showing that differentially expressed proteins are primarily involved in ATP metabolism, ROS regulation, mitochondrial transmembrane transport, and other mitochondrial-related biological processes. (E) Kyoto Encyclopedia of Genes and Genomes (KEGG) pathway analysis highlighting signaling pathways associated with nerve repair, with significant enrichment in the calcium signaling pathway (highlighted in red). (F) Heatmap displaying expression levels of key differentially expressed proteins (including Slc25a5, Gna14, and Atp5mg) between Cnr1-cKO and Cnr1-ctrl mice at 14 days post-injury. (G) Intersection analysis of genes enriched in the GSEA calcium signaling pathway and the KEGG oxidative phosphorylation pathway with the mitochondrial gene database (MitoCarta) identified Slc25a5 (Ant2) as the only overlapping gene. (H) Western blot analyzed the expression of ANT2 after CB1R knockdown (siCnr1). (I) Western blot analysis of ANT2 expression with or without ω-Conotoxin administration. ANT2, adenine nucleotide translocase 2.
Figure 5
Figure 5
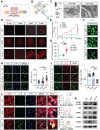
Inhibition of CB1R enhances mitophagy via activation of the PINK1/Parkin pathway. (A) Schematic illustration of ANT2-mediated regulation of mPTP opening and its role in mitophagy. (B) STRING database prediction of protein-protein interactions between ANT2 and components of the PINK1/Parkin mitophagy pathway. (C) TEM images of sciatic nerve tissues from Cnr1-ctrl and Cnr1-cKO mice showing improved mitochondrial ultrastructure in the Cnr1-cKO group. Scale bar = 500 nm. (D) Representative Rhod-2 fluorescence images of mitochondrial Ca2+ dynamics at 0, 2, 4, and 8 min in Ctrl, siCtrl, and siCnr1 groups. Scale bar = 10 μm. (E) Quantification of Rhod-2 fluorescence intensity over time. n = 3 replicates. (F) Live-cell imaging of mPTP opening using the Calcein-CoCl2 assay. Green fluorescence indicates mPTP state. Scale bar = 20 μm. (G) Quantification of mPTP-positive cells. n = 8 images from 3 independent experiments. (H) Representative ROS fluorescence staining showing intracellular ROS levels in Ctrl, siCtrl, and siCnr1 groups. Scale bar = 20 μm. Quantification of ROS⁺ cells. n = 9 images from 3 replicates. (I) JC-1 assay of mitochondrial membrane potential and quantification of JC-1 aggregate/monomer ratio in the three groups. Scale bar = 20 μm. n = 9 images from 3 replicates. (J) Representative IF staining of LC3B (green, autophagy marker) and TOM20 (red, mitochondrial marker). Scale bars = 20 μm (overview), 5 μm (zoomed region). (K) Western blot analysis of mitophagy-related proteins. The siCnr1 group showed increased levels of LC3B-II/I, PINK1, and Parkin, and decreased expression of TOM20 and p62. All data are presented as mean ± SD. Statistical analysis: two-way ANOVA with Bonferroni's post hoc test (E), one-way ANOVA with Tukey's post hoc test (G, H, I). **p < 0.01, ***p < 0.001, ****p < 0.0001. mPTP, mitochondrial permeability transition pore; TEM, transmission electron microscopy; ROS, reactive oxygen species; JC-1, 5,5′,6,6′-tetrachloro-1,1′,3,3′-tetraethylbenzimidazolylcarbocyanine iodide.
Figure 6
Figure 6
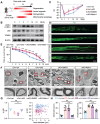
CB1R promotes peripheral nerve repair by regulating mitophagy. (A) Schematic illustration of the dynamic repair process following sciatic nerve injury over a 28-day period. Myelin degradation initiates immediately post-injury and peaks at 3 days, axonal regeneration begins around day 7 and peaks at day 14, while mitophagy is first observed at day 3 and markedly increases between days 7 and 14. (B) Western blot analysis of mitophagy-related proteins (LC3B-I/II, p62, and TOM20) at 0, 3, 7, 14, and 28 days post-injury, showing a significant upregulation of mitophagy markers between days 7 and 14. n = 4 mice. (C) Quantification of SFI scores in Cnr1-ctrl and Cnr1-cKO mice, with or without Mdivi-1 treatment, at 14 and 21 days post-injury. n = 6 mice per group. (D) Representative IF images of regenerating axons in the distal sciatic nerve labeled with Tuj1 (green). Scale bar = 1 mm. (E) Quantification of axon regeneration at 3-9 mm distal to the injury site across indicated groups. n = 3 mice. (F) TEM images of axonal remyelination in the distal sciatic nerve. Red boxes indicate magnified regions. Scale bars: 5 μm (overview), 1 μm (zoomed). (G) Quantification of myelin g-ratio showing reduced values in Cnr1-cKO mice, which were reversed by Mdivi-1 treatment. Right: scatter plot displaying the correlation between g-ratio and axon diameter. n = 5 mice. (H) Quantification of the number of myelinated axons (left) and amyelinated axons (right). n = 5 mice. All data are presented as mean ± SD. Statistical analysis: two-way ANOVA with Bonferroni's post hoc test (C, E), bivariate linear regression and one-way ANOVA with Tukey's post hoc test (G), one-way ANOVA with Tukey's post hoc test (H). *p < 0.05, **p < 0.01, ***p < 0.001, ****p < 0.0001.; ns, not significant. SFI, sciatic functional index; Mdivi-1, mitochondrial division inhibitor-1.
Figure 7
Figure 7
JD5037 promotes nerve repair by antagonizing CB1R. (A) Molecular docking analysis of JD5037 and AM6545 with CB1R. JD5037 exhibits a lower binding free energy (ΔΔG = -1.51 kcal/mol). (B) Schematic diagram of the experimental workflow. Mice underwent sciatic nerve crush injury and received daily intraperitoneal injections of JD5037 (10 mg/kg) or DMSO for 14 days. Motor function tests were performed from days 1 to 28 post-injury. Tissue collection, IHC, TEM and twitch force measurement were conducted on day 14. (C, D, E) TEM images of remyelinated axons in the distal sciatic nerve. JD5037-treated mice displayed more intact myelin sheaths, increased myelin thickness, and a significantly higher number of myelinated axons compared to the SNC and DMSO groups. Red boxes indicate magnified regions. Scale bars = 5 μm (upper), 1 μm (lower). n = 5 in Sham and JD5037 groups. n = 4 in SNC group. n = 3 in DMSO group. (F) Quantification of SFI scores of mice in each group. n = 6 in Sham group. n = 7 in SNC and DMSO groups. n = 8 in JD5037 group. (G) Quantification of score per step and the percentage of step miss in ladder rung walking test. n = 5 in Sham and SNC group. n = 6 in DMSO group. n = 7 in JD5037 group. (H) Quantification of twitch force after single electrical stimulation. n = 5 in Sham and SNC group. n = 6 in DMSO group. n = 7 in JD5037 group. (I) Schematic of ONC model followed by intravitreal injection. (J) Representative images of retinal flat mounts (top) and cross-sections (bottom) stained for Tuj1 to label retinal ganglion cells (RGCs) and axons in each group: Sham, ONC, DMSO vehicle, and JD5037 treatment. (K) Quantification of Tuj1-positive areas in the retina across groups (n = 9). All data are presented as mean ± SD. Statistical analysis: two-way ANOVA with Bonferroni's post hoc test (F, G), one-way ANOVA with Tukey's post hoc test (D, E, H, K). *p < 0.05, ***p < 0.001, ****p < 0.0001. CB1R, cannabinoid receptor 1; SNC, sciatic nerve crush; ONC, optic nerve crush; DMSO, dimethyl sulfoxide; TEM, transmission electron microscopy; IHC, immunohistochemistry; SFI, sciatic functional index; IF, immunofluorescence.
Figure 8
Figure 8
Schematic diagram illustrating CB1R-mediated regulation of calcium-induced mitophagy and its role in promoting nerve regeneration. Following peripheral nerve injury, nerve tissue analysis revealed a moderate increase in extracellular calcium concentration within the injured microenvironment, accompanied by upregulation of CB1R expression (top left). Overall, CB1R-mediated regulation of calcium-dependent mitophagy plays a key role in promoting peripheral nerve regeneration (middle left). In addition, the CB1R antagonist JD5037 mimics the effects of genetic deletion and exhibits significant neuroregenerative potential in both sciatic nerve crush (SNC) and optic nerve crush (ONC) models, suggesting promising translational value (bottom left). Mechanistically (right): In control mice (Cnr1-ctrl), CB1R is upregulated in Schwann cells after injury, suppressing calcium channel opening and limiting extracellular Ca2+ influx. This inhibition impairs Ca2+-dependent mitophagy, leading to the accumulation of damaged mitochondria, reduced Schwann cell repair capacity, and delayed axonal regeneration. In contrast, in CB1R-deficient mice (Cnr1-cKO), the absence of CB1R removes the inhibitory effect on calcium channels, allowing extracellular Ca2+ to enter Schwann cells. Concurrently, CB1R deletion enhances ANT2 expression, which activates mitophagy by PINK1/Parkin pathway, thereby efficiently clearing dysfunctional mitochondria in Schwann cells and accelerating axonal regeneration.

References

    1. Lopes B, Sousa P, Alvites R, Branquinho M, Sousa AC, Mendonça C. et al. Peripheral Nerve Injury Treatments and Advances: One Health Perspective. Int J Mol Sci. 2022;23:918. - PMC - PubMed
    1. Hussain G, Wang J, Rasul A, Anwar H, Qasim M, Zafar S. et al. Current Status of Therapeutic Approaches against Peripheral Nerve Injuries: A Detailed Story from Injury to Recovery. Int J Biol Sci. 2020;16:116–34. - PMC - PubMed
    1. Kuffler DP, Foy C. Restoration of Neurological Function Following Peripheral Nerve Trauma. Int J Mol Sci. 2020;21:1808. - PMC - PubMed
    1. Lee SK, Wolfe SW. Peripheral nerve injury and repair. J Am Acad Orthop Surg. 2000;8:243–52. - PubMed
    1. Tuffaha S, Sarhane K, Qiu C, Harris ThomasGW, Hanwright P, Mao H-Q. Translational bioengineering strategies for peripheral nerve regeneration: opportunities, challenges, and novel concepts. Neural Regen Res. 2023;18:1229. - PMC - PubMed

MeSH terms