. 2025 Sep 18;135(22):e191729.
doi: 10.1172/JCI191729. eCollection 2025 Nov 17.

Disrupting integrator complex subunit INTS6 causes neurodevelopmental disorders and impairs neurogenesis and synapse development

Affiliations

Disrupting integrator complex subunit INTS6 causes neurodevelopmental disorders and impairs neurogenesis and synapse development

Xiaoxia Peng et al. J Clin Invest. .

Abstract

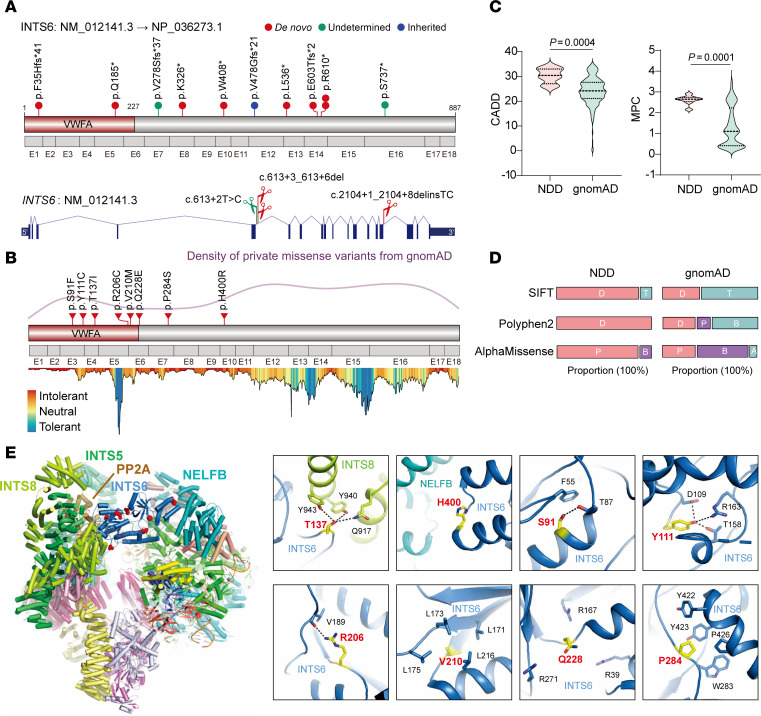
The Integrator complex plays essential roles in RNA polymerase II (RNAPII) transcription termination and RNA processing. Here, we identify INTS6, a subunit of the Integrator complex, as a novel gene associated with neurodevelopmental disorders (NDDs). Through analysis of large NDD cohorts and international collaborations, we identified 23 families harboring monoallelic likely gene-disruptive or de novo missense variants in INTS6. Phenotypic characterization revealed shared features, including language and motor delays, autism, intellectual disability, and sleep disturbances. Using a nervous-system conditional KO (cKO) mouse model, we show that Ints6 deficiency disrupts early neurogenesis, cortical lamination, and synaptic development. Ints6 cKO mice had a thickened ventricular zone/subventricular zone, thinning of the cortical plate, reduced neuronal differentiation, and increased apoptosis in cortical layer 6. Behavioral assessments of heterozygous mice revealed deficits in social novelty preference, spatial memory, and hyperactivity, mirroring phenotypes observed in individuals with INTS6 variants. Molecular analyses further revealed that INTS6 deficiency alters RNAPII dynamics, disrupts transcriptional regulation, and impairs synaptic gene expression. Treatment with a CDK9 inhibitor (CDK9i) reduced RNAPII phosphorylation, thereby limiting its binding to target genes. Notably, CDK9i reversed neurosphere overproliferation and rescued the abnormal dendritic spine phenotype caused by Ints6 deficiency. This work advances understanding of INTS-related NDD pathogenesis and highlights potential therapeutic targets for intervention.

Keywords: Genetic variation; Genetics; Neuroscience.


Figures

Figure 1
Figure 1. Expression patterns of INTS1–15 in the human brain and enrichment of de novo variants in NDD cohorts.
(A) Schematic representation of binary interactions within the INTS-PP2A complex, adapted from Offley et al. (62). Genes highlighted in red represent well-known NDD genes. (B) Normalized expression levels of INTS115 genes across various developmental stages, including fetal stages, birth, infancy, childhood, teenage, and adulthood. Expression data are displayed as log2(RPKM+1) values, with color coding highlighting gene-specific trends over time. (C) UMAP plot of single-cell RNA-Seq data showing the average expression patterns of INTS1–15 genes across distinct cell types, including microglia, astrocytes (AST), oligodendrocyte progenitor cells (OPC), excitatory neurons (ExNeu), inhibitory neurons (IN), vascular cells, and glial progenitors (GLIALPROG). (D) Left: Gene constraint metrics, including loss-of-function observed/expected upper bound fraction (LOEUF) scores and missense Z scores for loss-of-function (LGD) and missense variants, respectively, reflecting the genetic tolerance of INTS genes. Right: Enrichment analysis showing the significance of de novo LGD or missense variants in INTS115 among NDD cohorts, compared with expected random occurrences. FWER,family-wise error rate.
Figure 2
Figure 2. Monoallelic variants in INTS6 lead to a new NDD syndrome.
(A) The distributions of nonsense, frameshift, and splicing variants in INTS6 identified in NDDs are shown in a protein model and gene model, respectively. (B) The distribution of missense variants in INTS6 identified in NDDs is shown in a protein model. Protein tolerance landscape for missense variants in INTS6 was visualized via MetaDome20. All variants in INTS6 are predicted to be “intolerant” for aa substitutions. The density plot of ultrarare missense variants in gnomAD is shown. (C) Comparison of the distribution of combined annotation-dependent depletion (CADD) and MPC scores between de novo missense variants in NDDs and ultrarare missense variants in gnomAD database. Data are reported as mean ± SEM. P values were determined from a 2-tailed, unpaired Mann-Whitney test. (D) Comparison of SIFT, PolyPhen-2, and AlphaMissense prediction between de novo missense variants in NDDs and ultrarare missense variants in the gnomAD database. SIFT: D (deleterious), T (tolerated); PolyPhen-2: D (probably damaging), P (possibly damaging), B (benign); AlphaMissense: P (likely pathogenic), B (likely benign), A (ambiguous). (E) Left: Ribbon diagram of the INTS-PP2A complex bound to paused Pol II (PDB:7PKS). The disease-associated protein INTS6 and its interacting proteins are labeled. Right: Close-up view of NDD-related variants on INTS6 (red spheres), highlighting the importance of these residues in mediating protein-protein interactions or maintaining the structural integrity of INTS6.
Figure 3
Figure 3. Phenotypic spectrum of individuals carrying INTS6 variants.
M, male; F, female; D, de novo; I, inherited; U, undetermined; +, present; –, absent; /, no data or undetermined.
Figure 4
Figure 4. Ints6 deficiency interferes with neurogenesis and cortical lamination.
(A) DAPI staining of cortical sections from E18.5 WT, cHET, and cKO mice (n = 5 per group), with measurements of cortical thickness. White dashed lines indicate the VZ/SVZ, intermediate zone (IZ) and CP. (B) Immunofluorescence of E18.5 cortical sections stained for layer-specific markers: Satb2 (red) for layers II-IV, Ctip2 (green) for layer V, and Tbr1 (cyan) for layer VI. Cortical thickness was quantified across genotypes (n = 5). (C) Magnified views of cortical marker staining in B and statistical analysis of cell numbers, n = 5. (D) Pax6 (green) and Tbr2 (red) staining in the SVZ and VZ of E15.5 embryonic brains, comparing WT, cHET, and cKO (n = 5 per group). Quantification of cortical thickness and Pax6+ and Tbr2+ cells are shown. (E) Triple labeling with Pax6 (cyan), Tbr2 (red), and Edu (green) at 0.5 hours post-injection in E15.5 cortices of WT, cHET, and cKO mice, to evaluate proliferative dynamics (n = 5 per group). (F) Neurosphere growth curves (days 4, 6, and 8). P values were determined from 2-way ANOVA with Dunnett’s multiple comparisons test. (G) EdU (green) with 24-hour labeling and ki67 (red) staining in WT, cHET, and cKO cortex at E15.5, showing differentiative capacity. (H)Tbr1 (red) and cleaved-caspase-3 (green) staining in E18.5 embryonic brains (n = 5 per group). DAPI-stained nuclei are shown in blue. *P < 0.05, **P < 0.01, ***P < 0.001. Scale bar: 50 μm in (AG), 100 μm in (H). Each biological replicate (mouse) is color-coded; gray dots show individual data point, and colored dots indicate the mean per mouse. (AE, G, and H) Data are reported as mean ± SEM. P values were determined from 1-way ANOVA with Dunnett’s multiple comparisons test.
Figure 5
Figure 5. Ints6 deficiency disrupts PP2A-RNAPII function.
(A) Heatmap and spatial distribution of RNAPII binding at the TSS of genes analyzed by CUT&Tag in WT and cKO E15.5 mice. (B) Average distribution profile of RNAPII across gene regions, including TSSs and TESs. (C) Spatial distribution and heatmap representation of the distance of RNAPII binding around the TSS of RIP-Seq genes. (D) Average distribution profile of RNAPII across coding sequences (CDS) regions of RIP-Seq. The gradient of blue to white color (AD) indicates high to low counts in the corresponding region. (E) A Venn diagram illustrating the overlap between DGEs (P < 0.05) identified in RNA-Seq and CUT&Tag data sets. (F) Heatmap analysis of the relative expression levels of 2,374 genes in the overlap of RNA-Seq and CUT&Tag. Upregulated genes are depicted in blue; downregulated genes are shown in red. (G) Bar graph depicting enriched KEGG pathways identified from the overlap data. (H) Bubble plot depicting enriched GO terms identified from the overlap data. (I) Browser tracks of CUT&Tag profiles for the genes related to the cell cycle at E15.5 days of embryonic development, comparing expression levels in WT and INTS6 cKO mice. (J) Western blot analysis of total RNAPII and Ser2P in HEK293T cells transfected with either WT, missense variants (n = 5), or LGD variants (n = 8). P values were determined from Friedman with Dunnett’s multiple comparisons test. (K) Statistical analysis of the effects of CDK9i on the growth of WT (n = 27 DMSO-treated; n = 14 CDK9i-treated); cHET (n = 23 DMSO-treated, n = 18 CDK9i-treated) and cKO (n = 12 DMSO-treated, n = 19 CDK9i-treated) neurosphere. P values were determined from a 2-tailed unpaired t test and Mann-Whitney test. *P < 0.05, **P < 0.01. CON, control. Data are reported as mean ± SEM.
Figure 6
Figure 6. Ints6 cHET mice lead to social and cognitive impairments.
(A) Heatmaps depicting the movement of WT (n = 14) or cHET (n = 14) mice in a 3-chamber social interaction test. Preference scores were calculated as (S – E)/(S + E) for social versus empty interactions and (S2 – S1)/(S2 + S1) for stranger versus original mouse interactions. Data are reported as mean ± SEM. P values were determined from a 2-tailed unpaired t test. (B) Morris water maze test of spatial learning and memory in Ints6 cHET mice. Latent time (s) during training trials, time in platform quadrant, and distance traveled are measured (n = 14). Data are reported as mean ± SEM. P values were determined from 2-way ANOVA with Bonferroni’s multiple comparisons test and a 2-tailed unpaired Mann-Whitney test. (C) Elevated cross-maze experiments were performed with WT (n = 13) and cHET (n = 14) mice to evaluate anxiety-related behaviors. The experiments statistically analyzed the movement distance and dwell time in both the open and closed arms of the maze. Data are reported as mean ± SEM. P values were determined from a 2-tailed unpaired Mann-Whitney test. (D) Path-tracking images from an open field test, showing movement patterns of WT (n = 14) and cHET (n = 15) mice. Bar graph representing the distance traveled and the time spent in the central area of the open field over 10 minutes. Data are reported as mean ± SEM. P values were determined from a 2-tailed unpaired t test. *P < 0.05, **P < 0.01, ***P < 0.001, ****P < 0.0001. snRNP, small nuclear ribonucleoprotein.
Figure 7
Figure 7. Ints6 deficiency interferes synapse development.
(A) Dendritic spine from 5-week-old mice harboring the Thy1-GFP transgene. Density of dendritic spine and the 3 different morphological spine types expressed as the number of spines normalized to 10 μm of dendritic length. Scale bar: 5 μm. (B) Golgi staining of dendritic spines in the cortex layer 2/3 neurons. Density of dendritic spine and the 3 different morphological spine types expressed as the number of spines normalized to 10 pixel of dendritic length. Scale bar: 100 pixels. P values were determined from a 2-tailed unpaired Mann-Whitney and t test. (C) Brain tissue slices from 7-week-old mice were imaged using electron microscopy to visualize synaptic structures. The red arrow indicates the dense postsynaptic region. ImageJ software was used to measure the length of the synapse contact and count synapses. Scale bar: 0.5 μm. (D) PSD-95 (red) and synaptophysin (green) antibodies were used to stain synapses in the cortical in 2-month-old mice. Graphs depict relative integrated density of PSD-95 and synaptophysin. Scale bar: 2 μm. (E) Analysis of SynGO cell components shows overlapping genes represented in a sector diagram. The central sector corresponds to the highest-level term, “synapse,” with subsequent outward sectors depicting its subclasses. (F) Representative images showing spine density in neurons transfected with WT or variant constructs. The graphs display statistical analyses of total, immature, mushroom, and stubby spine densities. Scale bar: 5 μm. P values were determined from 1-way ANOVA with Dunnett’s multiple comparisons test. (A, C, and D). P values were determined from a 2-tailed unpaired t test. *P < 0.05, **P < 0.01, ***P < 0.001, ****P < 0.0001. Each biological replicate (mouse) is color-coded; gray dots show individual data points, and colored dots indicate the mean per mouse. Data are reported as mean ± SEM.

References

    1. Thapar A, et al. Neurodevelopmental disorders. Lancet Psychiatry. 2017;4(4):339–346. doi: 10.1016/S2215-0366(16)30376-5. - DOI - PubMed
    1. Kaplanis J, et al. Evidence for 28 genetic disorders discovered by combining healthcare and research data. Nature. 2020;586(7831):757–762. doi: 10.1038/s41586-020-2832-5. - DOI - PMC - PubMed
    1. Satterstrom FK, et al. Large-scale exome sequencing study implicates both developmental and functional changes in the neurobiology of autism. Cell. 2020;180(3):568–584. doi: 10.1016/j.cell.2019.12.036. - DOI - PMC - PubMed
    1. Willsey HR, et al. Genomics, convergent neuroscience and progress in understanding autism spectrum disorder. Nat Rev Neurosci. 2022;23(6):323–341. doi: 10.1038/s41583-022-00576-7. - DOI - PMC - PubMed
    1. Chen Y, et al. De novo variants in the RNU4-2 snRNA cause a frequent neurodevelopmental syndrome. Nature. 2024;632(8026):832–840. doi: 10.1038/s41586-024-07773-7. - DOI - PMC - PubMed

Substances