. 2025 Sep 18;5(9):e0005135.
doi: 10.1371/journal.pgph.0005135. eCollection 2025.

State-by-state influenza outbreaks and oversee: A Markov chain study of California and North Carolina, USA

Affiliations

State-by-state influenza outbreaks and oversee: A Markov chain study of California and North Carolina, USA

Asma Akter Akhi et al. PLOS Glob Public Health. .

Abstract

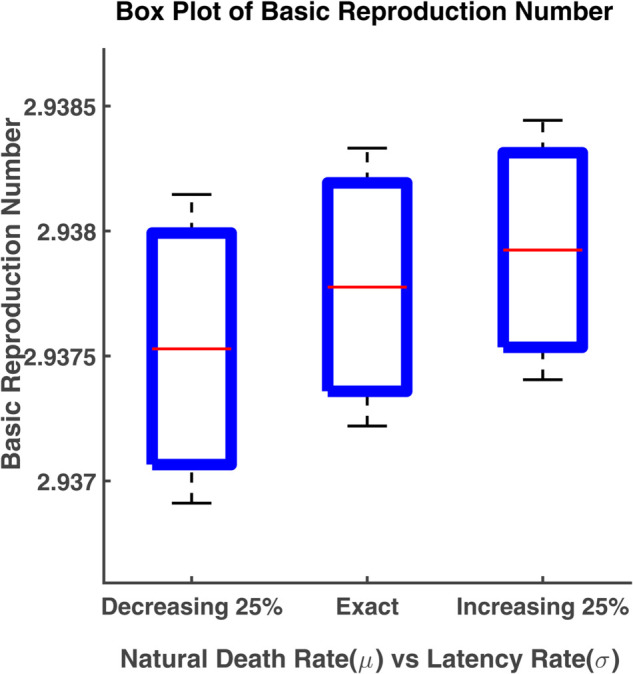
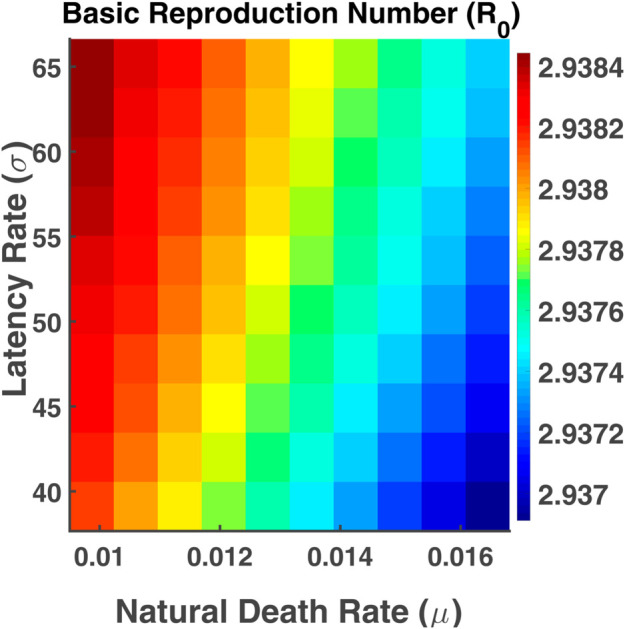
Influenza, a significant public health concern, spreads rapidly and causes seasonal epidemics and pandemics. Mathematical models are essential tools for devising effective strategies to combat this pandemic. Various models have been utilized to study influenza's transmission dynamics and control measures. This paper presents the SEIRS (Susceptible-Exposed-Infectious-Recovered-Susceptible) model to analyze the disease's transmission dynamics. The model analyzes real data from California and North Carolina to assess trends, identify key factors, and project the nationwide spread of the disease. Subsequently, we calculate the basic reproduction number ([Formula: see text]) using the next-generation matrix method. Sensitivity analysis using Latin Hypercube Sampling (LHS) has been conducted to identify the model's most influential parameters. We graphically demonstrate how different parameters affect the exposed and infected populations, as well as the variation in the basic reproduction number with changes in parameters. We illustrate the interconnected behavior of the effective reproduction number alongside the different compartments and the basic reproduction number. We use phase plane analysis to examine the relationship between two compartments under varying parameters. Visual tools like boxplots, contour plots, and heat maps provide insights into how different factors influence the basic reproduction number and disease transmission. We investigate the stochastic behavior of the model by transforming it into a Continuous-Time Markov Chain (CTMC) model and visualizing the results graphically. We apply the SEIRS model to real influenza data, showcasing its effectiveness in analyzing transmission dynamics, predicting outbreaks, and evaluating public health strategies for better epidemic management.


Conflict of interest statement

The authors have declared that no competing interests exist.

Figures

Fig 1
Fig 1. Predicted future influenza in California.
Simulated future influenza trends based on historical data and predictive modeling.
Fig 2
Fig 2. Diagrammatic representation of the SEIRS model’s transmission dynamics.
Fig 3
Fig 3. PRCC values for influenza model.
PRCC values for SEIRS influenza model parameters.
Fig 4
Fig 4. P-values for influenza model.
p-values for SEIRS influenza model parameters.
Fig 5
Fig 5. SEIRS model trajectories.
Evolution of susceptible (S), exposed (E), infected (I), and recovered (R) populations over time.
Fig 6
Fig 6. Trajectories of exposed and infected population.
Dynamical behavior of exposed (E) and infected (I) populations over time where (S0,E0,I0,R0)=(99.9,0.1,0,0) [19].
Fig 7
Fig 7. Impact of transmission rate (β) on exposed population.
Effect of transmission rate (β) on exposed population (E(t)).
Fig 8
Fig 8. Impact of transmission rate (β) on infected population.
Effect of transmission rate (β) on infected individuals (I(t)).
Fig 9
Fig 9. Impact of transmission rate (β) on susceptible population.
Effect of transmission rate (β) on susceptible population (S(t)).
Fig 10
Fig 10. Effect of recovery rate (γ) on exposed population.
Effect of recovery rate (γ) on exposed population (E).
Fig 11
Fig 11. Effect of recovery rate (γ) on infected population.
Effect of recovery rate (γ) on infected population (I).
Fig 12
Fig 12. Effect of recovery rate (γ) on susceptible population.
Effect of recovery rate (γ) on susceptible population (S).
Fig 13
Fig 13. Basic reproduction number vs transmission rate.
Variation of the basic reproduction number (R0) with transmission rate (β).
Fig 14
Fig 14. Basic reproduction number vs transmission rate.
Variation of the basic reproduction number (R0) with recovery rate (γ).
Fig 15
Fig 15. SEIRS model dynamics with effective reproduction number Re.
Dynamics of all compartments: S, E, I, R, and the effective reproduction number (Re).
Fig 16
Fig 16. Dynamics of S(t), R(t), and Re(t) in the SEIRS model.
Dynamics of S, R, and Re highlighting long-term interactions.
Fig 17
Fig 17. Susceptible population vs effective reproduction number.
Comparison between the susceptible population (S) and Re.
Fig 18
Fig 18. Recovered population vs effective reproduction number.
Comparison between the recovered population (R) and Re.
Fig 19
Fig 19. Effective reproduction number (Re).
The variation of the effective reproduction number (Re) as a function of the susceptible population (S) and basic reproduction number (R0).
Fig 20
Fig 20. Effect of transmission rate (β) on I(t) vs S(t).
Phase plane of I(t) vs. S(t) compartments under varying transmission rate (β).
Fig 21
Fig 21. Effect of transmission rate (β) on I(t) vs E(t).
Phase plane of I(t) vs. E(t) compartments under varying transmission rate (β).
Fig 22
Fig 22. Effect of transmission rate (β) on I(t) vs R(t).
Phase plane of I(t) vs. R(t) compartments under varying transmission rate (β).
Fig 23
Fig 23. Effect of transmission rate (β) on S(t) vs R(t).
Phase plane of S(t) vs. R(t) compartments under varying transmission rate (β).
Fig 24
Fig 24. Effect of recovery rate (γ) on I(t) vs S(t).
Phase plane of I(t) vs. S(t) compartments under varying recovery rate (γ).
Fig 25
Fig 25. Effect of recovery rate (γ) on I(t) vs E(t).
Phase plane of I(t) vs. E(t) compartments under varying recovery rate (γ).
Fig 26
Fig 26. Effect of recovery rate (γ) on I(t) vs R(t).
Phase plane of I(t) vs. R(t) compartments under varying recovery rate (γ).
Fig 27
Fig 27. Effect of recovery rate (γ) on S(t) vs R(t).
Phase plane of S(t) vs. R(t) compartments under varying recovery rate (γ).
Fig 28
Fig 28. Box plot of basic reproduction number.
Box plot of R0 vs. parameters β and γ.
Fig 29
Fig 29. Box plot of basic reproduction number.
Box plot of R0 vs. parameters β and σ.
Fig 30
Fig 30. Box plot of basic reproduction number.
Box plot of R0 vs. parameters μ and σ.
Fig 31
Fig 31. Peak infected population in SEIRS model.
Contour plot analysis of I(t) as a function of β vs. γ.
Fig 32
Fig 32. Basic reproduction number (R0).
Contour plot analysis of R0 as a function of β vs. γ.
Fig 33
Fig 33. Basic reproduction number (R0).
Contour plot analysis of R0 as a function of β vs. σ.
Fig 34
Fig 34. Basic reproduction number (R0).
Contour plot analysis of R0 as a function of μ vs. γ.
Fig 35
Fig 35. Basic reproduction number (R0).
Contour plot analysis of R0 as a function of σ vs. γ.
Fig 36
Fig 36. Basic reproduction number (R0).
Contour plot analysis of R0 as a function of β vs. ω.
Fig 37
Fig 37. Peak infected population in SEIRS model.
Heatmaps of I(t) vs. parameters β and γ.
Fig 38
Fig 38. Basic reproduction number (R0).
Heatmaps of R0 vs. parameters μ and σ.
Fig 39
Fig 39. Basic reproduction number (R0).
Heatmaps of R0 vs. parameters σ and γ.
Fig 40
Fig 40. Exact vs model infected population (weekly cases-California).
Model fit to actual data (California).
Fig 41
Fig 41. Predicted future influenza trends in California.
Forecasted long-term dynamics of infected population (California).
Fig 42
Fig 42. Exact vs model infected population (weekly cases-North Carolina).
Model fit to actual data (North Carolina).
Fig 43
Fig 43. Predicted future influenza trends in North Carolina.
Forecasted long-term dynamics of infected population (North Carolina).
Fig 44
Fig 44. CTMC integrated with deterministic dynamics.
Comparison of stochastic paths and deterministic trajectories in a CTMC model, depicting the evolution of susceptible, exposed, infected, and recovered compartments over 1.5 years.
Fig 45
Fig 45. CTMC with the deterministic trajectory for S.
Susceptible population (S) over time: stochastic (solid) vs deterministic (dashed).
Fig 46
Fig 46. CTMC with the deterministic trajectory for E.
Exposed population (E) over time: stochastic (solid) vs deterministic (dashed).
Fig 47
Fig 47. CTMC with the deterministic trajectory for I.
Infected population (I) over time: stochastic (solid) vs deterministic (dashed).
Fig 48
Fig 48. CTMC with the deterministic trajectory for R.
Recovered population (R) over time: stochastic (solid) vs deterministic (dashed).

References

    1. Kilbourne ED. Influenza pandemics of the 20th century. Emerg Infect Dis. 2006;12(1):9–14. doi: 10.3201/eid1201.051254 - DOI - PMC - PubMed
    1. Yang KH, Hsu JY. A new SIR-based model for influenza epidemic. Int J Health Med Eng. 2012;6(7):701–6.
    1. Al Hajjar S, McIntosh K. The first influenza pandemic of the 21st century. Ann Saudi Med. 2010;30(1):1–10. doi: 10.4103/0256-4947.59365 - DOI - PMC - PubMed
    1. Nicholson KG, McNally T, Silverman M, Simons P, Zambon MC. Influenza-related hospitalizations among young children in Leicestershire. Pediatr Infect Dis J. 2003;22(10 Suppl):S228-30. doi: 10.1097/01.inf.0000092193.91306.2f - DOI - PubMed
    1. Zaman RU, Alamgir ASM, Rahman M, Azziz-Baumgartner E, Gurley ES, Sharker MAY. Influenza in outpatient ILI case-patients in national hospital-based surveillance, Bangladesh 2007–2008. PLoS One. 2009;4(12):e8452. doi: 10.1371/journal.pone.0008452 - DOI - PMC - PubMed

LinkOut - more resources