. 2025 Sep 18:10.1158/0008-5472.CAN-25-2024.
doi: 10.1158/0008-5472.CAN-25-2024. Online ahead of print.

KRAS Inhibition Activates an Actionable CD24 "Don't Eat Me" Signal in Pancreatic Cancer

Affiliations

KRAS Inhibition Activates an Actionable CD24 "Don't Eat Me" Signal in Pancreatic Cancer

Yongkun Wei et al. Cancer Res. .

Abstract

KRASG12C inhibitors (G12Ci) have produced encouraging, albeit modest and transient, clinical benefit in pancreatic ductal adenocarcinoma (PDAC). Identifying and targeting resistance mechanisms to G12Ci treatment is therefore crucial. To better understand the function of KRASG12C and possible G12Ci bypass mechanisms, we developed an autochthonous KRASG12C-driven PDAC model. Compared to the classical KRASG12D PDAC model, the G12C model exhibits slower tumor growth, yet similar histopathological and molecular features. Aligned with clinical experience, G12Ci treatment of KRASG12C tumors produced modest impact despite stimulating a 'hot' tumor immune microenvironment. Immunoprofiling revealed that CD24, a 'don't eat me' signal, is significantly upregulated on cancer cells upon G12Ci treatment. Blocking CD24 enhanced macrophage phagocytosis of cancer cells and significantly sensitized tumors to G12Ci treatment. Similar findings were observed in KRASG12D-driven PDAC. Together, this study reveals common and distinct oncogenic KRAS allele-specific biology and identifies a clinically actionable adaptive mechanism that may improve the efficacy of oncogenic KRAS inhibitor therapy in PDAC.


Figures
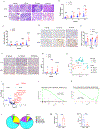
Figure 1.
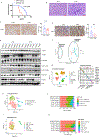
Figure 1.. Tumor development is delayed in the KCPC model compared to KDPC model.
A. HE staining of mouse pancreas tissues from KCPC and KDPC model between 4 to 16 weeks. Scale bar: 100 μm. B. PanIN/ADM lesions numbers at different weeks of KCPC and KDPC mice under 200X fields. C. PanIN/ADM lesions area percentage at different weeks of KCPC and KDPC mice under 40X fields. D. E, Representative images and H score of p-ERK IHC staining in the PanIN areas of mice tissues at different weeks of KCPC and KDPC mice. Scale bar: 100 μm. F. G, Representative images and percentage of Ki67 IHC staining of mice tissues at different weeks of KCPC and KDPC. Scale bar: 100 μm. H. Principal component analysis (PCA) of top 3000 variedly expressed genes showed a clear difference between KDPC and KCPC samples. I. Volcano plot of DEG analysis showed differentially expressed genes between KDPC and KCPC samples. The Acinar cell marker genes (red) and progenitor cell marker genes (blue) are labelled. J. Gene set enrichment analysis (GSEA) plot showing the enrichment scores for acinar markers in KCPC samples. K. GSEA plot showing the enrichment scores for exocrine progenitor markers in KDPC samples. L. Multiplex immunofluorescent staining results showed composition of immune cell populations in KCPC and KDPC samples. M. Quantification of granulocytes populations in total immune cells in KCPC and KDPC samples. Data, mean ± SEM; n = 4. N. Quantification of dendritic cell populations in total immune cells in KCPC and KDPC samples. Data, mean ± SEM; n = 4. n.s. not significant. * P<0.05, ** P<0.01, *** P<0.001, ****P<0.0001
Figure 2.
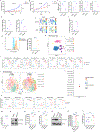
Figure 2.. Advanced PDAC from KCPC and KDPC models exhibit similar histopathological and molecular features.
A, Kaplan–Meier curves depicting survival of KCPC and KDPC mice. Statistical significance was determined by the log-rank test. B, HE staining of mouse pancreatic tumor tissues from KCPC and KDPC model. Scale bar: 100 μm. C, Representative images and H score of p-ERK IHC staining of mice tumor tissues of KCPC and KDPC model. Scale bar: 100 μm. n.s. not significant. D, Western blots of whole-cell lysates from KCPC and KDPC cancer cell lines. E, Representative images and H score of KRAS IHC staining of mice tumor tissues of KCPC and KDPC model. Scale bar: 100 μm. n.s. not significant. F, PCA of top 5000 variedly expressed genes showed KDPC lines are clustered into two groups, and KCPC lines are clustered together with KDPC lines of the progenitor subtype. G, UMAP on three KCPC and KDPC tumor tissues. Populations are identified by color (see legend), Violin plots of key markers used to define the identified cell populations were shown in right panel. H, I, Integrated UMAP of cancer cells from KCPC and KDPC mice showing Louvain clusters (H) and tumor subtypes (I). J, K, Integrated UMAP of cancer-associated fibroblasts (CAFs) from KCPC and KDPC mice showing Louvain clusters (J) and CAF types (K).
Figure 3.
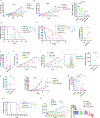
Figure 3.. KRASG12C inhibitor reprograms PDAC tumor microenvironment and upregulates cancer cell CD24 expression.
A, B, Growth curves of subcutaneous allograft tumors (A,49725; B, 50760) show change in tumor volume over vehicle or AMG 510 treatment. Data, mean ± SEM. C, Quantification of the immune cell populations by CyTOF immune profiling. Data, mean ± SEM; n = 3. The statistical difference between vehicle and AMG 510 treated groups was determined by two-tailed t tests. D, Quantification of macrophage populations by CyTOF analysis. Data, mean ± SEM; n = 3. E, Representative viSNE plots of p-SHP2+ macrophage populations in KCPC mouse pancreatic tumor with vehicle or AMG 510 treatment. F, Quantification of p-SHP2+ macrophage populations in E. Data, mean ± SEM; n = 3. G, Median of membrane CD24+ in 50760 KCPC cancer cells treated with vehicle or AMG 510 was measured by flow cytometry. Data, mean ± SEM; the statistical difference between experimental groups was determined by two-tailed t tests. H, UMAP on three vehicle and AMG 510 treated 49725 KCPC tumor tissues. Immune cell populations are identified by color (see legend). I, Percentages and P value of each cell type in H. J, UMAP on three vehicle and AMG 510 treated 49725 KCPC tumor tissues. Subpopulations of macrophages are identified by color (see legend). K, Percentages and P value of each subtype in J. L, Expression of Siglecf in different subtypes of macrophages with vehicle or AMG 510 treatment. V: vehicle; A: AMG 510. M, qRT-PCR for CD24 expression in 50760 KCPC cancer cells treated with vehicle or AMG 510. Data, mean ± SEM; n = 3. The statistical difference was determined by two-tailed t tests. N, Western blots of whole-cell lysates from vehicle or AMG 510 treated 50760 KCPC cancer cell lines. O, Median of membrane CD24+ in 50760 KCPC cancer cells treated with vehicle, AMG 510 or AMG plus C188–9 was measured by flow cytometry. Data, mean ± SEM; the statistical difference between experimental groups was determined by two-tailed t tests. P, qRT-PCR for CD24 expression in 50760 KCPC cancer cells treated with vehicle, AMG 510 or AMG plus C188–9. Data, mean ± SEM; n = 3. The statistical difference was determined by two-tailed t tests. Q, Western blots of whole-cell lysates from 50760 KCPC cancer cell lines treated with vehicle, AMG 510 or AMG 510 with CCL2 knockout. R, Median of membrane CD24+ in 50760 KCPC cancer cells treated with vehicle, AMG 510 or AMG 510 with CCL2 knockout was measured by flow cytometry. S, In vitro phagocytosis of mouse 50760-GFP PDAC cells cocultured with macrophage cell line RAW264.7 in the presence of AMG 510, anti-CD24 mAb, or dual treatment vs. IgG control. Phagocytosis was measured as the number of F4/80+, GFP+ macrophages, quantified as a percentage of the total F4/80+ macrophages. Data, mean ± SEM; n = 3. Statistics with significance were indicated, n.s. not significant; * P <0.05; ** P <0.01; ***, P < 0.001, **** P <0.0001.
Figure 4.
Figure 4.. Targeting CD24 sensitizes pancreatic cancer to both KRASG12C and KRASG12D inhibitors in vivo.
A, B, Growth curves of subcutaneous allograft KCPC tumors (A,49725; B, 50760) show change in tumor volume over vehicle, anti-CD24, AMG 510 or anti-CD24 + AMG 510 treatment. Data, mean ± SEM. C, Orthotopically injected KCPC tumors (50760) were measured by MRI for tumor volumes in vehicle, anti-CD24, AMG 510 or anti-CD24 + AMG 510 treatment. Data, mean ± SEM. D, Kaplan–Meier curves depicting overall survival of KCPC mice in C. Statistical significance was determined by the log-rank test. E, Kaplan–Meier curves depicting overall survival of KCPC GEM mice with vehicle, anti-CD24, AMG 510 or anti-CD24 + AMG 510 treatment. Statistical significance was determined by the log-rank test. F, In vivo phagocytosis. Mouse 50760-GFP PDAC cells were injected into the right flank of C57BL/6 mice and treated with IgG control or AMG 510+ anti-CD24 mAb for 14 days. Mice tumor tissues were collected for flow cytometry. Phagocytosis was measured as the number of F4/80+, GFP+ macrophages, quantified as a percentage of the total F4/80+ macrophages. Data, mean ± SEM; n = 4. G, Mice tumor tissues collected in F were measured by flow cytometry for F4/80 and p-SHP2. The percentage of p-SHP2+ macrophages were compared in IgG control or AMG 510+ anti-CD24 mAb groups. Data, mean ± SEM; n = 4. H, Growth curves of subcutaneous allograft KCPC tumor (50760) show changes in tumor volume over vehicle, vehicle + anti-CSF1R, anti-CD24 + AMG 510 (combination), or anti-CSF1R + combination treatment. Data, mean ± SEM. I, Growth curves of subcutaneous allograft KCPC tumor (50760) in C57BL/6 mice or TCR−/− mice show changes in tumor volume over vehicle and anti-CD24 + AMG 510. Data, mean ± SEM. J, Median of membrane CD24+ in KDPC cancer cells (55582) treated with vehicle or MRTX1133 was measured by flow cytometry. Data, mean ± SEM; the statistical difference between experimental groups was determined by two-tailed t tests. K, qRT-PCR for CD24 expression in KDPC cancer cells (55582) treated with vehicle or MRTX1133. Data, mean ± SEM; n = 3. The statistical difference was determined by two-tailed t tests. L, Growth curves of subcutaneous allograft KDPC tumor (55582) show change in tumor volume over vehicle, anti-CD24, MRTX1133 or anti-CD24 + MRTX1133 treatment. Data, mean ± SEM. M, Orthotopically injected KDPC tumors (55582) were measured by MRI for tumor volumes in vehicle, anti-CD24, MRTX1133 or anti-CD24 + MRTX1133 treatment. Data, mean ± SEM. N, Kaplan–Meier curves depicting overall survival of KDPC mice in M. Statistical significance was determined by the log-rank test. O, Left, Growth curves of human KRAS G12D tumors (AsPC1) show change in tumor volume over vehicle, anti-CD24, MRTX1133 or anti-CD24 + MRTX1133 treatment. Data, mean ± SEM. Right, Waterfall plot of vehicle, anti-CD24, MRTX1133 or anti-CD24 + MRTX1133-treated tumors showing a change in tumor volume after treatment compared with baseline at day 0. Each bar represents a single tumor. Statistics with significance were indicated, n.s. not significant; * P <0.05; ** P <0.01; ***, P < 0.001, **** P <0.0001.

Update of

References

    1. Cox AD, Fesik SW, Kimmelman AC, Luo J, Der CJ. Drugging the undruggable RAS: Mission possible? Nat Rev Drug Discov 2014;13:828–51 - PMC - PubMed
    1. Haigis KM. KRAS Alleles: The Devil Is in the Detail. Trends Cancer 2017;3:686–97 - PMC - PubMed
    1. Hunter JC, Manandhar A, Carrasco MA, Gurbani D, Gondi S, Westover KD. Biochemical and Structural Analysis of Common Cancer-Associated KRAS Mutations. Mol Cancer Res 2015;13:1325–35. - PubMed
    1. Lee JK, Sivakumar S, Schrock AB, Madison R, Fabrizio D, Gjoerup O, et al. Comprehensive pan-cancer genomic landscape of KRAS altered cancers and real-world outcomes in solid tumors. NPJ Precis Oncol 2022;6:91. - PMC - PubMed
    1. Waters AM, Der CJ. KRAS: The Critical Driver and Therapeutic Target for Pancreatic Cancer. Cold Spring Harb Perspect Med 2018;8:a031435. - PMC - PubMed

LinkOut - more resources