. 2025 Sep 5;53(17):gkaf885.
doi: 10.1093/nar/gkaf885.

The nuclear pore complex acts as a hub for pri-miRNA transcription and processing in plants

Affiliations

The nuclear pore complex acts as a hub for pri-miRNA transcription and processing in plants

Lucia Gonzalo et al. Nucleic Acids Res. .

Abstract

The regulation of miRNA biogenesis and movement is essential for plant development and environmental responses. HASTY (HST), a karyopherin protein, has been implicated in miRNA biogenesis and movement, though its role in non-cell-autonomous miRNA movement remains unclear. Through a genetic screen, we identified that mutations in the HAWAIIAN SKIRT (HWS) gene suppress the developmental defects of hst mutants by restoring miRNA movement. Our findings show that HWS interacts with nuclear transport factors and nuclear pore complex (NPC) components, including NUP1, positioning HWS as a regulator of miRNA nuclear export. Using microscopy and fluorescence in situ hybridization, we showed that pri-miRNA transcription, and likely their co-transcriptional processing, occur at the nuclear pore. Notably, we uncovered an antagonistic relationship between HST and HWS in regulating MIRNA transcription at the NPC and AGO1 loading, which could explain the observed changes in miRNA movement. HST promotes the association of MIRNA loci with the NPC, spatially positioning co-transcriptional processing by the NPC. Conversely, HWS negatively regulates this process by degrading MEDIATOR 37 subunits and detaching the processing complex from the NPC. Our data provide evidence of spatial coordination of miRNA transcription, biogenesis, and movement, highlighting a novel role for the NPC in the miRNA pathway.


Conflict of interest statement

The authors declare no competing interests.

Figures

Graphical Abstract
Graphical Abstract
Figure 1.
Figure 1.
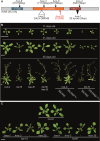
A mutation in HWS reverses the hst phenotype. (A)- Schematic representation of HWS. Previously published mutant alleles of HWS are indicated in black. The new HWS mutant allele identified in this study (hws-35) is marked. Single-nucleotide mutations are displayed with arrows, T-DNA insertions with empty triangles, and deletions with triangles. (B)- Phenotypes of 13-, 20-, and 35-day-old Col-0 wild type and mutant plants. Scale bar = 1 cm. (C)- Phenotype of 20-day-old HST/HWS double-mutants combining different alleles of both mutants. Scale bar = 1 cm. In B and C, plants were imaged individually and mounted in a single black background square to facilitate comparison.
Figure 2.
Figure 2.
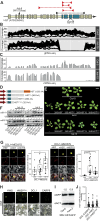
hst-15 is a hypomorphic allele. (A) Schematic representation of the HST gene. Rectangles represent exons, while the thick line refers to introns. Blue rectangles indicate deleted exons due to T-DNA loss in hst-15. The empty triangle marks the position where the T-DNA was annotated for the hst-15 allele, and the hst-6 allele is marked with an arrow. Red triangles connected by dashed lines represent the non-amplified fragments in hst-15; black triangles connected by a dotted line represent the obtained amplification product in this allele. (B) and (C) Coverage of genomic DNA sequencing (B) and mRNA sequencing (C) reads over the HST locus in wild-type and hst-15 mutant plants. (D) Schematic representation of the different versions of HST used for phenotype complementation: HST: full version; HSTΔC: version without the C-terminal domain; HST15: truncated version resulting from T-DNA removal in the hst-15 mutant; HSTN-term: version only including the N-terminal region of the protein. Length of each construct is noted in brackets. (E) Phenotype of 20-day-old hst-15 and hst-6 mutants complemented with different versions of HST. Scale bar = 1 cm. (F) RNA blots for detection of mature miR171 and miR319 in the complemented hst plants. U6 was used as a loading control. Signal intensity was calculated with ImageJ and normalized to U6. Ratios of signal intensities of mutants to control are noted above each gel. (G) TriFC assays showing the interaction between DCL1-MED37D and DCL1-MED37E in N. benthamiana leaves in the presence or absence of HST and HST15 versions, respectively. Scale bar = 10 μm. Fluorescence intensity was quantified with ImageJ and expressed relative to background. Error bars represent SEM, and P-values below 0.05 (*) or 0.01 (**), in an unpaired t-test, were considered significant. (H) Interaction between HST-HWS and HST-HWSΔFBox measured by BiFC. DCL1 was a positive control for HST interaction, and CARP9 was a negative control. Scale bar = 10 μm. (I) Western blot detecting HST:GFP levels in transgenic wild-type and hws-3 mutant plants. ACTIN was quantified as a loading control. (J) HST-GFP levels, as measured by fluorescent intensity in nuclei of plants expressing HST under its native promoter and co-expressing HWS, HWSΔFBox, or CARP9, as a negative control, under a 35S promoter.
Figure 3.
Figure 3.
Impaired non-cell-autonomous miRNA movement in hst mutants is restored by HWS mutation. (A) Basic fuchsin staining of 5-day-old roots showing the protoxylem and metaxylem. hst-15, hst-6, and HWS overexpression lines show root defects, while the double hst/hws mutant restores normal root morphology. Scale bar = 10 μm. (B) Ratio of miR160 levels between epidermis and vasculature as measured by RT-qPCR. hst mutants show defective miRNA movement from vasculature to epidermis, while the double hst/hws mutant restores movement to wild-type levels. Error bars represent SEM. (C) amiRSUL‐silencing chlorosis phenotype in pSUC2::amiRSUL transgenic Arabidopsis plants in different mutant backgrounds. Scale bar = 0.5 cm. (D) RT-qPCR of SUL mRNA, showing higher expression in hst-15, where movement is not impaired, compared to other genotypes. Error bars represent SEM. (E) AGO1-associated mature miRNAs as measured by RT-qPCR in AGO1-RIP experiments. Data are presented as the mean values ± s.d. P values were calculated with a two-tailed unpaired t-test with Welch’s correction. (F) Mature miRNA expression changes, quantified by sRNA-Seq, in the different mutant lines with respect to Col-0. Each dot represents a single miRNA, while boxplots depict the general tendency in the mutant. (G)- Scatter plot of mature miRNAs expression changes of hst-15 against hst-15/hws-35 plants, with respect to Col-0, from sRNA-Seq experiments. Known miRNAs acting non-cell autonomously are highlighted in red. Pearson correlation coefficient is presented in the upper left corner (*** indicates statistical significance with a P-value below 0.001).
Figure 4.
Figure 4.
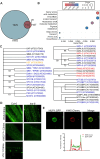
HWS interacts with the NPC. (A) Venn diagram showing proteins interacting with both HWS and HST as detected by mass spectrometry. (B) Gene ontology analysis showing enrichment of proteins based on the GO term Biological Processes, after filtering for log2 FC > 10. Protein counts are represented by circle size, and P-values are shown in a color gradient. (C) Phylogenetics of Alpha Exportins, Beta Importins, RAN GTPases, and WIP proteins. Proteins interacting with HWS (blue) or both HWS and HST (red) as detected by mass spectrometry are marked. HWS-HST interaction (orange) was detected by alternative approaches. (D) Localization of HWS:Citrine and HWSΔFBox:Citrine in wild-type and hst-6 roots. HYL1:GFP was used as a nuclear localization control. (E) Co-localization of pNUP1:NUP1:GFP with 35S:HWS:Cherry in N. benthamiana. Co-localization was quantified by ImageJ as the overlap between the red and green signals in a transection of the cells and plotted as a histogram.
Figure 5.
Figure 5.
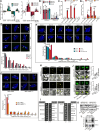
HST and HWS antagonistically regulate MIRNA transcription at the NPC. (A) Quantification of unprocessed pri-miRNAs associated with chromatin in different genotypes measured by RIP-qPCR. (B) ChIP-qPCR analysis of MIRNA loci associated with HWS in hws-3 and hst-15 mutants expressing HWS-Citrine, showing interaction of HWS with MIRNA loci and its dependence on HST. Results are expressed relative to hws-3/35S::HWS-Citrine plants. (C) and (D) ChIP-qPCR (C) and RIP-qPCR (D) assays in N. benthamiana transformed with pNUP1::NUP1-GFP, detecting MIRNA loci and pri-miRNAs interaction with the NPC. Non-transformed leaves were used as a negative control. Non detected signal is noted as n.d. (A–D) qPCR values are from n = 3 biologically independent samples, presented as mean ± SEM. P-values were calculated in a two-tailed, unpaired, t-test. (E), (F), and (G) Visualization of the MIR156A locus in the nucleus of wild-type, mutant plants (E and F), and plants overexpressing HWS or HWSΔFBox (G) using fluorescence in situ hybridization (FISH). The blue signal resulting from DAPI staining was used to delimitate the nucleus envelope, which is marked with discontinues lines. MIRNA locus is observed in green, and its distribution quantified as the average percentage of cells with the MIR156A signal at an indicated distance, measured with ImageJ, from the nuclear peripheral zone. Scale bars, 2 μm. The plots represent 45 cells (three independent experiments of 15 cells each). (H) BiFC assay of HWS and HWSΔFBox with MED37D and MED37E. HST was used as a positive interaction control, and CARP9 as a negative control. Scale bar = 20 μm. (I) Yeast two-hybrid assay of HWS and HWSΔFBox with different MEDIATOR subunits and HST. SE - HYL1 interaction was the positive control, and empty GAL4-AD and GAL4-BD constructs served as negative controls. (J) Quantification of 35S::MED37D-GFP and 35S::MED37E-GFP fluorescence intensity in the presence of 35S::HWS or 35S::HWSΔFBox to assess their degradation. HYL1-GFP was used as a negative control. Representative images are paired with dot plot graphs showing quantifications. K and L- Quantification of MED37D-GFP and MED37E-GFP protein levels in plants stably transformed with 35S::HWS or 35S::HWSΔFBox either in the total protein fraction (K) or in a protein fraction obtained after HYL1 / DCL1immunoprecipitation (L). ACTIN and HYL1 were used for normalization, respectively.
Figure 6.
Figure 6.
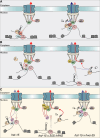
An hypothetical model for NPC-associated miRNA biogenesis and export. (A) Given its exportin nature and its capacity to interact with the MEDIATOR and miRNA processing complexes, HST drags MIRNA loci to the NPC. RNA Pol II transcription and DCL1-mediated co-transcriptional processing of pri-miRNAs at this location likely facilitate miRNA export from the nucleus in an AGO1-independent manner (blue arrows), promoting non-cell-autonomous functions of mobile miRNAs. Cell-autonomous miRNA shuttling is indicated with red arrows, while blue arrows denote pathways prone to non-cell-autonomous movement. (B) HWS interacts with the NPC to antagonize the HST-mediated recruitment of MIRNA. By inducing the degradation of MED37, and possibly HST, HWS causes the detachment of MIRNA loci from the NPC, leading to nucleoplasmic post-transcriptional pri-miRNA processing, which, due to its nuclear association with AGO1, restricted miRNAs to cell-autonomous functions. (C) In the absence of HST non-cell-autonomous miRNA movement is severely impaired causing the observed mutant phenotype. It is likely that a partially redundant exportin, though inefficient in the miRNA pathway, may still act at NPCs not associated with HWS. This is supported by the fact that the hst phenotype is even more pronounced when HWS is overexpressed, likely preventing inefficient exportins from partially compensating for HST. Conversely, in the absence of both hst and hws, this weak redundancy appeared to be sufficient to partially rescue hst phenotype, restoring miRNA cell-to-cell movement. Gray background upper boxes (A and B) represent the hypothetical interaction between miRNA components and the NPC in wild-type cell at HWS-free (A) or HWS-occupied (B) NPCs. Yellow background lower box (C) represents hypothetical crosstalk between the miRNA pathway and the NPC in different mutants.

References

    1. Telfer A, Poethig RS HASTY: a gene that regulates the timing of shoot maturation in Arabidopsis thaliana. Silence. 1998; 125:72–87. 10.1242/dev.125.10.1889. - DOI - PubMed
    1. Bollman KM, Aukerman MJ, Park MY et al. HASTY, the Arabidopsis ortholog of exportin 5/MSN5, regulates phase change and morphogenesis. Development. 2003; 130:1493–504. 10.1242/dev.00362. - DOI - PubMed
    1. Bohnsack MT, Czaplinski K, Gorlich D Exportin 5 is a RanGTP-dependent dsRNA-binding protein that mediates nuclear export of pre-miRNAs. RNA. 2004; 10:185–91. 10.1261/rna.5167604. - DOI - PMC - PubMed
    1. Jacob Y, Mongkolsiriwatana C, Veley KM et al. The nuclear pore protein AtTPR is required for RNA homeostasis, flowering time, and auxin signaling. Plant Physiol. 2007; 144:1383–90. 10.1104/pp.107.100735. - DOI - PMC - PubMed
    1. Lund E, Guttinger S, Calado A et al. Nuclear export of microRNA precursors. Science. 2004; 303:95–8. 10.1126/science.1090599. - DOI - PubMed

MeSH terms

LinkOut - more resources