. 2025 Sep 18;14(1):331.
doi: 10.1038/s41377-025-01984-x.

Miniaturized chaos-assisted Spectrometer

Affiliations

Miniaturized chaos-assisted Spectrometer

Yujia Zhang et al. Light Sci Appl. .

Abstract

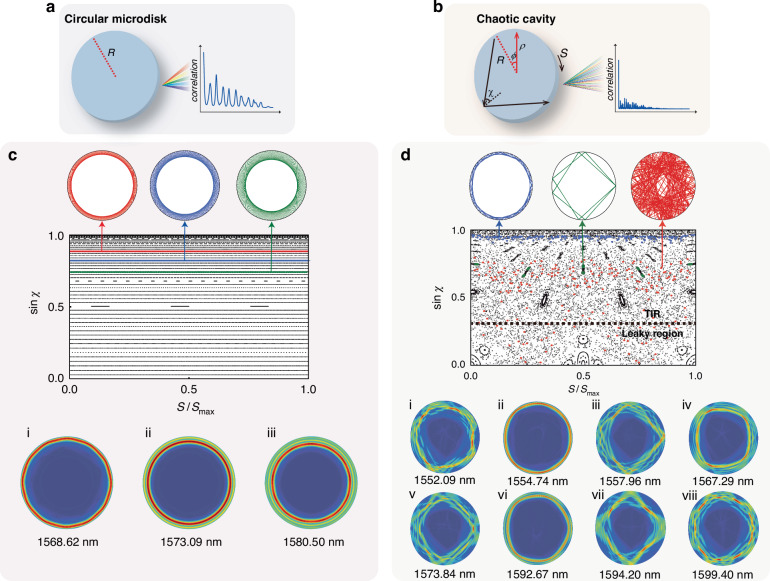
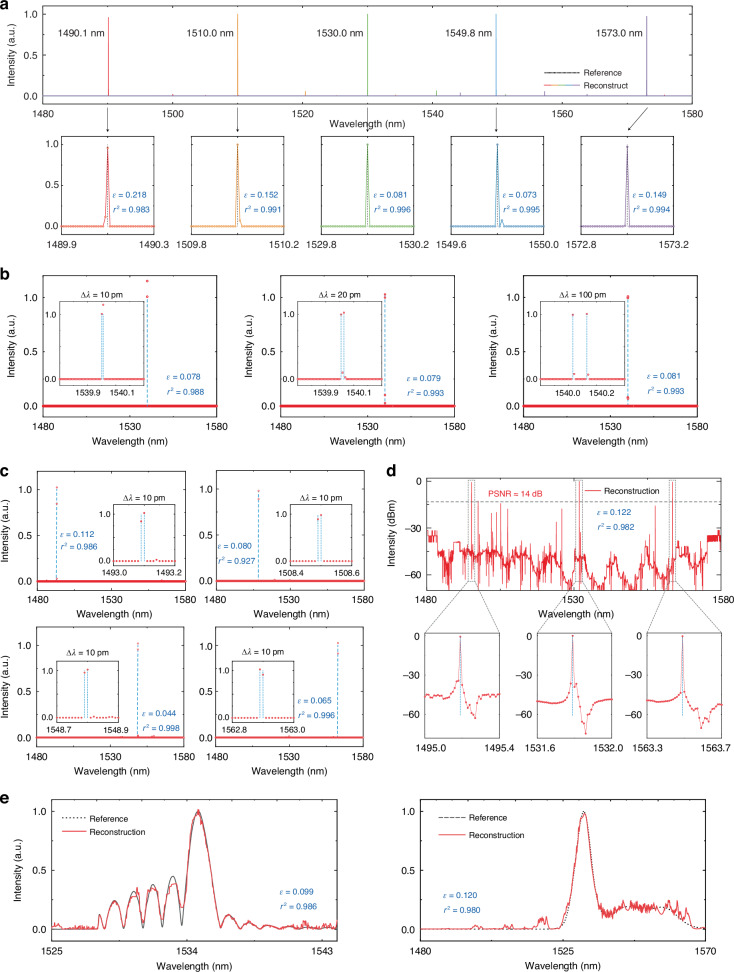
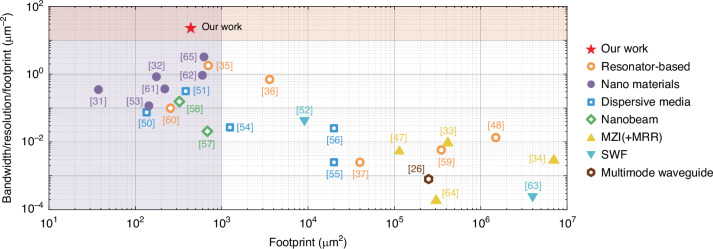
Computational spectrometers are at the forefront of spectroscopy, promising portable, on-chip, or in-situ spectrum analysis through the integration of advanced computational techniques into optical systems. However, existing computational spectrometer systems have yet to fully exploit optical properties due to imperfect spectral responses, resulting in increased system complexity and compromised performance in resolution, bandwidth, and footprint. In this study, we introduce optical chaos into spectrum manipulation via cavity deformation, leveraging high spatial and spectral complexities to address this challenge. By utilizing a single chaotic cavity, we achieve high diversity in spectra, facilitating channel decorrelation of 10 pm and ensuring optimal reconstruction over 100 nm within an ultra-compact footprint of 20 × 22 μm2 as well as an ultra-low power consumption of 16.5 mW. Our approach not only enables state-of-the-art on-chip spectrometer performance in resolution-bandwidth-footprint metric, but also has the potential to revolutionize the entire computational spectrometer ecosystem.


Conflict of interest statement

Conflict of interest: The authors declare no competing interests.

Figures

Fig. 1
Fig. 1. Chaotic cavity and circular microdisk cavity.
a Schematic of circular microdisk and its strong periodicity visualized by correlation function, b Schematic of chaotic cavity and its weak periodicity visualized by correlation function. The calculated PSOS, the corresponding ray trajectory in real space marked with different colors in PSOS, and supporting resonant modes of c, the circular microdisk cavity and d, the chaotic cavity, respectively
Fig. 2
Fig. 2. Chaos-assisted spectrometer design.
a Boundary shape of different deformation parameters α and corresponding calculated PSOSs. b Periodicity and insertion loss as functions of α calculated from the measured spectral response of the fabricated devices. c Estimation of the reconstruction resolution, CΔλ, around Δλ=0 for chaotic cavity devices (α=0.375) with different gaps between bus waveguides and chaotic cavity. d Husimi maps of certain periodic/quasi-periodic resonant mode patterns corresponding to PSOS
Fig. 3
Fig. 3. Calibration and characterization.
a Schematic of the chaos-assisted spectrometer and the spectral reconstruction process. The zoom-in figure shows SEM photo of the functional region of the fabricated chaos-assisted spectrometer, while the scale bar indicates a length of 10 μm. The yellow dashed line indicates circular shape. b Upper: optical microscopy photo of the fabricated device after Ti heaters and Au interconnection layer deposition. Bottom: Image of the photonic chip wire bonded to a customized PCB board with a fixed fiber-array. c Normalized response matrix obtained by sweeping the heating power linearly from 0 to about 16.5 mW from 1480 nm to 1580 nm with 300 heating channels. d Normalized transmission spectra at 1st and 300th heating channels. Black numbers mark resonance peaks detailed in Supplementary Information Table. S1. e Auto-correlation function where the periodicity level is shown by the black dashed line. f Cross-correlation function. The red line is the average cross-correlation function. Inserted graphs are the cross-correlation functions of three randomly selected transmission groups, designated as green, blue, and yellow. g Spectral correlation function of CΔλ around Δλ=0 where the estimated resolution is illustrated by the black dashed line
Fig. 4
Fig. 4. Reconstruction results.
a Narrow, monochromatic laser peak signals that each across the entire operational range from 1480 nm to 1580 nm; b Double-peak laser signal with different wavelength intervals of 10 pm (left), 20 pm (middle), and 100 pm (right), validating resolution of 10 pm, with each signal spanning the entire operational bandwidth. c 10 pm interval double-peak laser signals at (top left) 1493.1 nm, (top right) 1508.5 nm, (bottom left) 1548.8 nm and (bottom right) 1562.9 nm, with each signal spanning the entire operational bandwidth. d A multi-peak signal with peaks situated at the central and marginal regions of the entire operational wavelength range. e Continuous signal with Sinc function waveform (left), and broad EDFA signal (right)
Fig. 5
Fig. 5. Performance comparison.
Comparative evaluation of the performance between our work and other prominent computational spectrometers, where MZI, MRR and SWF are abbreviations for Mach-Zehnder interferometer, microring-resonator and stratified waveguide filters, respectively,,–,,,–

References

    1. Laskar, J. The chaotic motion of the solar system: a numerical estimate of the size of the chaotic zones. Icarus88, 266–291 (1990).
    1. Petrov, V. et al. Controlling chaos in the Belousov—Zhabotinsky reaction. Nature361, 240–243 (1993).
    1. Poon, C. S. & Merrill, C. K. Decrease of cardiac chaos in congestive heart failure. Nature389, 492–495 (1997). - PubMed
    1. Soriano, M. C. et al. Complex photonics: dynamics and applications of delay-coupled semiconductors lasers. Rev. Mod. Phys.85, 421–470 (2013).
    1. Arnal, M. et al. Chaos-assisted tunneling resonances in a synthetic Floquet superlattice. Sci. Adv.6, eabc4886 (2020). - PMC - PubMed

LinkOut - more resources