. 2025 Sep 18;16(1):8319.
doi: 10.1038/s41467-025-63911-3.

Stabilizing a mammalian RNA thermometer confers neuroprotection in subarachnoid hemorrhage

Affiliations

Stabilizing a mammalian RNA thermometer confers neuroprotection in subarachnoid hemorrhage

Min Zhang et al. Nat Commun. .

Abstract

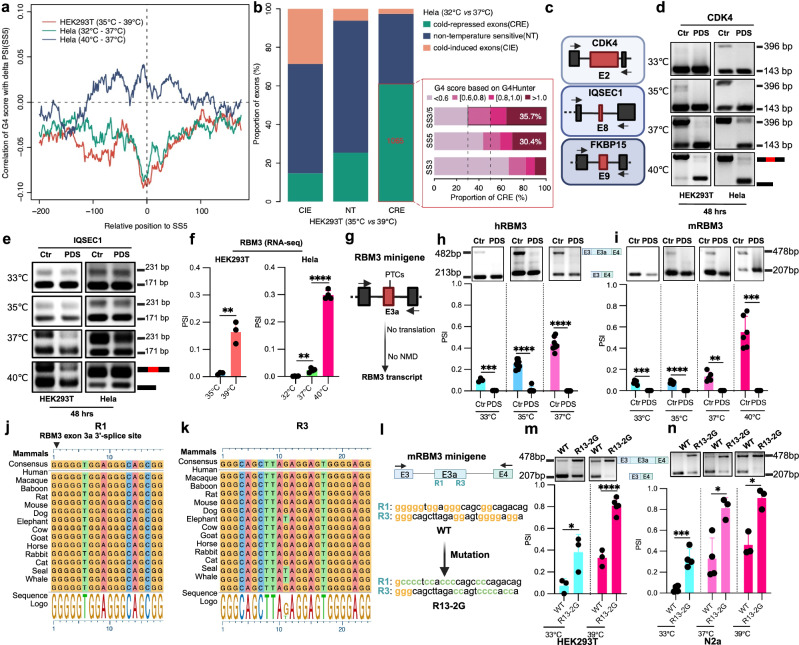
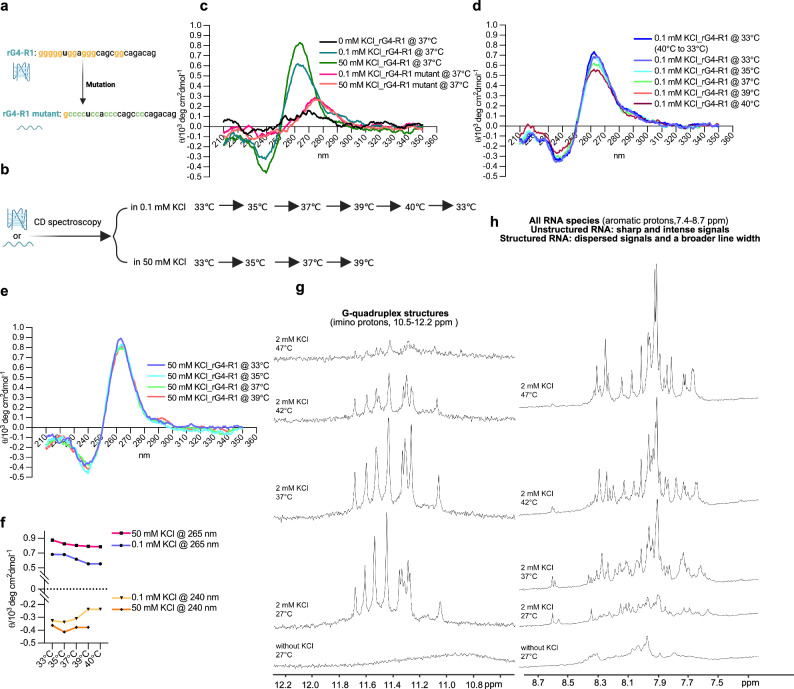
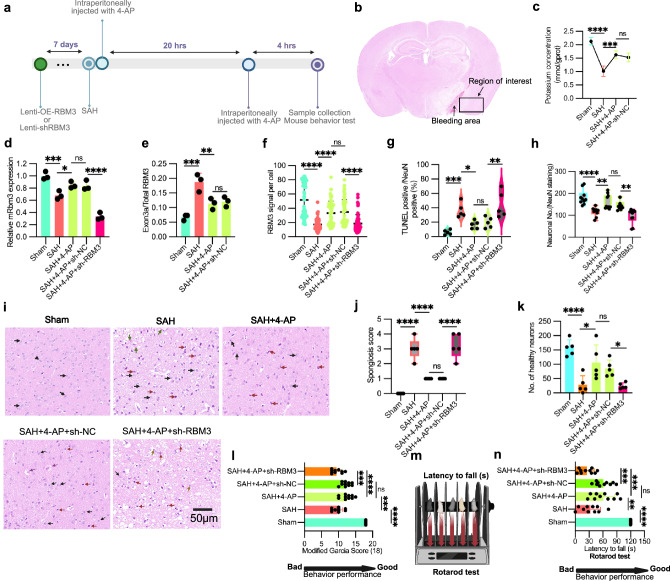
Mammals tightly regulate their core body temperature, yet how cells sense and respond to small temperature changes remains incompletely understood. Here, we discover RNA G-quadruplexes (rG4s) as key thermosensors enriched near splice sites of cold-repressed exons. These thermosensing RNA structures, when stabilized, mask splice sites, reducing exon inclusion. Specifically, rG4s near splice sites of a cold-repressed poison exon in the neuroprotective RBM3 are stabilized at low temperatures, leading to exon exclusion. This enables evasion of nonsense-mediated decay, increasing RBM3 expression at cold. Importantly, stabilizing rG4 through increasing intracellular potassium with an FDA-approved potassium channel blocker, mimics the hypothermic effect on alternative splicing, thereby increasing RBM3 expression, leading to RBM3-dependent neuroprotection in a mouse model of subarachnoid hemorrhage. Our findings unveil a mechanism how mammalian RNAs directly sense temperature and potassium perturbations, integrating them into gene expression programs. This opens new avenues for treating diseases arising from splicing defects and disorders benefiting from therapeutic hypothermia, especially hemorrhagic stroke.


Conflict of interest statement

Competing interests: A patent application (China patent No. 2024105567784) has been filed in relation to this research. There are no other competing interests.

Figures

Fig. 1
Fig. 1. G4 motifs are enriched around splice sites of cold-repressed exons (CREs).
a Schematic representation of a parallel G4 structure. It was generated with BioRender. b Schematic depicting the analyzed sequence in four regions around splice sites (SS) of each cassette exon (CE). USS5: upstream exon 5′ splice site, SS3: 3′ splice site, SS5: 5′ splice site, DSS3: downstream exon 3′ splice site. G-content and G4 motifs were quantified in 50 bp (−25 to +25) sequences flanking the respective splice sites. c The number of cold-repressed exons (CREs), cold-induced exons (CIEs), and non-temperature-sensitive exons (NTs) in HEK293T cells at 35 °C vs. 39 °C. CREs were defined as exons with ΔPSI ≤ −0.1 (35 °C–39 °C). CIEs were defined as ΔPSI ≥ 0.1 (35 °C–39 °C). Significance was assessed by a two-sided likelihood-ratio test with Benjamini–Hochberg-adjusted p-value < 0.05 between 35 °C and 39 °C. d The number of CIEs, CREs, and NTs in Hela cells in two comparisons (32 °C vs. 37 °C, 37 °C vs. 40 °C). The final NTs for further analysis were selected as the intersection of NT in these two comparisons (blue). e G-content in sequences within four regions (see b) of CREs, CIEs, and NTs in Hela cells (32 °C vs. 37 °C). The sample number of CIE (n = 841), NT (n = 2588), and CRE (n = 2093) were indicated in the figure. The box displays the interquartile range (IQR) with the median line. Whiskers extend to the most extreme data points within 1.5 × IQR of the box. Significance was estimated by two-sided Wilcoxon test (SS3: CRE vs. NT: p < 1.08e-13, CRE vs. CIE: p < 2.43e-18; SS5: CRE vs. NT: p < 3.35e-28, CRE vs. CIE: p < 1.99e-37). f Proportion of exons with G4 motifs within four regions (see b) of CREs, CIEs, and NTs in Hela cells (32 °C vs. 37 °C). Significance was estimated by hypergeometric test (SS5: CRE vs. NT: p < 2.08e-5; CRE vs. CIE: p < 7.87e-8). g The average G4 scores predicted by G4Hunter around splice sites in CREs, CIEs, and NTs. 200 bp sequences flanking splice sites with a 25 bp window were searched starting at each base. h, i Cumulative Reverse Transcriptase Stalling (RTS) values based on rG4-seq at the 3′ splice site (SS3, h) or the 5′ splice site (SS5, i) of alternative exons in CREs, CIEs, and NTs.
Fig. 2
Fig. 2. G4 stabilizers suppress the inclusion of cold-repressed exons.
a Correlation of 5′-splice site G4 scores with delta PSI values after cold shock (HEK293T (35 °C–39 °C) and Hela (32 °C–37 °C)) or heat shock (Hela (40 °C–37 °C)). For each base surrounding the splice site, the G4 score is calculated using a 25 bp sliding window and then correlated with PSI. b Intersection of CIEs, NTs, and CREs comparing HEK293T and Hela cells (left panel), and proportions of the shared CREs containing sequences with different G4 scores (right panel). SS3/5 shows the maximum G4 scores for either the SS3 or the SS5 for each exon. CIE cold-induced exon, NT non-temperature sensitive exon, CRE cold-repressed exon. c Schematic depicting the position of CREs (red) in CDK4, IQSEC1, and FKBP15. Arrows indicate RT-PCR primers. It was generated with BioRender. d, e CRE inclusion level of CDK4 (d) and IQSEC1 (e) treated with DMSO or PDS at different temperatures in Hela (right) and HEK293T (left) cells. A representative gel image is shown. PCR products and sizes are indicated on the right. See Supplementary Fig. 2b, c (CDK4) and Supplementary Fig. 2e, f (IQSEC1) for quantifications. f PSI of RBM3 exon 3a in HEK293T and Hela RNA-Seq datasets from different temperatures. (see Fig. 1 and bioinformatics “Method”). Data represent n = 3 (HEK293T) and n = 4 (HeLa) independent biological replicates, with each data point corresponding to an individual replicate sequencing dataset. Statistical significance was determined using an unpaired two-tailed t-test. HEK293T: p = 0.0028 (35 °C vs. 39 °C); Hela: p = 0.0011 (32 °C vs. 37 °C), p < 0.0001 (37 °C vs. 40 °C). g Schematic of the RBM3 minigene designed to prevent translation to allow analysis of exon inclusion independent of NMD. PTCs: premature termination codons. This was generated with BioRender. h, i Exon 3a inclusion in the hRBM3 (h) and mRBM3 minigene (i) after G4 stabilizer PDS or control treatment in HEK293T cells. Upper gels depict representative minigene-specific RT-PCR results, and the lower part shows quantified results ((h) hRBM3: n = 3 for 33 °C, n = 9 for 35 °C (Ctr), n = 7 for 37 °C (Ctr) and n = 6 for PDS (35 °C and 37 °C) ; (i) mRBM3: n = 6 for 35 °C and 40 °C, n = 5 for 33 °C and 37 °C). h (hRBM3): p = 0.0007 (33 °C), p < 0.0001 (35 °C), p < 0.0001 (37 °C); i (mRBM3): p = 0.0005 (33 °C), p < 0.0001 (35 °C), p = 0.0014 (37 °C), p = 0.0004 (40 °C). j, k Sequence alignment of R1 and R3 across multiple mammals illustrated by a derived consensus sequence, the aligned sequences, and a sequence logo representation (see bioinformatics method). l Schematic illustrating the position of the G-rich elements R1 and R3 in the mRBM3 minigene and the sequence of the R13-2G mutant. It was generated with BioRender. m, n Splicing level of RBM3 exon 3a in WT and R13-2G mutant at different temperatures in both HEK293T (m) and N2a cells (n). Upper gels depict representative RT-PCR results, and the lower portion shows quantified results. In HEK293T (m), n = 5 (R13-2G at 39 °C) and n = 3 (others); in N2a cells (n), n = 4 (33 °C and WT at 37 °C) and n = 3 (others). m (HEK293T): p = 0.0362 (33 °C), p < 0.0001 (39 °C); n (N2a): p = 0.0008 (33 °C), p = 0.0121 (37 °C), p = 0.0063 (39 °C). In this figure, individual data points are shown with mean +/− SD. Statistical analysis was performed using unpaired two-tailed t-test. * denotes p ≤ 0.05, ** denotes p ≤ 0.01, ***p ≤ 0.001 and **** denotes p ≤ 0.0001. Source data are provided as a Source Data file.
Fig. 3
Fig. 3. Biophysical assays demonstrate temperature and potassium dependent G-quadruplex formation of RBM3 R1 in vitro.
a Sequences of synthesized WT and mutant rG4-R1 RNAs. R1 corresponds to the sequence near the 3′ splice site of RBM3 eoxn 3a (Fig. 2j). b A schematic of biophysical CD spectroscopy assays. The RNA samples were heated to 95 °C for 5 min and then cooled to room temperature overnight for renaturation. Subsequently, the samples were scanned from 220 to 310 nm at different temperatures. After setting the CD spectrometer to the desired measurement temperature, RNA samples were incubated at that temperature for 30 min to ensure thermal equilibrium and structural stabilization. CD spectra were then recorded using a response time of 0.5 s per nm. Each spectrum represents the average of three consecutive scans collected under these conditions. It was generated with BioRender. c Circular dichroism (CD) spectrum signal of rG4-R1 and its mutant in different potassium concentrations at 37 °C. X-axis: the wavelength of light; y-axis: the magnitude of the CD signal. Signal peak at 265 nm and 240 nm: parallel rG4 structure. d, e Normalized CD signal of rG4-R1 at different temperatures in low KCl concentration (d) and high KCl condition (e). [θ] = θobs × 100/(c × l), where [θ] = molar ellipticity in deg·cm²·dmol⁻¹; θobs = observed ellipticity in millidegrees (mdeg); c = molar concentration of the sample in mol/L; l = path length in cm; Multiply by 100 to convert mdeg to deg and account for units. f Summary of CD signal peaks at 265 nm (top) and 240 nm (bottom) of rG4-R1 at various temperatures under both high and low concentrations of KCl. g, h 1D 1H NMR spectrum showing the imino region (g, peaks indicating structured rG4s) and aromatic protons (h, as a measure for unstructured RNA, see text for details), confirming that the rG4-R1 sequence forms a temperature-sensitive rG4 in vitro. Source data are provided as a Source Data file.
Fig. 4
Fig. 4. G4-specific immunostaining and SHAPE-MaP show temperature and potassium dependent G-quadruplex formation in live cells.
a Representative G4-specific immunostaining images of HEK293 cells at different treatments. Cells were treated at different temperatures, followed by immunostaining with G4-specific antibody (Anti-DNA/RNA G-quadruplex [BG4], Absolute Antibody, Ab00174-30.126) and confocal imaging. DNAse is to digest DNA. Benzonase is to digest both RNA and DNA. b Quantification of (a), with Fiji (ImageJ2 V2.16.0/1.54g) software. Quantifications were based on three biological replicate images, with signal intensity measured from n = 18 cells for the PBS control and n = 17 cells for the treatment conditions per image. Each dot represents the mean G4 signal intensity overlapping with the Hoechst-stained nuclear region in a single cell. Each dot represents the average intensity of G4 signal overlapped with Hoechst signal position in a single cell. The scatter dot plots represent mean ± SD. p < 0.0001 (37 °C vs. PBS), p < 0.0001 (PBS vs. DNAse), p < 0.0001 (PBS vs. Benzonase). c Schematic of SHAPE-MaP probing method. HEK293 cells were treated with G4 stabilizers (PDS or Phen-DC3) or DMSO for 24 h or incubated at different temperatures for 48 h, and then cells were then treated with 50 mM NAI. To get the enriched pre-mRNA, Chromatin-associated RNA was extracted, reverse-transcribed in an Mn²⁺-containing buffer, followed by cDNA amplification, gel-purification, and analysis via Sanger sequencing. It was generated with BioRender. d Schematic of the region of interest in SHAPE-MaP using RBM3 R1 and R3 as examples. Chromatin-associated RNA was extracted and reverse-transcribed into cDNA in an Mn²⁺-containing buffer using Superscript II with a gene-specific primer binding ~50 bp downstream of the putative rG4. The cDNA was amplified with a high-fidelity polymerase and primers targeting ~50 bp upstream and downstream of the putative rG4. It was generated with BioRender. e, f Quantified indel percentage of Sanger sequencing data from (Supplementary Fig. 7). In the e (RBM3-R1): data were obtained from n = 5 biological replicates for the 33 °C and 37 °C control treatments, n = 3 for PDS treatment, and n = 4 for Phen-DC3 treatment; f (RBM3-R3): n = 3 for the 33 °C and 37 °C control treatment, n = 6 for PDS, and n = 4 for Phen-DC3. The indel percentages were quantified using TIDE software within the 50 bp upstream and downstream regions of the putative rG4. In the e (RBM3-R1): p = 0.0057 (37 °C vs. 33 °C), p = 0.0021 (37 °C vs. PDS), p = 0.0031 (37 °C vs. Phen-DC3); f (RBM3-R3): p = 0.0214 (37 °C vs. 33 °C), p = 0.0005 (37 °C vs. PDS), p = 0.0005 (37 °C vs. Phen-DC3). In this figure, the scatter dot plots represent mean ± SD. Statistical analysis was performed using two-tailed unpaired t-test. * denotes p ≤ 0.05, ** denotes p ≤ 0.01, ***p ≤ 0.001 and **** denotes p ≤ 0.0001. Source data are provided as a Source Data file.
Fig. 5
Fig. 5. RBM3 rG4 elements control RBM3 levels in response to G4 stabilizers.
ad Splicing level of RBM3 exon 3a in the WT and R13-2G double mutant mRBM3 minigene after 50 mM KCl and control treatment at 33 °C and 40 °C in both HEK293T (a and b) and N2a (c and d) cells. Data were obtained from n = 3 biological replicates for the 33 °C and n = 4 for 40 °C treatments. Gels in (a and c) depict representative minigene-specific RT-PCR results, and the lower part (b and d) shows quantified results of (a and c). b (HEK293T): p = 0.0025 (WT Ctr vs. KCl at 40 °C), d (N2a): p = 0.0004 (WT ctr vs. KCl at 40 °C). e, f Splicing level of RBM3 exon 3a after KCl treatment as in (ad) in HT22 cells at 37 °C. Data were obtained from n = 7 biological replicates for the WT and n = 3 for R13-2G treatments. Gels in (e) depict representative minigene-specific RT-PCR results, and the lower part (f) shows quantified results of (e). f (HT22): p = 0.0001 (WT ctr vs. KCl at 40 °C). g, h Splicing level of RBM3 exon 3a after voltage-gated potassium channel blocker (4-AP and AFP) treatment in glutamate-stimulated HT22 cells at 37 °C. Data represent n = 9 for WT control, n = 3 for WT + 4-AP, n = 6 for WT + AFP, n = 7 for R13-2G control, n = 3 for R13-2G + 4-AP and n = 4 for R13-2G + AFP treatment. 4-AP: 4-Aminopyridine. AFP: amifampridine. 10 µM of 4-AP and AFP were used. Glutamate is used to polarize and excite HT22 cells. h (HT22): p = 0.0194 (WT Ctr vs. 4-AP), p = 0.0006 (WT Ctr vs. AFP). il RBM3 expression after 50 mM KCl and control treatment at 33, 35, 37, 39 °C (for RNA level) or 40 °C (for protein level), observed for both mRNA and protein levels in HEK293T (i and j) and N2a (k and l) cells. i and k are derived from qPCR (in (i): n = 4 for 33 °C, n = 3 for 35 °C, n = 9 for 37 °C control, n = 8 for 37 °C + KCl, n = 4 for 39 °C control, and n = 3 for 39 °C + KCl treatment; in (k): n = 3 for 33 °C, n = 4 for others). j and l are WB results (n = 6 biological replicates)). qPCR was normalized with hHPRT. Below the gels, quantifications using HNRNPL as loading control are shown (see “Method”). i (HEK293T): p = 0.0224 (Ctr vs. KCl at 37 °C), p = 0.0009 (Ctr vs. KCl at 39 °C); j (HEK293T): p = 0.0003 (Ctr vs. KCl at 40 °C); k (N2a): p = 0.0005 (Ctr vs. KCl at 37 °C), p = 0.0001(Ctr vs. KCl at 39 °C); l (N2a): p < 0.0001 (Ctr vs. KCl at 37 °C), p = 0.0002 (Ctr vs. KCl at 40 °C). In this figure, individual data points and mean ± SD are shown. Statistical analysis was performed using two-tailed unpaired t-test. ns denotes no significance, * denotes, p ≤ 0.05, **p ≤ 0.01 and *** denotes p ≤ 0.001. Source data are provided as a Source Data file.
Fig. 6
Fig. 6. 4-AP confers RBM3-mediated protection against neuronal damage in a hemin-induced hemorrhage HT22 cell model.
a Intracellular potassium levels after 4-AP and control treatment in hemin-exposed HT22 cells (see “Method”). Data represent n = 4 independent biological replicates (HT22 cells). The plot shows points connected by a line with error bars (mean ± SD). p < 0.0001 (Vehicle vs. Hemin), p = 0.0065 (Hemin vs. Hemin+4-AP (5 μM)), p = 0.0002 (Hemin vs. Hemin+4-AP (10 μM)), p < 0.0001 (Hemin vs. Hemin+4-AP (20 μM)). b Schematic of qPCR primers for RBM3 exon 3a. Primer pair 1 targets the upstream exon–exon 3a junction. Primer pair 2 targets the exon 3a–downstream exon junction. It was generated with BioRender. c, d Levels of RBM3 exon 3a in HT22 cells treated as in (a). Two pairs of qPCR primer (RBM3 exon3a qPCR primer-1 (c) and RBM3 exon3a qPCR primer-2 (d)) were used to quantify exon 3a inclusion, respectively. Data represent n = 3 independent biological replicates (HT22 cells). c p = 0.0167 (Vehicle vs. Hemin), p = 0.0155 (Hemin vs. Hemin+4-AP (5 μM)), p = 0.0046 (Hemin vs. Hemin+4-AP (10 μM)), p = 0.0016 (Hemin vs. Hemin+4-AP (20 μM)); d p = 0.0078 (Vehicle vs. Hemin), p = 0.0044 (Hemin vs. Hemin+4-AP (10 μM)), p = 0.0014 (Hemin vs. Hemin+4-AP (20 μM)). e qPCR analysis of RBM3 total mRNA expression after treatments as in (a). n = 3 independent biological replicates (HT22 cells). qPCR was normalized with mGAPDH. p < 0.0001 (Vehicle vs. Hemin), p = 0.0280 (Hemin vs. Hemin+4-AP (5 μM)), p = 0.0091 (Hemin vs. Hemin+4-AP (10 μM)), p = 0.0008 (Hemin vs. Hemin+4-AP (20 μM)). f Endogenous RBM3 protein expression in HT22 treatments as in (a), analyzed by Western blot. Below the gel, quantification (mean ± SD) using GAPDH as loading control is shown. Data represent n = 3 independent biological replicates (HT22 cells). p < 0.0001 in all the comparisons (Vehicle vs. Hemin, Hemin vs. Hemin+4-AP (5 μM), Hemin vs. Hemin+4-AP (10 μM), Hemin vs. Hemin+4-AP (20 μM)). g, h Cell death in HT22 cells treated as in (a). Representative images stained for dead/live cells are shown in (g), with quantification of % dead cells in (h) (see “Method”). Data represent n = 3 independent biological replicates (HT22 cells). Red fluorescence indicates dead cells stained with NucleiDye, while green fluorescence marks live cells stained with LiveDye. In (h), p < 0.0001 in all the comparisons (Hemin vs. Hemin+4-AP (5 μM), Hemin vs. Hemin+4-AP (10 μM), Hemin vs. Hemin+4-AP (20 μM)). i Cell viability was investigated in HT22 treated as in (a) by an CCK-8 assay and is plotted as % viable cells (see “Method”, n = 6 independent biological replicates (HT22 cells)). p < 0.0001 in all the comparisons. j Relative RBM3 mRNA expression post-siRNA transfection upon 4-AP treatment in hemin-exposed HT22 cells. Two independent si-RNAs against RBM3 (RBM3-1 and RBM3-2) were used (see “Method”). Data represent n = 3 independent biological replicates for Vehicle, n = 10 for Hemin and Hemin + 4-AP, and n = 6 for other treatments (HT22 cells). p = 0.0005 (Vehicle vs. Hemin), p = 0.0015 (Hemin vs. Hemin+4-AP), p < 0.0001 (Hemin+4-AP+si-NC vs. Hemin+4-AP+si-RBM3-1), p < 0.0001 (Hemin+4-AP+si-NC vs. Hemin+4-AP+si-RBM3-2). k Cell viability in treatments as in (j), quantified by CCK-8 assay. Data represent n = 6 independent biological replicates (HT22 cells). p < 0.0001 in all the comparisons. l, m Percentage of dead cells in treatments as in (j). Representative staining for dead/live cells is provided in (l), with quantification in (m) (see “Method”). Data represent n = 3 independent biological replicates (HT22 cells). p < 0.0001 (Vehicle vs. Hemin), p = 0.0048 (Hemin vs. Hemin+4-AP), p < 0.0001 (Hemin+4-AP+si-NC vs. Hemin+4-AP+si-RBM3-1), p = 0.0002 (Hemin+4-AP+si-NC vs. Hemin+4-AP+si-RBM3-2). In this figure, the scatter dot plots are shown as the mean ± SD. Statistical analysis was conducted using ordinary one-way ANOVA followed by Dunnett’s multiple comparisons test (j, k, and m Šídák’s multiple comparisons test) with a single pooled variance. ns denotes no significance, * denotes p ≤ 0.05, ** denotes p ≤ 0.01, *** denotes p ≤ 0.001 and **** denotes p ≤ 0.0001. Source data are provided as a Source Data file.
Fig. 7
Fig. 7. 4-AP mitigates neuronal damage in a mouse model of subarachnoid hemorrhage (SAH).
a Timeline of in vivo mouse experiments. Lentivirus (OE-RBM3 or shRNA against RBM3) were injected into the left cerebral cortex 7 days before SAH onset. 4-AP was injected intraperitoneally immediately after SAH. Due to its short half-life, 4-AP was injected again after 20 h SAH. All the mouse samples were collected after 24 h SAH. It was generated with BioRender. b Representative mouse cerebral cortex of SAH. The region marked by rectangular is the region of interest for the following investigation, which is nearby the bleeding region. c Intracellular potassium levels in cortical brains of the SAH and Sham mouse model in vivo after 4-AP at the dosage of 1 mg/kg, immediately and 20 h after SAH and control administration (see “Method”, n = 3 mice). p < 0.0001 (Sham vs. SAH), p = 0.0005 (SAH vs. SAH + 4-AP). d RBM3 mRNA expression in vivo as measured by qPCR across five groups: Sham, SAH, SAH + 4-AP, SAH + 4-AP + lenti-shRBM3, and SAH + 4-AP + lenti-shNC. Mice were treated with vehicle or 4-AP as indicated, and lentiviral vectors encoding shRBM3 or shNC were administered where applicable (see (a) and “Method”, n = 3 mice). p = 0.0006 (Sham vs. SAH), p = 0.0461 (SAH vs. SAH + 4-AP), p < 0.0001 (SAH + 4-AP+sh-NC vs. SAH + 4-AP+sh-RBM3). e Inclusion level of RBM3 exon 3a in the region of interest (b) of the SAH and sham mouse model in vivo after 4-AP and control administration. RBM3 Exon 3a expression was quantified with RBM3 exon 3a qPCR primer-1 normalized with mGAPDH (n = 3 mice). p = 0.0003 (Sham vs. SAH), p = 0.0066 (SAH + 4-AP vs. SAH + 4-AP+sh-NC). f RBM3 protein expression in the region of interest (b) of the mice treated as (d), shown as relative RBM3 signal per cell in RBM3 immunostainings (n = 5 mice; see Supplementary Fig. 10c). Each dot represents the RBM3 intensity in an individual cell (n = 13 cells per slide), with five mice analyzed per treatment group. p < 0.0001 in all comparisons. g Fraction of apoptotic cells in the region of interest (b) of the mice treated as in (d) shown by violin plot. The data was quantified from images as shown in the supplementary Fig. 10d (n = 5 mice). p = 0.0007 (Sham vs. SAH), p = 0.0275 (SAH vs. SAH + 4-AP), p = 0.0047 (SAH + 4-AP+sh-NC vs. SAH + 4-AP+sh-RBM3). h Neuronal count in the region of interest (b) of the mice treated as in (d). Data was quantified from NeuN signal-positive cells in Supplementary Fig. 10c, d (n = 10 mice). p < 0.0001 (Sham vs. SAH), p = 0.0051(SAH vs. SAH + 4-AP), p = 0.0013 (SAH + 4-AP+sh-NC vs. SAH + 4-AP+sh-RBM3). i Representative images of HE staining in the region of interest (b) of the mice treated as (d). Representative healthy neurons are highlighted by black arrows, damaged neurons by red arrows, red blood cells in the capillary by green arrows, healthy glia by arrowheads, damaged glia by yellow arrows, and macrophages by purple arrows (n = 5 mice). j Spongiosis score in the brain region highlighted in (b) of the mice treated as in (d), quantified from hematoxylin and eosin (HE) staining (i) (refer to “Methods”; n = 5 mice). p < 0.0001 in all comparison. k Healthy neuronal count in the region of interest (b) of the mice treated as in (d), quantified from hematoxylin and eosin (HE) staining (i) (n = 5 mice). Healthy neurons are identified by round or oval cell bodies with lightly eosinophilic cytoplasm, centrally located nuclei, and prominent nucleoli. Unhealthy neurons are identified by eosinophilic necrosis, exhibiting cell body shrinkage, intensely stained eosinophilic cytoplasm, and darkly stained pyknotic nuclei. l Modified Garcia score assessing neurological function in mice treated as described in (d) (see “Methods”). This composite score evaluates spontaneous activity, limb symmetry, forepaw outstretching, climbing, body proprioception, and response to vibrissae stimulation (n = 10 mice). p < 0.0001 (Sham vs. SAH, SAH + 4-AP vs. SAH + 4-AP+sh-RBM3), p = 0.0002 (SAH vs. SAH + 4-AP, SAH + 4-AP+sh-NC vs. SAH + 4-AP+sh-RBM3). m Schematic representation of the Rotarod Test (see “Method”). It was generated with BioRender. n Latency to fall of the mice treated as in (d) in the Rotarod Test (see “Method”, n = 10 mice). This test assesses motor coordination and balance by measuring the time each mouse remains on a rotating rod before falling. p < 0.0001 (Sham vs. SAH), p = 0.0073 (SAH vs. SAH + 4-AP), p = 0.0004 (SAH + 4-AP+sh-NC vs. SAH + 4-AP+sh-RBM3, SAH + 4-AP vs., SAH + 4-AP+sh-RBM3). The plot of (c) is points connecting line with error bars (mean ± SD). h, j are presented as box-and-whisker plots displaying all individual data points. The box represents the interquartile range (IQR) with the center line indicating the median, and the whiskers extend to the minimum and maximum values. g is presented as a violin plot showing all points of biological replicates. Others are the scatter dot plots shown as the mean ± SD. Statistical analysis was conducted using ordinary one-way ANOVA followed by Šídák’s multiple comparisons test with a single pooled variance. ns denotes no significance, * denotes p ≤ 0.05, ** denotes p ≤ 0.01, *** denotes p ≤ 0.001 and **** denotes p ≤ 0.0001. Source data are provided as a Source Data file.
Fig. 8
Fig. 8. Working model that rG4s function as RNA thermometers to modulate alternative splicing network.
Here is a refined model of RNA G-quadruplexes acting as evolutionarily conserved thermo- and potassium sensors, modulating alternative splicing in mammals. RNA G-quadruplexes (rG4s) function as reversible temperature sensors, impacting alternative splicing dynamics. In low temperatures or high potassium conditions, stabilized rG4s can mask surrounding splice sites, rendering these sites inaccessible, thereby promoting exon skipping. Conversely, at high temperatures or under low potassium conditions, rG4s become destabilized, allowing splice sites to be exposed, and facilitating efficient exon inclusion. RBM3, a well-known cold-induced protein with neuroprotective functions, harbors a poison exon with rG4s around splice sites, that, upon inclusion, triggers NMD (non-sense mediated decay) of the RBM3 mRNA. Under low temperatures or high potassium conditions, rG4s shield the splice sites, leading to poison exon skipping and increased RBM3 expression. Stabilization of these rG4s through increased K+ promotes poison exon skipping, enabling escape from NMD, and ultimately elevating RBM3 expression. Notably, 4-AP, a clinically used pan voltage-gated potassium channel blocker, protects against neuronal damage in a subarachnoid hemorrhage mouse model in an RBM-dependent manner. (ISS intronic splicing silencer, ESE exon splicing enhancer, ACA anterior cerebral artery, MCA middle cerebral artery, PPA pterygopalatine artery, ICA internal carotid artery, ECA external carotid artery, CCA common carotid artery). This figure was generated with BioRender.

References

    1. Buhr, E. D., Yoo, S. H. & Takahashi, J. S. Temperature as a universal resetting cue for mammalian circadian oscillators. Science330, 379–385 (2010). - PMC - PubMed
    1. Brown, D. J., Brugger, H., Boyd, J. & Paal, P. Accidental hypothermia. N. Engl. J. Med.367, 1930–1938 (2012). - PubMed
    1. Yuan, F. et al. Z-DNA binding protein 1 promotes heatstroke-induced cell death. Science376, 609–615 (2022). - PubMed
    1. Hypothermia after Cardiac Arrest Study Group Mild therapeutic hypothermia to improve the neurologic outcome after cardiac arrest. N. Engl. J. Med.346, 549–556 (2002). - PubMed
    1. Kollmar, R. et al. Hypothermia reduces perihemorrhagic edema after intracerebral hemorrhage. Stroke41, 1684–1689 (2010). - PubMed

MeSH terms

LinkOut - more resources