. 2025 Nov;31(11):3737-3748.
doi: 10.1038/s41591-025-03942-x. Epub 2025 Sep 18.

Clinical implementation of an AI-based prediction model for decision support for patients undergoing colorectal cancer surgery

Collaborators, Affiliations

Clinical implementation of an AI-based prediction model for decision support for patients undergoing colorectal cancer surgery

Andreas Weinberger Rosen et al. Nat Med. 2025 Nov.

Abstract

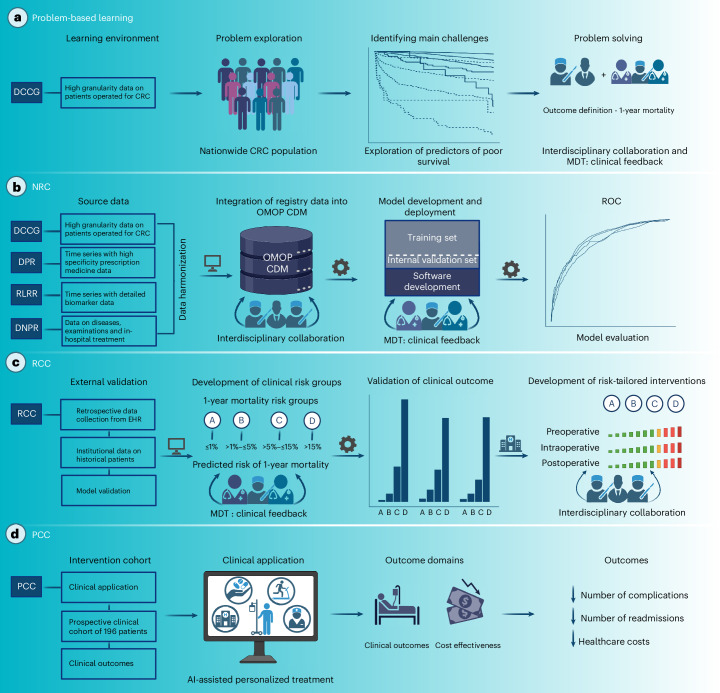
Adverse outcomes after elective cancer surgery are a main contributor to decreased survival, poorer oncological outcomes and increased healthcare costs. Identifying high-risk patients and selecting interventions according to individual risk profiles in the perioperative period in cancer surgery is a challenge. Using real-world data on 18,403 patients with colorectal cancer from Danish national registries and consecutive patients from a single center, we developed, validated and implemented an artificial-intelligence-based risk prediction model in clinical practice as a decision support tool for personalized perioperative treatment. Personalized treatment pathways were designed according to the predicted risk of 1-year mortality with the intensity of interventions increasing with the predicted risk. The developed model had an area under the receiver operating characteristic curve of 0.79 in the validation set. Results from the nonrandomized before/after cohort study showed an incidence proportion of the comprehensive complication index >20 of 19.1% in the personalized treatment group versus 28.0% in the standard-of-care group, adjusted odds ratio of 0.63 (95% confidence interval, 0.42-0.92; P = 0.02). The incidence of any medical complication was 23.7% in the personalized treatment group and 37.3% in the standard-of-care group; odds ratio of 0.53 (95% confidence interval, 0.36-0.76; P < 0.001). According to the short-term health economic modeling, personalized perioperative treatment was cost effective. The study demonstrates a fully scalable registry-based approach for using readily available data in an artificial-intelligence-based decision support pipeline in clinical practice. Our results indicate that this specific approach can be a cost-effective strategy to improve key surgical clinical outcomes.


Conflict of interest statement

Competing interests: I.G. and M.H.R. are shareholders in Nordic AI Medical ApS—a health technology company that has licensed a medical device incorporating a prediction algorithm to CE mark the algorithm. M.H.R. also serves as a consultant for Nordic AI Medical ApS. I.G., M.H.R., A.W.R. and J.R.E. are named as inventors (not patented) on a medical software developed to support MDT meetings incorporating a prediction model. The other authors declare no competing interests.

Figures

Fig. 1
Fig. 1. Overview of study flowchart.
The nationwide DCCG database, which includes information on all patients diagnosed with CRC between 1 January 2014 and 1 April 2019, served as the data source for the NRC, enriched with data from the DNPR, the DPR and the RLRR. The RCC included patients who underwent surgery for CRC at Zealand University Hospital during the period between 1 January 2020 and 31 January 2023. The PCC comprised patients treated at Zealand University Hospital during the period between 1 February 2023 and 31 December 2023. MDT, multidisciplinary team; cM1, clinical M1 category; pT1, pathologic T1 category; pCR, pathologic complete response; WW, watch and wait. Created using BioRender.com, https://BioRender.com/7dmw4xt.
Fig. 2
Fig. 2. Overview of study design.
a, The DCCG database was used for problem-based learning in which the relationships between several risk factors and mortality after surgery were explored, and the outcome of the prediction model was defined. b, Nationwide registry data were harmonized into the OMOP CDM and used for model development and internal validation. c, A retrospective clinical cohort of patients undergoing curative-intent surgery for CRC at the hospital hosting the prediction model was used to validate model performance externally. Simultaneously, clinical risk groups based on the predicted risk of 1-year mortality (A, ≤1%; B, >1% to ≤5%; C, >5% to ≤15%; D, >15%) were defined, followed by the development of risk-tailored intervention bundles targeting each risk group, with an increasing intensity of interventions for higher risk groups. d, A new local treatment paradigm was implemented on 1 February 2023, for patients scheduled for elective curative intended surgery for CRC, consisting of using the clinical prediction model as a decision support tool for clinicians to risk-stratify patients and refer patients to appropriate perioperative optimization bundles. Created using BioRender.com, https://BioRender.com/jttmuq3.
Fig. 3
Fig. 3. Findings during problem-based learning exploration.
ad, Kaplan–Meier curves for 1-year postoperative mortality for patients undergoing elective curative intended surgery, stratified by whether patients developed a postoperative complication graded as CD 2 or higher during the first 30 days following surgery different factors: age group (a), CC-index (b), WHO PS (c) and UICC stage (d). e, Correlation matrix between each factor and the development of postoperative complications graded CD 2 or higher and Spearman’s rho between each factor.
Fig. 4
Fig. 4. Summary of model performance.
a, Metrics of fit, discrimination and calibration across the development, internal validation and external validation sets together with 95% CIs. For negative predictive value (NPV), positive prediction value (PPV), sensitivity and specificity, a threshold of 0.15 was used to classify predictions as an event. b, ROC curves for the development, internal validation and external validation sets. Data are presented as the estimated curve with error bands representing 95% CI. c, Calibration curves for the development and internal validation sets. Data are presented as the estimated curve with error bands representing 95% CI. d, Barcharts of the incidence proportion and total counts of postoperative events across the development (n = 13,803), internal validation (n = 4,600) and external validation (n = 806) sets, stratified by risk group A (predicted risk of 1-year mortality ≤1%), B (predicted risk of 1-year mortality >1 to ≤5%), C (predicted risk of 1-year mortality >5 to ≤15%) and D (predicted risk of 1-year mortality >15%). The postoperative events include 1-year mortality, medical complications graded as CD 2 or above within 30 days following surgery, and surgical complications graded as CD 3a or above within 30 days following surgery. Data are presented as the proportion of events per risk group, with error bars representing 95% CI.
Fig. 5
Fig. 5. Clinical outcomes of the study.
ad, Incidence proportion (left) and results of univariate and multivariate regression analyses using logistic regression or negative binomial regression as appropriate (right) of CCI > 20 (a), incidence proportion of medical complications (b), IR of number of postoperative complications (c) and IR of the number of postoperative readmissions (d) for the PPC (after implementation of personalized perioperative treatment) and the RCC (control), stratified by risk groups A, B, C and D and overall. The regression models included either the treatment, the risk group or both as independent variables versus the outcome. The model coefficients are expressed as ORs for logistic regression or as IRRs for negative binomial regression, along with 95% CIs and associated two-sided P values based on Wald’s test, without adjustment for multiple comparisons. PPT, personalized perioperative treatment.

References

    1. Nepogodiev, D. et al. Global burden of postoperative death. Lancet393, 401 (2019). - PubMed
    1. Molenaar, C. J. L. et al. Effect of multimodal prehabilitation on reducing postoperative complications and enhancing functional capacity following colorectal cancer surgery: the PREHAB randomized clinical trial. JAMA Surg.158, 572–581 (2023). - PMC - PubMed
    1. Bausys, A. et al. Effect of home-based prehabilitation on postoperative complications after surgery for gastric cancer: randomized clinical trial. Br. J. Surg.110, 1800–1807 (2023). - PubMed
    1. Wang, B. et al. Prehabilitation program improves outcomes of patients undergoing elective liver resection. J. Surg. Res.251, 119–125 (2020). - PubMed
    1. Loftus, T. J. et al. Artificial intelligence and surgical decision-making. JAMA Surg.155, 148–158 (2020). - PMC - PubMed

LinkOut - more resources