. 2025 Oct;57(10):2536-2545.
doi: 10.1038/s41588-025-02301-3. Epub 2025 Sep 18.

Genetic and epigenetic screens in primary human T cells link candidate causal autoimmune variants to T cell networks

Affiliations

Genetic and epigenetic screens in primary human T cells link candidate causal autoimmune variants to T cell networks

Ching-Huang Ho et al. Nat Genet. 2025 Oct.

Abstract

Genetic variants associated with autoimmune diseases are highly enriched within putative cis-regulatory regions of CD4+ T cells, suggesting that they could alter disease risk through changes in gene regulation. However, very few genetic variants have been shown to affect T cell gene expression or function. Here we tested >18,000 autoimmune disease-associated variants for allele-specific effects on expression using massively parallel reporter assays in primary human CD4+ T cells. We find 545 variants that modulate expression in an allele-specific manner (emVars). Primary T cell emVars greatly enrich for likely causal variants, are mediated by common upstream pathways and their putative target genes are highly enriched within a lymphocyte activation network. Using bulk and single-cell CRISPR-interference screens, we confirm that emVar-containing T cell cis-regulatory elements modulate both known and previously unappreciated target genes that regulate T cell proliferation, providing plausible mechanisms by which these variants alter autoimmune disease risk.


Conflict of interest statement

Competing interests: R.T. holds patents related to the application of MPRA. J.S. is a scientific advisory board member, consultant and/or co-founder of Cajal Neuroscience, Guardant Health, Maze Therapeutics, Camp4 Therapeutics, Phase Genomics, Adaptive Biotechnologies, Scale Biosciences, Sixth Street Capital, Pacific Biosciences, Somite Theraputics and Prime Medicine. J.H.B. is a Scientific Co-Founder and Scientific Advisory Board member of GentiBio, a consultant for Bristol Myers Squibb and Moderna and has past and current research projects sponsored by Amgen, Bristol Myers Squibb, Janssen, Novo Nordisk and Pfizer. J.H.B. also has a patent for tenascin-C autoantigenic epitopes in rheumatoid arthritis. The other authors declare no competing interests.

Figures

Fig. 1
Fig. 1. Autoimmune-associated emVars enrich for autoimmune disease-causal variants.
a, Primary T cell MPRA workflow. b, Volcano plot. The log2 expression of the highest-expressing allele is on the x axis, and the log2 of the activity of allele1/allele2 is on the y axis. emVars are labeled red, pCRE elements are dark gray and elements with no activity are light gray. c, Enrichment of pCRE and emVar elements for the accessible chromatin profiles of all ENCODE cell types. The −log10P from a two-sided Fisher’s exact test for the enrichment of pCRE and emVar elements is on the y axis, and the rank according to this P value is on the x axis. Cell lineages are depicted according to the colors in the legend. d, Bar plot showing the enrichment of DHS elements, emVars identified in primary T cells and emVars in DHS elements for PICS statistically fine-mapped variants using probability thresholds indicated on the x axis. Bar plot shade indicates −log10P enrichment. Numbers below bars indicate the number of emVars that are statistically fine-mapped at a given PICS probability. Enrichment was calculated as a risk ratio, with P values determined through a two-sided Fisher’s exact test. e, Scatterplot comparing element allelic skew between Jurkat and primary T cell MPRA libraries. Color indicates emVar positivity in the primary T cell MPRA, Jurkat MPRA, both or neither assay. The log2 allelic bias levels of MPRA elements tested in primary T cells are plotted on the x axis and in Jurkat on the y axis. f, Venn diagram depicting called emVars in only primary T cell MPRAs (red), Jurkat MPRAs (blue) or both (purple).
Fig. 2
Fig. 2. Differences in predicted TF motif disruption between Jurkat and primary T cell MPRA experiments.
a, Scatterplot comparing the effect of variants that are predicted to disrupt a TF motif and subsequent cumulative effect on MPRA expression between both primary T cell (red outline) and Jurkat (blue fill) experiments. The effect size is calculated using Cohen’s d for variant alleles predicted to disrupt a given TF motif, and P values are calculated using a two-sided t-test comparing the effect on expression of variants that disrupt a given motif versus all other variants. b, Scatterplot comparing cumulative effect of disruption of a given factor on MPRA expression (as in a) for Jurkat (blue) and primary T cell (red) results (x axis) and the AUCell activity score indicating TF regulon activity within a given cellular population based on single-cell RNA-seq data from Jurkat and primary T cells. The shade of each dot is the −log10P from a, calculated using a two-sided t-test comparing the effect on expression of variants that disrupt a given motif versus all other variants.
Fig. 3
Fig. 3. Network analysis of predicted target genes of emVars identifies a lymphocyte activation cluster.
a, STRING network showing V2G genes linked to 79 emVars in T cell DHS sites (nodes) and edges representing the strength of gene–gene interactions. Colors represent different network subclusters. P value is calculated using a two-sided hypergeometric test. b, The subclusters with the most genes from the larger network in a with gene nodes labeled. ce, The lymphocyte activation (c), translation (d) and transcriptional regulation (e) clusters with each emVar on the x axis and target gene on the y axis. Fill color indicates that the gene is a V2G gene of the indicated emVar.
Fig. 4
Fig. 4. scCRISPRi screens connect emVars to target genes.
a, Workflow for scCRISPRi screens. MOI, multiplicity of infection. b, Volcano plots depicting significantly differentially expressed genes when targeting a given emVar CRE, with the distance of emVar CRE to gene indicated by dot color; log2(fold change) is on the x axis and −log10P for differential gene expression is on the y axis. The dotted line indicates the empirical significance cutoff determined by SCEPTRE based on calibration with the non-target control gRNAs. ce, Locus plots of the IL2RA (c), SESN3 (d) and PLEC loci (e). In d, inset scale for genome tracks is 0–3. pcHiC loops from primary human T cells are depicted below genes in the locus plot. Disease-associated variants (dots) are red if they are emVars in T cell DHS sites, blue if they are emVars not within DHS sites and gray if they are non-emVars. Accessible chromatin data from T cells are depicted as read pileups (peaks) on the locus track from various T cell types. The pink lines represent the location of emVars in DHS. Violin plots depict genes that are differentially expressed when targeting CRISPRi to the emVar using gRNAs compared to cells containing non-target gRNAs. f, Network of genes identified using scCRISPRi screens compared to all tested V2G genes for 56 emVar CREs. The red subcluster indicates the lymphocyte activation network. In be, two-sided SCEPTRE P values are false discovery rate-corrected using the Benjamini–Hochberg method. NT, non-target gRNA; FC, fold change.
Fig. 5
Fig. 5. Proliferation screens identify emVars that modulate T cell proliferation.
a, Proliferation screen experimental workflow. b, Volcano plot of significant positive control genes and variant CREs (blue and red) and non-significant targets (gray), with the log2(fold change) on the x axis and the −log10(FDR) on the y axis. c, STRING network based on 13 emVar CREs that are CRISPRi proliferation hits. The lymphocyte activation and mRNA processing clusters and the PPP5C gene are highlighted in color. d, Locus plot depicting the PPP5C locus. Disease-associated variants (dots) are depicted according to MPRA allelic skew: rs4802307 (red), an emVar in a T cell DHS site, rs62136101(blue), a probable emVar in a T cell DHS site and non-emVars (gray). Accessible chromatin data from T cells are depicted as read pileups (peaks) on the locus track from various T cell types. The pink lines represent the location of emVars in DHS sites. e, Heatmap of differentially expressed genes when targeting CRISPRi to the PPP5C TSS or to the rs62136101 CRE using gRNAs compared to cells containing a non-target gRNA. f, Scatterplot depicting the correlation between differentially expressed genes when targeting rs62136101 versus NT (y axis) and the PPP5C TSS versus NT (x axis). P value in c is determined through a two-sided hypergeometric test, and those in f are determined using a Wald test with DESeq2. Error bars in f represent the standard error 95% confidence interval.
Extended Data Fig. 1
Extended Data Fig. 1. Primary T cell MPRAs have robust replication.
a, Scatterplot showing correlation between two replicates of plasmid barcode prevalence according to normalized read counts. b, Scatterplot showing correlation between two replicates of primary T cell barcode prevalence according to normalized read counts. c, Pie charts indicate pairwise Pearson correlation between plasmid and primary T cell replicates. d, Scatterplot showing correlation between primary T cell (y-axis) versus plasmid (x-axis) barcode prevalence according to normalized read counts.
Extended Data Fig. 2
Extended Data Fig. 2. Identification of active putative cis-regulatory regions with primary T cell MPRAs.
a, Scatterplot showing normalized tag count (x-axis) by expression fold change of barcode counts in RNA versus plasmid libraries. b, Same scatterplot as (a) but indicating spiked in positive (red) and negative (blue) controls. Variant library is indicated in green. c and d, Grid search assessing enrichment of expressed elements for primary T cell DHS sites at the given thresholds of expression fold-change (log2 mRNA/plasmid; y-axis) and expression significance (log10 adjusted P-value for element expression over baseline; x-axis). In red are the chosen cutoffs for calling putative CREs for primary T cell (c) and Jurkat cell (d) MPRAs. P-values for (c) and (d) are calculated using a two-sided Fisher’s exact test.
Extended Data Fig. 3
Extended Data Fig. 3. Primary T cell MPRA prioritizes variants in hundreds of loci.
a, Total number of GWAS loci tested (green) and number of loci with at least one emVar identified (orange) for each disease GWAS. b, Histogram of the number of emVars within each GWAS locus.
Extended Data Fig. 4
Extended Data Fig. 4. Variant locations relative to cis-regulatory features.
a, Location relative to TSSs of all MPRA tested variants, active elements (pCRE), and emVars. b, Enrichment of variants within pCREs (light blue) and emVars (dark blue) within chromHMM-defined genomic regions in human T cells. (P-value from two-sided Fisher’s exact test Bonferroni-corrected for 36 independent tests). c, Functional enrichment of variants within pCREs and emVars (nominal P-value threshold of 0.05 from two-sided Fisher’s exact test Bonferroni-corrected for 8 independent tests). d, Proportion of inactive element, pCRE variants, and emVars that have allelic bias in ATAC-seq. e, Scatter plot comparing MPRA log2 allelic bias (y-axis) with allelic bias in ATAC-seq from hematopoietic cells (x-axis). Red dots are emVars (n = 10) and gray dots are pCRE variants (n = 15). f, Proportion of MPRA inactive and pCRE variants, and emVars that are chromatin accessibility QTLs (caQTLs) from T cells. g, Scatterplot comparing caQTL effect size (beta; x-axis) and MPRA log2 allelic bias (y-axis). Red dots are emVars (n = 4) and gray dots are pCREs (n = 10). h, Scatterplot comparing deltaSVM score (x-axis) with MPRA log2 allelic bias (y-axis). i, Proportion of MPRA inactive and pCRE variants and emVars that overlap TF motifs. j, Scatterplot comparing allele-specific TF binding scores (y-axis) and MPRA allelic bias (x-axis) for emVars predicted to perturb TF binding (n = 9). Calculations for (b and c) are risk ratios (see Supplementary Methods) with Fisher’s exact test P-values and Bonferroni correction (see Supplementary Tables 2 and 3 for exact P-values). (d, f, and i) P-values calculated using two-sided two proportions z test with no multiple comparisons adjustment. (e, g, h and j) R-squared and P-values are from linear regression F statistic and error bars represent standard error 95% confidence interval.
Extended Data Fig. 5
Extended Data Fig. 5. Primary T cell emVars enrich for causal variants.
a-c, Bar plot showing emVar enrichment for high posterior inclusion probability variants. Graphs in (a) and (b) consider all loci tested for PICS (a) and UKBB (b) fine mapping. The graph in (c) considers only loci with at least one emVar for UKBB finemapping. Each set of bar graphs is broken into three, with enrichment of DHS sites alone for fine-mapped variants (left), enrichment of primary T cell emVars for fine-mapped variants (middle), and enrichment of emVars in T cell DHS sites for fine-mapped variants (right), with the minimum posterior inclusion probability threshold indicated on the x-axis and fold enrichment shown on the y-axis. Details of PICS and UKBB enrichment results are shown in Supplementary Tables 7 and 8. Numbers below each bar show the number of emVars that are statistically fine-mapped at a given posterior probability threshold. Shade of each bar is the -log10 of the enrichment P-value. Enrichment in (a-c) was calculated as a risk ratio (see Methods), and P-values were determined through a two-sided Fisher’s exact test.
Extended Data Fig. 6
Extended Data Fig. 6. Primary T cell and Jurkat MPRAs identify different emVars modulated by distinct transcription factors.
a and b, Transcription factors whose motifs are predicted to be disrupted and the effect on allele-specific expression in (a) primary T cell MPRAs and (b) Jurkat MPRAs. Cohen’s d on the x-axis shows the collective effect size of variant alleles that disrupt a given TF motif and -log10 P-value on the y-axis. c, TF motif disruption of variants by disease, with disease on the y-axis, TF motif on the x-axis, dot size the -log10 P-values, and effect size, Cohen’s d, is the fill color. The motifs whose disruption caused the most significant upregulation and downregulation of expression for each disease and were hierarchically clustered according to TF and disease. For (a) and (b), effect size is calculated using Cohen’s d for variant alleles predicted to disrupt a given TF motif and P-values are calculated using a two-sided t test comparing effect on expression of variants that disrupt a given motif versus all other variants. The -log10 P-value in (a-c) is calculated using a two-sided t test comparing the effect on expression of variant alleles that disrupt a given motif compared to all other alleles tested.
Extended Data Fig. 7
Extended Data Fig. 7. Network analysis of predicted target genes of Jurkat emVars.
a, STRING network showing V2G genes linked to 31 emVars in T cell DHS sites (nodes) and edges representing the strength of gene-gene interactions. Network subclusters are represented by color. b, The subclusters with the most genes from the larger network in (a) with labeled gene nodes. c, Connectivity Map perturbagen class enrichment based on genes from STRING clusters identified from both primary T cell and Jurkat emVars in T cell DHS sites. -log10(FDR) is indicated by shade. d, Top 5 Jurkat network clusters with each putative emVar on the x-axis and target gene on the y-axis. e-g, The antigen processing (e), mRNA processing (f), and mRNA splicing (g) primary T cell network clusters from Fig. 3 with each putative emVar on the x-axis and target gene on the y-axis. Fill color indicates that the gene is a V2G gene of the indicated emVar. P-value in (a) is calculated using a hypergeometric test and those in (c) are calculated using a permutation test with FDR correction computed as the fraction of the ‘null signatures’ where the absolute normalized connectivity score exceeds reference signature.
Extended Data Fig. 8
Extended Data Fig. 8. Single cell CRISPRi screens identify emVar target genes.
a and b, QQ plots showing the expected (x-axis) versus observed (y-axis) Benjamini-Hochberg corrected two-sided SCEPTRE P-value, with dotted line indicating the significance cutoff for v1 (a) and v2 (b) libraries. Error bars represent standard error 95% confidence interval. c and d, Locus plots of the BAD (c) and ELMO1 (d) loci. pcHiC loops from primary human T cells are depicted below genes in the locus plot. Disease-associated variants (dots) are red if they are emVars in DHS, blue if they are emVars not within DHS, and gray if they are non-emVars. Accessible chromatin data from T cells are depicted as read pileups (peaks) on the locus track from various T cell types. The pink lines represent the location of emVars in DHS. Violin plots depicting the normalized expression of differentially expressed genes (y-axis) and the respective gRNA targets (x-axis). Benjamini-Hochberg corrected two-sided SCEPTRE P-values are provided for each tested gene in all panels. NT = non-target.
Extended Data Fig. 9
Extended Data Fig. 9. Genome-wide CRISPRi screen targeting variants in accessible chromatin.
a, Library makeup of genome-wide screen. b, Screen workflow. c, Rank order plot depicting targets of the CRISPRi screen, with positive control genes VAV1, IL2RB, TBX21, and CBLB, other tested genes, and variants indicated by rsid. Targets with MAGeCK permutation test P-values that are FDR corrected using the Benjamini-Hochberg with a value of less than 0.1 are indicated in blue. d, Locus plot of the MYC locus showing two variants that are proliferation hits in the screen (rank of hit in blue) in a distal enhancer that contacts the MYC promoter as determined by pcHiC in T cells. e and f, comparison of proliferation effects of targeting CRISPRi to emVar-CREs and effects of ablating local V2G-associated genes in a genome-wide CRISPR screen (e) with (f) showing only the most significant V2G gene. g and h, The lymphocyte activation (g) and mRNA processing (h) clusters made up from the hits from the 56 emVar proliferation screen with each putative emVar target gene represented with color. i, Normalized counts of rs62136101 variant alleles tested in primary T cell MPRAs across 7 donors. Each line indicates one donor.
Extended Data Fig. 10
Extended Data Fig. 10. PPP5C ablation and overexpression modulate ERK/MAPK phosphorylation.
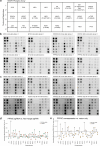
a, MAPK phosphorylation array layout. b, MAPK array blots of CD4 T cell lysates from two donors in which PPP5C was Cas9 ablated (knock out or KO) or intact (non-target control or NTC) in unstimulated (0 min) or stimulated (30 min) conditions. c, MAPK array blots of CD4 T cell lysates from two donors in which PPP5C is overexpressed (OE) or intact (vector only) in unstimulated (0 min) or stimulated (30 min) conditions. d, Normalized blot density of PPP5C-ablated setting divided by that of the same probe in the NTC setting. Dark orange dots indicate unstimulated and green dots indicate the stimulated condition. e, Normalized blot density of PPP5C-overexpression setting divided by that of the same probe in the NTC setting. Light orange dots indicate unstimulated and grey dots indicate the stimulated condition. (d and e), n = 2 donors, with each dot indicating one donor. Source data

Update of

References

    1. Zhu, J., Yamane, H. & Paul, W. E. Differentiation of effector CD4 T cell populations. Annu. Rev. Immunol.28, 445–489 (2010). - PMC - PubMed
    1. Dominguez-Villar, M. & Hafler, D. A. Regulatory T cells in autoimmune disease. Nat. Immunol.19, 665–673 (2018). - PMC - PubMed
    1. Sakaguchi, S. et al. Regulatory T cells and human disease. Annu. Rev. Immunol.38, 541–566 (2020). - PubMed
    1. Pisetsky, D. S. Pathogenesis of autoimmune disease. Nat. Rev. Nephrol.19, 509–524 (2023). - PMC - PubMed
    1. Farh, K. K. et al. Genetic and epigenetic fine mapping of causal autoimmune disease variants. Nature518, 337–343 (2015). - PMC - PubMed