. 2025 Sep;18(9):e70366.
doi: 10.1111/cts.70366.

A Multi-Scale Mechanistic Model of Ulcerative Colitis to Investigate the Effects of Selective Suppression of IL-6 Trans-Signaling

Affiliations

A Multi-Scale Mechanistic Model of Ulcerative Colitis to Investigate the Effects of Selective Suppression of IL-6 Trans-Signaling

Ola Sternebring et al. Clin Transl Sci. 2025 Sep.

Abstract

Interleukin 6 (IL-6) has previously been identified as playing a role in ulcerative colitis (UC) by activating the signal-transducing element gp130 through ligation of either the membrane-bound or soluble IL-6 receptor (termed classic and trans-signaling respectively). It has been proposed that selective inhibition of trans-IL-6 signaling could ameliorate the deleterious, pro-inflammatory effects of IL-6, while preserving the homeostatic activity of classic IL-6 signaling. We developed an in silico, mechanistic model of UC in two stages to compare the biological effects that result from inhibition of classic and trans-IL-6 signaling. In the first stage, we developed a limited-scope model of IL-6 signaling to establish the quantitative properties of classic and trans-signaling pathways on a short timescale following stimulation with IL-6. The model included both a pan-inhibitor of IL-6 classic and trans-signaling and a soluble gp130-Fc that selectively inhibited trans-signaling. In the second stage, we developed a multi-scale model of UC to study the pharmacodynamic effects of cytokine signaling inhibition and optimize treatment regimens. Across three virtual experiments, both selective and global suppression of IL-6 signaling were associated with a transition away from an inflammatory state in patients with moderate to severe inflammatory activity. In our multi-scale model, we identified a dose-response relationship between selective inhibition of trans-IL-6 signaling and tissue regeneration. Moreover, selective inhibition of trans-IL-6 signaling effectively suppressed inflammation and induced faster gut tissue healing than global IL-6 suppression. These findings suggest that global suppression of IL-6 signaling could negatively affect IL-6-induced regeneration activity, whereas this effect is less likely for selective inhibition.

Keywords: computational biology; gastrointestinal; immunology; inflammation; mechanism‐based pharmacokinetics‐pharmacodynamics; multiscale modeling.


Conflict of interest statement

O.S. was an employee of Ferring Pharmaceuticals, the sponsor of this study, at the time of this work, and is now an employee of Novo Nordisk. N.P. is an employee of PricewaterhouseCoopers A. Ravi is an employee of Ferring Pharmaceuticals, the sponsor of this study. R.C. was an employee of PricewaterhouseCoopers at the time of the study. A. Rivollier is an employee of Ferring Pharmaceuticals, the sponsor of this study. Z.W. is an employee of PricewaterhouseCoopers. S.P.V. was an employee of PricewaterhouseCoopers at the time of this work. He is now an employee of AstraZeneca and owns AstraZeneca stocks or stock options. M.B. is an employee of PricewaterhouseCoopers. S.R. is an employee of Ferring Pharmaceuticals, the sponsor of this study R.S. is an employee of Ferring Pharmaceuticals, the sponsor of this study. J.S. is an employee of PricewaterhouseCoopers. P.M.D. was a partner at PricewaterhouseCoopers at the time of this work. P.P. is an employee of Ferring Pharmaceuticals, the sponsor of this study.

Figures

FIGURE 1
FIGURE 1
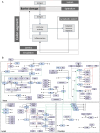
Diagram of reduced IL‐6 model. Solid lines represent transitions in which one “species” converts into another. Dotted lines represent regulatory activity, either positive (arrows) or negative (dash). Dashed lines represent movement across compartments. IL6, interleukin‐6; mIL6R, membrane IL‐6 receptor; mgp130, membrane‐bound gp130; olamk, olamkicept; p‐stat3, phosphorylated STAT3; sIL6R, soluble IL‐6 receptor; socs3, suppressor of cytokine signaling 3.
FIGURE 2
FIGURE 2
Multi‐scale model of ulcerative colitis: Model structure and diagram. (A) Overall model architecture showing the circulation compartment and one of the gut compartments. The model includes four gut compartments, each sharing a similar architecture with sub‐compartments representing the lymphatic system and lamina propria. The lamina is separated from the lumen by the epithelial barrier. Each colon segment has its own epithelial layer. (B) Multi‐scale model diagrams. Schematic diagram of the full model. Tissue and lymph compartments are shown for only one gut segment. The circulation compartment is shared by all gut segments. Solid lines represent transitions in which one “species” converts into another. Dotted lines represent regulatory activity, either positive (arrows) or negative (dash). Dashed lines represent movement across compartments. AgE, antigen in the endothelium; AgLu, antigen in the lumen; CMK, generic chemokine; CRP, C‐reactive protein; DCI, inactive dendritic cells; DCS, stimulatory dendritic cells; DCT, tolerogenic dendritic cells; EPA, active epithelium; EPD, damaged epithelium; EPH, healthy epithelium; EPR, remodeled epithelium; FCP, fecal calprotectin; IFN‐γ, interferon‐gamma; IL, interleukin; IL‐10, interleukin‐10; IL‐12, interleukin‐12; IL‐13, interleukin‐13; IL‐22_17, combined species representing the effects of interleukin‐17 and 22; IL‐23, interleukin‐23; IL‐4, interleukin‐4; IL‐6‐C, classic IL‐6 signaling complex (IL‐6, membrane IL‐6 receptor, gp130); IL‐6‐T, trans‐IL‐6 signaling complex (IL‐6, soluble IL‐6 receptor, gp130); sIL‐6R, soluble IL‐6 receptor; IL‐12‐17, species representing the combined effect of IL‐12 and IL‐17; M0, unpolarized macrophages; M1‐2, M1 and M2 macrophages; MadCAM, mucosal addressing cell adhesion molecule; MC, monocytes; muc, mucosa layer integrity; NC, neutrophiles in circulation; NT, neutrophiles in tissue; NK, natural killer cells; TGF‐β, transforming growth factor beta; TH1, T‐helper type 1; TH2, T‐helper type 2; TH17, T‐helper type 17; TNF, tumor necrosis factor; Treg, regulatory T cell.
FIGURE 3
FIGURE 3
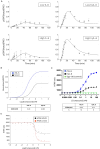
Simulation results of limited‐scope QSP model. (A) Comparison of the relative STAT3 phosphorylation dynamics in response to low (0.08 nM) and high (0.17 nM) doses of IL‐6 and hyIL‐6. Solid lines are the simulated fraction of pSTAT3. Points show experimental data in HepG2 cells from Reeh et al., 2019. For comparison purposes, the data from Reeh et al. were renormalized to our total pSTAT3 concentration of 700 nM, which is within the range reported by the authors (958 nM ±445 nM). IL‐6, interleukin‐6; hyIL‐6, hyper‐IL‐6; min, minutes; nM, nanomolar (nanomole/l); pSTAT3, phosphorylated STAT3. (B) Simulated dose–response curves for the fraction of pSTAT3 measured at 30 min post‐stimulation. EC50, half‐maximal effective concentration; hyIL‐6, hyper IL‐6; IL6, interleukin‐6; nM, nanomolar (nanomole/l); pSTAT3, phosphorylated STAT3; rhIL‐6, recombinant human IL‐6. (C) Experimentally determined dose–response curves in HT29 cells using an HTRF assay. EC50, half‐maximal effective concentration; HTRF, homogeneous time‐resolved fluorescence; hyIL‐6, hyper IL‐6; IL‐6, interleukin‐6; nM, nanomolar (nanomole/l); pSTAT3, phosphorylated STAT3; rhIL‐6, recombinant human IL‐6; sgp130, soluble gp130. (D) Comparison of real and simulated experiments testing selective trans‐signaling suppression using sgp130‐Fc in WT HT29 cells and modified cells with knocked out IL‐6 receptors (ILR‐6KO). Observed (dots) and simulated (dashed lines) suppression of pSTAT3 by trans‐specific inhibitor sgp130‐Fc in HT29 cells. WT (control, black) and ILR‐6KO cells (red) were stimulated with a combination of 1 nM sIL‐6R and 10 nM IL‐6 in the presence of sgp130‐Fc. WT cells are sensitive to both classic‐ and trans‐IL‐6 signaling, whereas IL‐6R KO cells can only respond to trans‐signals. The model recapitulates well the fraction of signaling remaining in WT cells and the overall shape of the dose–response curve. IL‐6, interleukin‐6; HTRF, homogeneous time‐resolved fluorescence; ILR, interleukin receptor; KO, knock‐out; nM, nanomolar (nanomole/l); pSTAT3, phosphorylated STAT3; sgp130‐Fc, soluble gp130‐Fc; sIL‐6R, soluble IL‐6 receptor; WT, wild‐type.
FIGURE 4
FIGURE 4
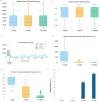
Results of virtual patient experiment with anti‐TNF treatment. (A) Baseline virtual patient FCP and tissue damage (EPD) by anti‐TNF dose. FCP, fecal calprotectin; TNF, tumor necrosis factor; EPD, damaged epithelium. (B) Changes in median FCP concentrations by anti‐TNF therapy dose. Induction starts at Week 0. The filled region corresponds to the 25%–75% interquartile range. The dashed lines indicate the 5% and 95% quantiles. FCP, fecal calprotectin; TNF, tumor necrosis factor. (C) Minimum FCP achieved between Weeks 0 and 14, broken down by anti‐TNF therapy dose. FCP, fecal calprotectin; TNF, tumor necrosis factor. (D) Minimum tissue damage achieved between Weeks 0 and 14, as estimated by the variable EPD, broken down by anti‐TNF therapy dose. FCP, fecal calprotectin; TNF, tumor necrosis factor. (E) Percentage of responders by anti‐TNF therapy dose. TNF, tumor necrosis factor.
FIGURE 5
FIGURE 5
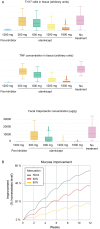
Simulations of trans‐specific IL‐6 suppression. (A) Predicted effect of increasing olamkicept doses (600–1800 mg; dosed intravenously every 2 weeks for 12 weeks) on Th17 cell population size and TNF concentrations in inflamed intestinal tissue and FCP. A pan‐inhibitor simulated at a therapeutic dose regimen was used as a positive control. All simulations were performed in a virtual UC patient population (n ~ 4500 after filtering for FCP and allowable damage ranges). A.u, arbitrary units; FCP, fecal calprotectin; IL‐6, interleukin‐6; TH17/Th17, T‐helper 17; TNF, tumor necrosis factor; UC, ulcerative colitis. (B) Mucosa (model species Muc) improvement by week–breakdown by attenuation of IL‐6 classic signaling. Simulated improvement in gut barrier after 600 mg intravenous olamkicept every 2 weeks for a total of 12 weeks on a virtual patient with moderate to severely active UC from the virtual patient population. Three experiments are shown, corresponding to three levels of attenuation of IL‐6 classic signaling (0%, 50%, and 80% inhibition). Attenuation of IL‐6 classic signaling was introduced numerically and combined with the trans‐signaling inhibition caused by olamkicept. The initial degree of damage (0% in plot) corresponds to no improvement over baseline. Improvement is shown as percent increase in barrier function relative to baseline according to the formula (1–[muc]t/[muc]baseline). IL‐6, interleukin‐6; UC, ulcerative colitis.

References

    1. Sabino J., Verstockt B., Vermeire S., and Ferrante M., “New Biologics and Small Molecules in Inflammatory Bowel Disease: An Update,” Therapeutic Advances in Gastroenterology 12 (2019): 1756284819853208, 10.1177/1756284819853208. - DOI - PMC - PubMed
    1. Wagner F. D., Schreiber S., Bagger Y., et al., “Safety, Tolerability, and Pharmacokinetics of Single‐ and Multiple‐Ascending Doses of Olamkicept: Results From Randomized, Placebo‐Controlled, First‐In‐Human Phase I Trials,” Clinical and Translational Science 17, no. 5 (2024): e13832, 10.1111/cts.13832. - DOI - PMC - PubMed
    1. Hazel K. and O'Connor A., “Emerging Treatments for Inflammatory Bowel Disease,” Therapeutic Advances in Chronic Disease 11 (2020): 2040622319899297, 10.1177/2040622319899297. - DOI - PMC - PubMed
    1. Fakhoury M., Negrulj R., Mooranian A., and Al‐Salami H., “Inflammatory Bowel Disease: Clinical Aspects and Treatments,” Journal of Inflammation Research 7 (2014): 113–120, 10.2147/JIR.S65979. - DOI - PMC - PubMed
    1. Stallmach A., Hagel S., and Bruns T., “Adverse Effects of Biologics Used for Treating IBD,” Best Practice & Research. Clinical Gastroenterology 24, no. 2 (2010): 167–182, 10.1016/j.bpg.2010.01.002. - DOI - PubMed

MeSH terms

LinkOut - more resources