. 2025 Sep 19;11(38):eadw4609.
doi: 10.1126/sciadv.adw4609. Epub 2025 Sep 19.

Nipah virus matrix protein uses cortical actin to stabilize the virus assembly sites and promote budding

Affiliations

Nipah virus matrix protein uses cortical actin to stabilize the virus assembly sites and promote budding

Jingjing Wang et al. Sci Adv. .

Abstract

Several enveloped viruses, including paramyxoviruses, assemble and bud from the host plasma membrane (PM). Nipah virus (NiV), a deadly zoonotic paramyxovirus, uses its matrix protein (M) to drive virus assembly and budding through dimerization and PM interaction. We show that NiV-M-mediated virus-like particle (VLP) production depends on its interaction with host F-actin via its carboxyl-terminal domain. We demonstrate that F-actin retains NiV-M assembly sites at the PM by analyzing NiV-M assembly kinetics. Disrupting actin dynamics or NiV-M-actin interaction alters M nanoscale organization and reduces membrane retention, without affecting initial recruitment. We also show that the Arp2/3 complex, an actin-branching factor, promotes VLP production. Inhibiting Arp2/3 reduces NiV-M retention at the PM and impairs protrusion formation while leaving the assembly rate unchanged. These findings suggest that the host F-actin retains NiV assembly sites on the PM and promotes virus budding via Arp2/3-driven actin branching.


Figures

Fig. 1.
Fig. 1.. An actin-binding domain in NiV-M is key for NiV VLP production.
(A) M protein sequences from SeV, hPIV1, and NiV, along with actin-binding proteins WASP, WASF2, and WIPF1, were aligned to identify conserved motifs. Conserved residues are in yellow, and D344 is in cyan. (B) Structural features of NiV-M were analyzed using the crystal structure (Protein Data Bank: 7SKT) and visualized with PyMOL. (C) 293T cells were transfected with 3xFLAG-tagged NiV-M constructs. β-Actin was immunoprecipitated using anti-FLAG magnetic beads. Input and IP samples were analyzed by SDS-PAGE and immunoblotting with anti-FLAG and anti–β-actin antibodies. (D) 293T cells were transfected with 3xFLAG-tagged NiV-M constructs or vector control. Cell lysates and VLPs were collected and analyzed by Western blot. [(C) and (D)] % Actin pulldown and relative budding index were determined based on integrated immunoblot density. (E) COS-7 cells stably expressing 3xFLAG-tagged NiV-M constructs were imaged by scanning electron microscopy. Scale bars, 10 μm. (F) VLPs (n > 200 per group) produced in 293T cells transfected with GFP-tagged NiV-M constructs were imaged by confocal microscopy after immunostaining with anti–β-actin and fluorescent secondary antibodies. Scale bars, 5 μm. Bars represent means ± SEM [(C) and (D)] and means ± SD (F). P values were obtained using one-way analysis of variance (ANOVA) with post hoc correction. Not significant (n.s.), P > 0.05; *P ≤ 0.05; **P ≤ 0.01. Results from ≥3 independent experiments are shown.
Fig. 2.
Fig. 2.. F-actin depolymerization alters the nano-organization of NiV-M.
(A) PK13 cells were treated with 1 μM DMSO or 1 μM LatA for 5 min and stained with phalloidin Alexa Fluor 647. Images were taken using laser scanning confocal microscopy. Representative images of 10 to 20 cells collected from three independent experiments are shown. Scale bars, 1 μm. (B) The imaging plane is at the ventral membrane of PK13 on the cell–cover glass interface. (C and D) x-y cross section (600 nm thick in z) of the SMLM images of GFP-NiV-M at the ventral membrane of PK13 cells treated by DMSO (C) or LatA (D). The boxed regions are enlarged, and the cluster maps of the NiV-M localizations are shown. NiV-M clusters are masked in red, while the unclustered NiV-M localizations are gray. Scale bars, 1 μm and 200 nm. (E) The Hopkin’s index of NiV-M localizations in DMSO and LatA-treated cells. The percentage of localizations in clusters (F), cluster diameter (G), relative density (H), circularity (I), and total density of the region of interest (ROI) (J) are shown in dot plots. Sample size n = 106 (DMSO) and 115 (LatA) from 9 to 15 cells per group. Bars represent means ± SD. P value was obtained using Student’s t test with Welch correction. n.s., P > 0.05; **P ≤ 0.01; ****P ≤ 0.0001. Results from ≥3 independent experiments are shown.
Fig. 3.
Fig. 3.. The nano-organization of NiV-M depends on its proximity to F-actin.
(A) x-y cross section (600 nm in z) of GFP-NiV-M (green) and F-actin (red) at the ventral membrane of PK13 cells. (B and C) Left: The boxed regions in (A) are enlarged. Middle: The cluster map of NiV-M (green). Right: A heatmap of the degree of colocalization (DoC) value of NiV-M localizations, with −1 (segregation) in deep blue and 1 (correlation) in deep red. Scale bars, 1 μm in (A) and 200 nm in [(B) and (C)]. (D) (i) The density gradients of both channels are calculated along an increasing radius size (r) around each localization. The two density gradients are tested for correlation, resulting in a DoC value for each localization. [(ii) and (iii)] A NiV-M cluster was considered on the F-actin when the number of coclustered localizations (DoC ≥ 0.4) exceeded 10 (26, 40). The diameter (E), relative density (F), and circularity (G) (the cluster is a true circle when circularity is 1) of NiV-M clusters on (n = 232) and off F-actin (n = 240) from 17 cells. Bars represent means ± SD. P value was obtained using Student’s t test with Welch’s correction. ****P ≤ 0.0001. Results from ≥3 independent experiments are shown.
Fig. 4.
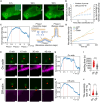
Fig. 4.. F-actin retains NiV-M assembly sites at the PM.
(A) PK13 cells expressing GFP-NiV-M were monitored by TIRF microscopy at 6, 12, and 18 hours posttransfection. Scale bars, 10 and 1 μm. (B) PK13 cells expressing GFP-NiV-M were imaged at 6 to 18 hours posttransfection using epifluorescence illumination and TIRF. The number of puncta and the intensity of diffused NiV-M were normalized to that of 6 hours. h, hours. (C) The intensity profile of GFP-NiV-M was averaged from 250 tracks from 20 cells. Red dashed lines separate three phases. (D) The intensity of GFP signals in PK13 cells expressing monomeric eGFP, GFP-NiV-M, or GFP-NiV-M-D339A was monitored using epifluorescence illumination. (E and F) Representative images of PK13 cells expressing both GFP-NiV-M (green) and F-tractin-mCherry (magenta). Scale bars, 1 μm. (G and H) The intensity profiles of on-actin and off-actin GFP-NiV-M were averaged from 260 and 238 tracks from 30 to 40 cells, respectively. The dwelling time (I) and assembly rate (J) of on-actin and off-actin NiV-M tracks. Bars represent means ± SEM (B) and means ± SD [(I) and (J)]. P value was obtained using Student’s t test with Welch’s correction. n.s., P > 0.05; ****P ≤ 0.0001. Results from ≥3 independent experiments are shown.
Fig. 5.
Fig. 5.. I349A alters the nano-organization of NiV-M and assembly dynamics.
(A and B) x-y cross section (600 nm in z) of the SMLM images of GFP-tagged NiV-M-WT (A) and I349A (B) at the ventral membrane of PK13 cells. The boxed regions are enlarged, and the cluster maps of the NiV-M localizations are shown. Scale bars, 1 μm and 200 nm. (C) The Hopkin’s index of the localizations of NiV-M-WT and I349A. (D to H) The percentage of localizations in clusters (D), cluster diameter (E), relative density (F), circularity (G), and total density of the ROI (H). Sample size n = 186 (WT) and 164 (I349A) from 12 to 18 cells per group. (I) Representative images of PK13 cells expressing GFP-tagged NiV-M-WT and I349A. Scale bars, 1 μm. (J and K) The intensity profiles of NiV-M-WT and I349A puncta were averaged from 232 and 254 tracks from 30 to 40 cells, respectively. Red dashed lines separate three phases. The dwelling time (L) and assembly rate (M) of NiV-M-WT and I349A tracks. Bars represent means ± SD. P value was obtained using Student’s t test with Welch correction. n.s., P > 0.05; **P ≤ 0.01; ***P ≤ 0.001; ****P ≤ 0.0001. Results from ≥3 independent experiments are shown.
Fig. 6.
Fig. 6.. The Arp2/3 complex promotes NiV VLP production.
(A) HeLa cells stably expressing 3xFLAG-NiV-M were treated with CK-689 and CK-666. Cell lysates and VLPs were collected and analyzed by Western blot. NiV-M was detected using a mouse anti-FLAG antibody. (B) Relative budding index is determined on the basis of integrated immunoblot density in (A). P value was obtained using one-way ANOVA with post hoc correction. n.s., P > 0.05; *P ≤ 0.05; **P ≤ 0.01. (C) HeLa cells stably expressing 3xFLAG-NiV-M were treated with control and anti-Arp3 siRNA. Cell lysates and VLPs were collected and analyzed by Western blot. NiV-M, Arp2, and Apr3 were detected using a mouse anti-FLAG antibody, a rabbit anti-Arp2, and a rabbit anti-Arp3 antibody. (D) VLP production was normalized to Arp2 and Arp3 expression levels based on the integrated immunoblot density in (C). Bars represent means ± SEM. P values were obtained using Student’s t test with Welch correction. n.s., P > 0.05; *P ≤ 0.05; **P ≤ 0.01. Results from ≥3 independent experiments are shown.
Fig. 7.
Fig. 7.. Arp2/3-driven F-actin branching retains NiV-M assembly sites on the membrane and promotes VLP budding.
(A) COS-7 cells stably expressing 3xFLAG-NiV-M treated with DMSO and CK-666 were imaged by SEM. Scale bar, 10 μm. (B) PK13 cells expressing GFP-NiV-M were treated with DMSO and 200 μM CK-666 and monitored by TIRF microscopy. Scale bars, 10 and 1 μm. (C) The ratio of the number of finger-like structures to puncta was monitored in PK13 cells treated with DMSO or 200 μM CK-666. h, hours. (D) x-y cross section (600 nm in z) of an SMLM image of GFP-NiV-M (green) and F-actin (red) in PK13 cells. Arrowheads point to NiV-M at the end of F-actin (left) or along F-actin (right). Scale bars, 1 μm. (E and F) PK13 cells expressing GFP-NiV-M were treated by 200 μM DMSO or CK-666 and monitored by TIRF microscopy. The intensity profiles of NiV-M in DMSO- and CK-666–treated PK13 cells were averaged from 287 and 277 tracks from 30 to 40 cells, respectively. The dwelling time (G) and assembly rate (H) of NiV-M tracks on the PM in DMSO- and CK-666–treated cells. Bars represent means ± SEM (C) or means ± SD [(G) and (H)]. P values were obtained using Student’s t test with Welch correction. n.s., P > 0.05; ****P ≤ 0.0001. Results from ≥3 independent experiments are shown.

References

    1. D. M. Knipe, P. M. Howley, Fields’ Virology (Lippincott Williams & Wilkins, 2007).
    1. Rima B., Balkema-Buschmann A., Dundon W. G., Duprex P., Easton A., Fouchier R., Kurath G., Lamb R., Lee B., Rota P., Wang L., Ictv Report Consortium , ICTV virus taxonomy profile: Paramyxoviridae. J. Gen. Virol. 100, 1593–1594 (2019). - PMC - PubMed
    1. Portnoy A., Jit M., Ferrari M., Hanson M., Brenzel L., Verguet S., Estimates of case-fatality ratios of measles in low-income and middle-income countries: A systematic review and modelling analysis. Lancet Glob. Health 7, e472–e481 (2019). - PMC - PubMed
    1. Abedi G. R., Prill M. M., Langley G. E., Wikswo M. E., Weinberg G. A., Curns A. T., Schneider E., Estimates of parainfluenza virus-associated hospitalizations and cost among children aged less than 5 years in the United States, 1998-2010. J. Pediatric Infect. Dis. Soc. 5, 7–13 (2016). - PMC - PubMed
    1. Aditi, Shariff M., Nipah virus infection: A review. Epidemiol. Infect. 147, e95 (2019). - PMC - PubMed

LinkOut - more resources