. 2025 Sep 30;17(10):evaf173.
doi: 10.1093/gbe/evaf173.

Integrative Genotyping and Analysis of Canine Structural Variation Using Long-read and Short-read Data

Affiliations

Integrative Genotyping and Analysis of Canine Structural Variation Using Long-read and Short-read Data

Peter Z Schall et al. Genome Biol Evol. .

Abstract

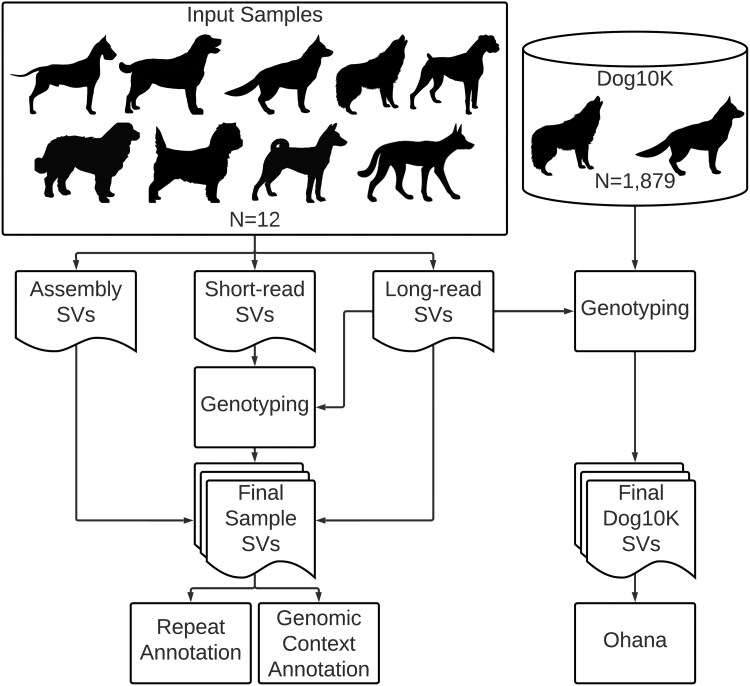
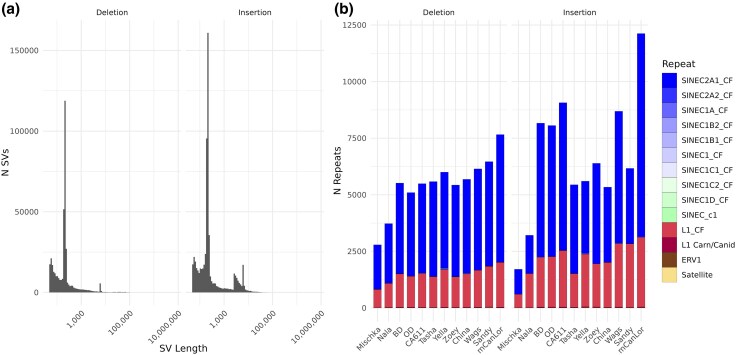
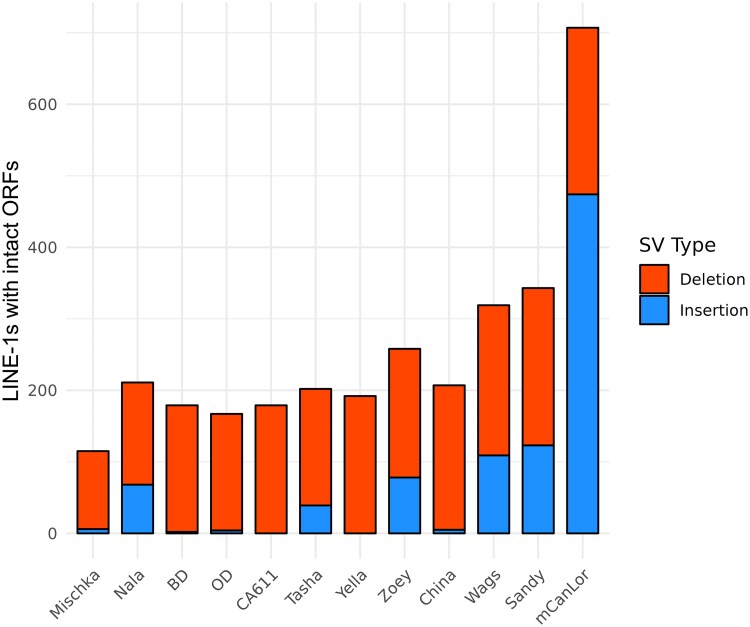
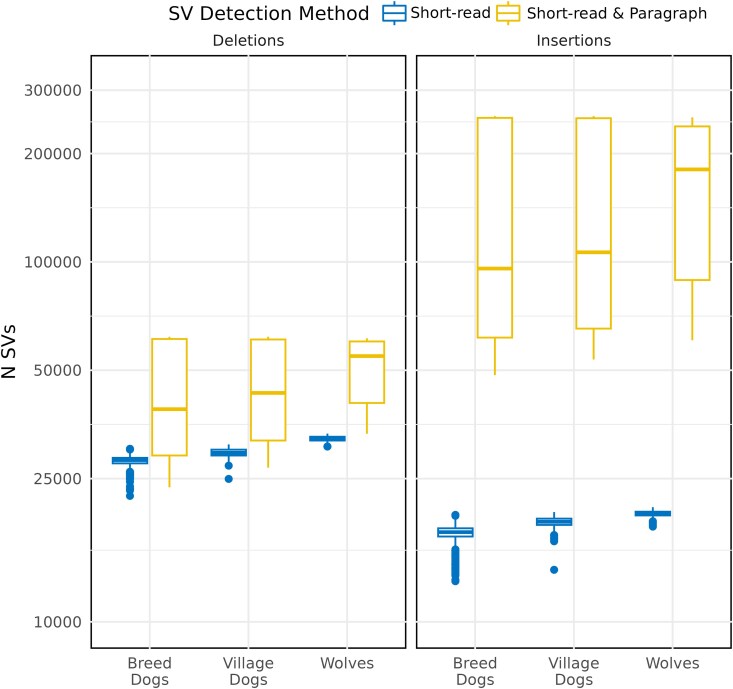
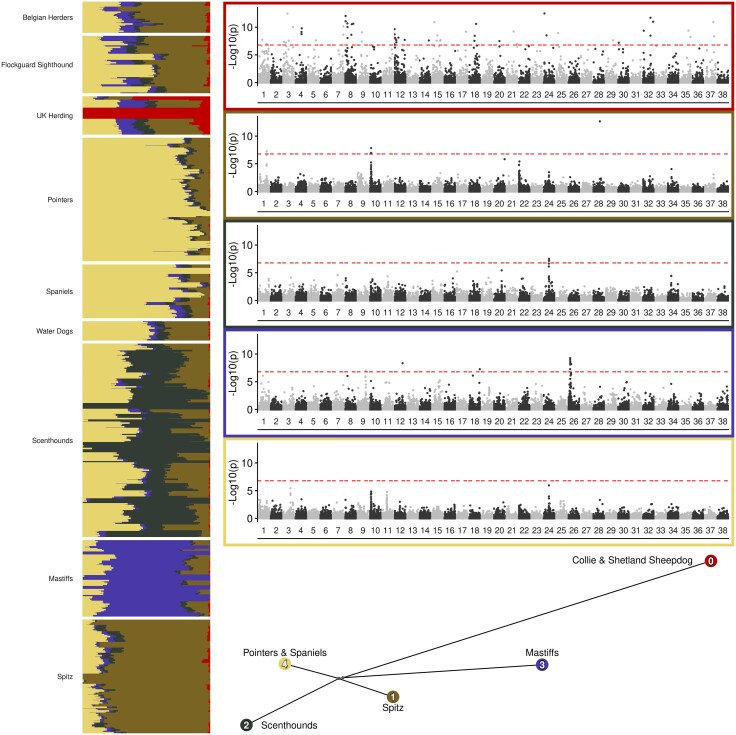
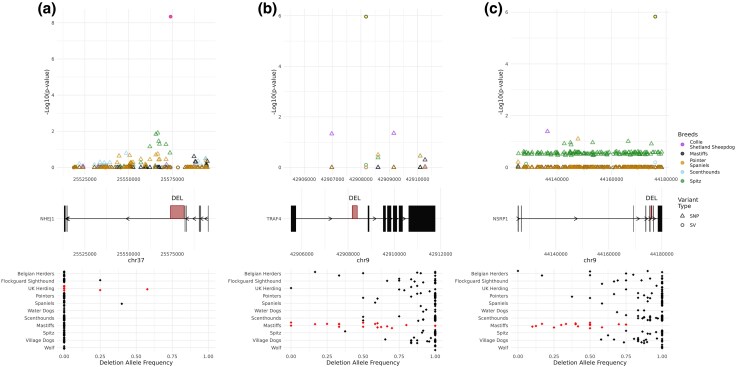
Structural variation makes an important contribution to canine evolution and phenotypic differences. Although recent advances in long-read sequencing have enabled the generation of multiple canine genome assemblies, most prior analyses of structural variation have relied on short-read sequencing. To offer a more complete assessment of structural variation in canines, we performed an integrative analysis of structural variants present in 12 canine samples with available long-read and short-read sequencing data along with genome assemblies. Use of long-reads permits the discovery of heterozygous variation that is absent in existing haploid assembly representations while offering a marked increase in the ability to identify insertion variants relative to short-read approaches. Examination of the size spectrum of structural variants shows that dimorphic LINE-1 and SINE variants account for over 45% of all deletions and identified 1,410 LINE-1s with intact open reading frames that show presence-absence dimorphism. Using a graph-based approach, we genotype newly discovered structural variants in an existing collection of 1,879 resequenced dogs and wolves, generating a variant catalog containing a 56.5% increase in the number of deletions and 705% increase in the number of insertions previously found in the analyzed samples. Examination of allele frequencies across admixture components present across breed clades identified 283 structural variants evolving with a signature of selection.

Keywords: long-read sequencing; mobile elements; structural variants.


Figures

Fig. 1.
Fig. 1.
Overview of SV detection in canines. The flowchart describes integrative analysis and detection of SVs using genome assembly, long-read, and short-read data from 12 samples. Additionally, genotyping of SVs detected using long-reads in the Dog10K repository is depicted. All variants were identified relative to the UU_Cfam_GSD_1.0_ROSY genome assembly. Created in Lucidchart www.lucidchart.com.
Fig. 2.
Fig. 2.
Global quantification of deletions and insertions using different data types. a) The number of deletions and insertions found across the 12 samples and four different datatypes: assembly, long-read, short-read, and short-read + paragraph. b) The summation of the total impacted base pairs. c) The distribution of SV lengths. The order of each bar denotes datatype origin as noted in legend.
Fig. 3.
Fig. 3.
Genotyping with paragraph enables increased detection of deletion and insertion variants using short-read data. The number and size of SVs detected using short-read data (Manta) and those genotyped using Paragraph is shown. For both (a) and (b), the color denotes SV detection by software, pink comprised of those found jointly by the original short-read and Paragraph, while gray denotes those newly genotyped only with Paragraph. a) The number of detected SVs, highlighting the increased number of variants that can be detected when genotyping with Paragraph. b) The length distribution of detected SVs, illustrating the ability to genotype long insertions when using Paragraph.
Fig. 4.
Fig. 4.
Concordance of SV detection between datatypes. Scatter plots depict the fractional quantification of detected SVs when comparing different datatypes (e.g. long-read versus assembly, long-read versus short-read, etc.). Each panel depicts a specific comparison with the axis quantifying the fraction shared. The shape of each point denotes the sample and color denotes SV type: deletions in red and insertions in blue.
Fig. 5.
Fig. 5.
Detection of SINEs and LINEs from SV data. The length distribution of all deletions and insertions, regardless of origin datatype but excluding variants identified only from assembly comparisons, are depicted in (a). These deletions and insertions were scanned for the presence of repeat sequences via blastn using canine and ancestral SINE and LINE sequences from RepBase. To identify those SVs comprised of a singular repeat, SVs were only included with at least 95% of the length constituting a repeat sequence. (b) quantifies the number of detected SVs by repeat sequence name and/or family, split by either deletion or insertion.
Fig. 6.
Fig. 6.
Census of dimorphic full-length LINE-1s with intact ORFs. SVs corresponding to full-length LINE-1 sequences were extracted and scanned for intact open reading frames (≥99% sequence similarity) and quantified by either deletion or insertion for each sample. The stacked barplot lists deleted LINE-1s in red (upper segment), and inserted LINE-1s in blue (lower segment).
Fig. 7.
Fig. 7.
Genotyping SVs identified using long-reads in the Dog10K sample collection. Box plots depict the number of deletions and insertions genotyped across the Dog10K collection using the shot-read and short-read + Paragraph approaches. The data are plotted by canine category (Breed Dogs, Village Dogs, and Wolves), as noted along the x-axis. The tabulation of the original short-read SVs is in blue (left), while short-read + Paragraph is in yellow (right).
Fig. 8.
Fig. 8.
Structural variants with signatures of selection detected by Ohana with five ancestral components. Left vertical panel plots the population structure for the nine dog-breed/clade group with K = 5 ancestral components based on the SNP data. Manhattan plots depict selection scans for SVs in each of the five ancestral components, exterior border color corresponds to color of each ancestral component, horizontal dashed red-line denotes Bonferroni threshold. The bottom network tree depicts the inferred relationships among the ancestral components from the SNP data, labeled with the breeds in which each component is maximized, filled color corresponding to both the Manhattan plot border and population structure.
Fig. 9.
Fig. 9.
Structural variants with signals of selection. The output of Ohana, combining SNP and SV data, for three examples in their specific genomic context across the included canine breed/clade categories is depicted. Each panel consists of three subpanels: the top displaying the genomic coordinates along the x-axis and the significance along the y-axis reported by Ohana, the middle displays the relevant gene model within the region, with thick boxes denoting the position of exons and the position of most significant SV given in red, the bottom displays the allele frequency by breed or geographic location for the most significant SV. For each top panel, the color denotes the canine grouping and shape delineating variant type. Within the bottom allele frequency panel, the red colored dots correspond to the clade identified via Ohana for the associated SV selection signal. Ohana output can be found in Table S7, and allele frequencies in Table S8. Results are shown for a) NHEJ1, b) TRAF4, and c) NSRP1.

References

    1. Abyzov A, Gerstein M. AGE: defining breakpoints of genomic structural variants at single-nucleotide resolution, through optimal alignments with gap excision. Bioinformatics. 2011:27:595–603. 10.1093/bioinformatics/btq713. - DOI - PMC - PubMed
    1. Aganezov S et al. A complete reference genome improves analysis of human genetic variation. Science. 2022:376:eabl3533. 10.1126/science.abl3533. - DOI - PMC - PubMed
    1. Amarasinghe SL et al. Opportunities and challenges in long-read sequencing data analysis. Genome Biol. 2020:21:30. 10.1186/s13059-020-1935-5. - DOI - PMC - PubMed
    1. Antkowiak M, Szydlowski M. Uncovering structural variants associated with body weight and obesity risk in labrador retrievers: a genome-wide study. Front Genet. 2023:14:1235821. 10.3389/fgene.2023.1235821. - DOI - PMC - PubMed
    1. Axelsson E et al. The genomic signature of dog domestication reveals adaptation to a starch-rich diet. Nature. 2013:495:360–364. 10.1038/nature11837. - DOI - PubMed

LinkOut - more resources