. 2025 Oct;7(10):2018-2032.
doi: 10.1038/s42255-025-01368-w. Epub 2025 Sep 19.

Fructose and glucose from sugary drinks enhance colorectal cancer metastasis via SORD

Affiliations

Fructose and glucose from sugary drinks enhance colorectal cancer metastasis via SORD

Tianshi Feng et al. Nat Metab. 2025 Oct.

Abstract

The consumption of sugar-sweetened beverages (SSBs), which contain high levels of fructose and glucose, has been causally and mechanistically linked to an increased risk of colorectal cancer (CRC). However, the effects of SSB consumption on advanced stages of disease progression, including metastasis, remain poorly understood. Here we show that exposure of CRC cells to a glucose and fructose formulation-reflecting the composition of both high-fructose corn syrup and sucrose found in SSBs-enhances cellular motility and metastatic potential compared to glucose alone. Given that CRC cells grow poorly in fructose alone, and cells in vivo are not physiologically exposed to fructose without glucose, we excluded the fructose-only condition from our studies unless needed as a control. Mechanistically, the combination of glucose and fructose elevates the NAD⁺/NADH ratio by activation of the reverse reaction of sorbitol dehydrogenase in the polyol pathway. This redox shift relieves NAD⁺ limitations and accelerates glycolytic activity, which in turn fuels activation of the mevalonate pathway, ultimately promoting CRC cell motility and metastasis. Our findings highlight the detrimental impact of SSBs on CRC progression and suggest potential dietary and therapeutic strategies to mitigate metastasis in patients with CRC.


Conflict of interest statement

Competing interests: The authors declare no competing interests.

Figures
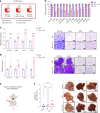
Fig. 1
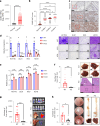
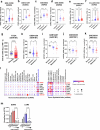
Fig. 1. Glucose and fructose together enhance the migration, invasion and metastatic potential of CRC cells in vitro and in vivo.
a, Schematic of cell culture medium used for multiple assays exploring the specific effects of glucose + fructose treatment across 13 CRC cell lines. b, Cell growth assay conducted with 20 mM glucose (Glu), 10 mM glucose + 10 mM fructose (Glu + Fru) or 20 mM fructose (Fru) in medium containing 10% dialysed FBS for 72 h. Values are normalized to the Glu condition (n = 4). c, Transwell migration assay of CRC cells conducted under Glu and Glu + Fru conditions. Migration was quantified by stained area, normalized to the Glu condition (HCT116, n = 3; DLD1, RKO, HCT8, n = 4). Representative images of migrated cells are shown in the right panel; scale bars, 500 μm. d, Transwell invasion assay of CRC cells conducted under Glu and Glu + Fru conditions. Invasion was quantified by stained area, normalized to the Glu condition (HCT116, n = 4; DLD1, n = 5; RKO, n = 3; HCT8, n = 3). Representative images of invading cells are shown in the right panel; scale bars, 500 μm. e, Schematic of the caecum injection model. f, Number of macroscopic liver tumour foci in athymic nude mice that received caecum injection of HCT116 cells and were treated with water (n = 32), 25% (w/v) Glu (n = 9) or 25% (w/v) Glu + Fru (45:55 ratio; n = 18) for 5 weeks; met., metastatic. Representative images from each group are shown in the right panel; scale bars, 0.5 cm. Data are presented as means and represent biological replicates; error bars, s.e.m. Statistical significance was determined by two-way ANOVA with Holm-Šídák post hoc test (b); one-way ANOVA with Dunnett’s post hoc test (f) or a two-tailed unpaired Student’s t-test (c and d). ****P < 0.0001; ***P < 0.001; **P < 0.01; *P < 0.05; n.s., not significant. Illustrations in a and e were created in BioRender.com. Source data
Fig. 2
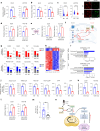
Fig. 2. Glucose and fructose together activate the SORD reverse reaction, elevating sorbitol and NAD+/NADH ratios.
a, Schematic of the metabolomics workflow in four CRC cell lines cultured for 48 h under three different conditions: 20 mM glucose, 10 mM glucose + 10 mM fructose and 20 mM fructose. The Venn diagram highlights metabolites commonly altered under Glu + Fru conditions (fold difference (FD) of >2; P < 0.05; n = 6). b, Relative intracellular sorbitol levels measured by LC–MS, normalized to the Glu group (n = 6). c, Intracellular sorbitol production after incubation in 20 mM glucose (n = 3) or 10 mM glucose + 10 mM fructose (n = 3). Cells were seeded in DMEM with 10% FBS, pre-treated with Glu or Glu + Fru medium containing 10% dialysed FBS for 1 h and then collected at different incubation time points. Sorbitol levels were measured as peak areas by LC–MS, with the average 0 h value set to zero. d, Schematic of the polyol (sorbitol) metabolic pathway. e, Immunoblotting of SORD and AR enzymes in four CRC cell lines. Cells were incubated with 20 mM glucose (labelled as 1) or 10 mM glucose + 10 mM fructose (labelled as 2) in DMEM with 10% dialysed FBS for 48 h. f, Sorbitol levels measured after 14 h of incubation with 20 mM glucose, 20 mM U-[13C]-glucose (13C Glu), 10 mM glucose + 10 mM fructose, 10 mM U-[13C]-glucose + 10 mM fructose (13C Glu + Fru) or 10 mM U-[13C]-fructose + 10 mM glucose (Glu + 13C Fru) in DMEM with 10% dialysed FBS, using LC–MS. M+6 denotes sorbitol fully labelled with six 13C carbons. Data were normalized to the Glu group. Statistical comparison of M+6 sorbitol levels between the 13C Glu + Fru and Glu + 13C Fru groups is shown (n = 3). g, Relative intracellular NAD⁺/NADH ratio in CRC cells assessed by LC–MS after 48 h incubation under Glu or Glu + Fru conditions, normalized to the Glu group (n = 5). h, Schematic showing how glucose and fructose together activate the SORD reverse reaction: glucose fuels glycolysis, generating NADH, which, together with fructose, enables SORD to convert fructose into sorbitol while oxidizing NADH to NAD⁺. Data are presented as means and represent biological replicates; error bars, s.e.m. Statistical significance was determined by one-way ANOVA with Dunnett’s post-test (b); two-way ANOVA with Holm-Šídák post hoc test (f); or two-tailed unpaired Student’s t-test (g). ****P < 0.0001; **P < 0.01. Illustrations in a and h were created in BioRender.com. Source data
Fig. 3
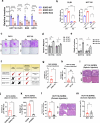
Fig. 3. SORD mediates glucose–fructose-driven CRC motility and metastasis.
a, SORD mRNA expression in normal tissues (n = 51) and colorectal tumours (n = 612) in The Cancer Genome Atlas Pan-Cancer dataset. b, SORD protein expression by IHC in normal tissues (n = 59) and in colorectal tumours of different grades (Grade 1, n = 8; Grade 2, n = 72; Grade 3, n = 15), assessed by staining intensity (0–4) and coverage. c, Representative IHC images of SORD in CRC samples. Red dashed rectangles in left panels represent zoomed-in images in right panels; scale bars, 400 μm (left) and 100 μm (right). d, Migration of WT and two independent SORD knockout clones (KO1 and KO2) under Glu + Fru conditions, assessed by transwell assay (HCT116, n = 4; DLD1, n = 4; RKO, n = 3; HCT8, n = 5). Values were normalized to WT. Right, representative images; scale bar, 500 μm. e, Growth of WT, KO1 and KO2 cells (n = 3) under Glu + Fru conditions, assessed by CellTiter-Glo. Cell numbers at 96 h were normalized to values at 24 h. f, Macroscopic liver metastases from caecum tumours generated with HCT116 SORD WT (n = 21) or KO (n = 23) cells in athymic nude mice provided with 25% (w/v) Glu + Fru (45:55) in drinking water for 5 weeks. Top right, representative liver images; scale bar, 5 mm. Bottom right, H&E staining. Black dashed squares in left panels represent zoomed-in images in right panels; scale bars, 1 mm (left), 200 μm (right). g, Liver metastases in NSG mice injected in the spleen with luciferase-labelled SORD WT or KO HCT116 cells (n = 10 per group), followed by 5 weeks of 25% (w/v) Glu + Fru (45:55) in drinking water. Right, bioluminescence imaging on day 17. Representative H&E staining of liver metastases is shown in Extended Data Fig. 4i. h, Macroscopic liver metastases from NSG mice receiving colonic injection of SORD WT or KO HCT116 cells (n = 8 per group), followed by 4 weeks of 25% (w/v) Glu + Fru (45:55) in drinking water. Middle, colonoscopic images before, during and 2 weeks after injection. Right, representative images of colon and liver; red arrows indicate metastases; scale bar, 5 mm. Data are presented as mean and represent biological replicates; error bars, s.e.m. Statistical analysis was performed using two-tailed unpaired Student’s t-test (a and fh) or one-way ANOVA with Dunnett’s post hoc test (b, d and e). ****P < 0.0001; ***P < 0.001; *P < 0.01; P < 0.05; n.s., not significant. Source data
Fig. 4
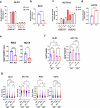
Fig. 4. Elevated NAD+/NADH ratio caused by SORD promotes CRC motility and metastasis.
a, Sorbitol levels in CRC cells after 48 h of incubation under Glu + Fru (10 mM each) conditions, measured by LC–MS (DLD1, n = 5; HCT116, n = 6). b, Relative NAD⁺/NADH ratio in CRC cells after 48 h of incubation under Glu + Fru conditions, measured by LC–MS (n = 3). c, Quantification of cytosolic Peredox NADH biosensor signals in WT and SORD KO CRC cells under Glu + Fru conditions after 24 h. The red/green fluorescence ratio reflects the NAD⁺/NADH ratio (DLD1 WT, n = 1205; DLD1 KO, n = 1147; HCT116 WT, n = 335; HCT116 KO, n = 311). Right, representative images; scale bars, 50 μm. d, Migration of SORD KO cells treated with vehicle (Veh) or α-ketobutyrate (α-KB) (DLD1, 1 mM; HCT116, 0.1 mM), assessed by transwell assay (n = 3). Values were normalized to the Veh group. e, Migration of SORD KO cells expressing empty vector (Vec) or LbNOX, assessed by transwell assay (n = 3). Values were normalized to the Vec group. Left: schematic of the chemical reaction catalysed by LbNOX. f, Schematic illustrating how SORD may enhance glycolysis under Glu + Fru conditions in CRC cells. The combination of glucose and fructose promotes regeneration of cytosolic NAD⁺, which is required to sustain high rates of aerobic glycolysis. g, LC–MS quantification of key glycolytic and TCA cycle metabolites in SORD WT and KO DLD1 cells after exposure to 10 mM U-[13C]-glucose and 10 mM fructose in 10% dialysed FBS. Sampling times, 10 min for DHAP, GA3P, PEP and pyruvate; 3 h for acetyl-CoA, citrate and succinate; 12 h for malate (n = 5). M+2 and M+3 indicate incorporation of two or three [13C] carbon atoms, respectively. h, Heatmap of relative metabolite levels in sugar metabolism, glycolysis and the TCA cycle in SORD WT and KO DLD1 cells under Glu + Fru conditions, measured by LC–MS (n = 6). Red indicates an increase; blue indicates a decrease. i, Metabolic pathways enriched in SORD WT versus KO cells (DLD1 and HCT116), based on RNA-seq data (n = 4). Cells were incubated under Glu + Fru conditions for 48 h. Pathway analysis was performed using Qiagen Ingenuity Pathway Analysis on genes with P < 0.05 and |log2(fold change)| > 0.5. Blue bars indicate mevalonate-related pathways. The P value and fold change were calculated using Qiagen Ingenuity Pathway Analysis with Fisher’s exact test. j, Absolute quantities of key mevalonate pathway metabolites in SORD WT and KO DLD1 cells under Glu + Fru conditions, measured by LC–MS (WT, n = 3; KO, n = 4). k, Migration of SORD WT cells assessed by transwell assay under Glu + Fru conditions with vehicle or fluvastatin (Fluv) (n = 3). Values were normalized to vehicle. DLD1, 1.5 μM; HCT116, 1 μM. l, Migration of SORD KO cells assessed by transwell assay with vehicle (or mevalonolactone (MVA; a cell-permeable form of mevalonate) (n = 3). Values were normalized to vehicle. DLD1, 5 mM; HCT116, 2 mM. m, Liver metastatic tumour foci counts in mice that received vehicle (n = 13) or simvastatin (Simv; n = 12) by daily oral gavage. Following caecal injection of HCT116 cells, athymic nude mice were treated with 100 μl day−1 of 10% DMSO (Veh) or 30 mg kg−1 day−1 simvastatin in 100 μl of 10% DMSO. All mice received 25% Glu + Fru (45:55) in drinking water for 5 weeks before liver metastasis assessment. n, Schematic showing how consumption of sugary drinks containing glucose and fructose may promote CRC migration and metastasis via SORD. All in vitro experiments were conducted under Glu + Fru (10 mM each) conditions unless otherwise specified. Data are presented as means and represent biological replicates; error bars, s.e.m. Statistical significance was determined by two-tailed unpaired Student’s t-test (ae and jm) or two-way ANOVA with Holm–Šídák post hoc test (g). ****P < 0.0001; ***P < 0.001; **P < 0.01; *P < 0.05. Illustration in n created with BioRender.com. LDH, lactate dehydrogenase; DHAP, dihydroxyacetone phosphate; GA3P, glyceraldehyde-3-phosphate; 3PG, 3-phosphoglycerate; G3P, glycerol-3-phosphate; PEP, phosphoenolpyruvate; OAA, oxaloacetate; HMG-CoA, 3-hydroxy-3-methylglutaryl-CoA; MVA-5P, mevalonate-5-phosphate; MVA-5PP, mevalonate-3,5-bisphosphate; IPPP, isopentenyl pyrophosphate; GPP, geranyl pyrophosphate. Source data
Extended Data Fig. 1
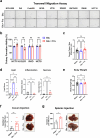
Extended Data Fig. 1. Glucose and fructose together enhance the migration, invasion, and metastatic potential of colorectal cancer cells in vitro and in vivo.
a, Transwell images of 9 out of 13 CRC cell lines that did not migrate through the transwell under either 20 mM glucose (Glu) or 10 mM glucose + 10 mM fructose (Glu + Fru) with 10% dialyzed FBS for 48 h. The experiments were repeated twice, and representative images are shown. b, Colony formation assessed under 20 mM glucose (Glu) or 10 mM glucose + 10 mM fructose (Glu + Fru) (n = 6). c-e, Primary cecum tumor size (c), liver histological analysis (H&E) (d) and body weight (e) of athymic nude mice injected in the cecum with HCT116 cells and treated with water (Water; n = 31), 25% (w/v) glucose (Glu; n = 8), or 25% (w/v) glucose + fructose (45:55) (Glu + Fru; n = 19) in their drinking water for 5 weeks. For liver histology (d), n = 20 (Water), n = 8 (Glu), and n = 11 (Glu + Fru). f, The number of macroscopic liver tumor foci was quantified in mice that received either water or Glu + Fru following cecum injection of HCT116 cells. Mice were administered 400 μl water (Water) or 400 μl of 25% (w/v) Glu + Fru (45:55) daily via oral gavage for 5 weeks prior to liver metastasis assessment (n = 16 per group). Representative liver images are shown on the right; scale bar, 5 mm. g, The number of liver tumor foci was quantified in NSG mice that received intrasplenic injection of HCT116 cells and were treated with either water (Water; n = 3) or 25% (w/v) Glu + Fru (45:55) (Glu + Fru; n = 4) in their drinking water for 4 weeks. Representative liver images are shown on the right; scale bar, 5 mm. All data represent mean ± s.e.m. and are derived from biological replicates. Statistical analysis was performed using one-way ANOVA with Dunnett’s post hoc test (c, e); two-tailed unpaired Student’s t-test (b, f, g) or Kruskal-Wallis test (d). **P < 0.01; *P < 0.05; ns, not significant. Source data
Extended Data Fig. 2
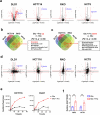
Extended Data Fig. 2. Sorbitol is significantly and consistently increased under glucose + fructose conditions compared to glucose or fructose alone across all four CRC cell lines.
a, Volcano plots comparing metabolomic profiles from DLD1, HCT116, RKO, and HCT8 cells treated with 20 mM glucose (Glu) or 10 mM glucose + 10 mM fructose (Glu + Fru) in 10% dialyzed FBS for 48 h. Red dashed lines indicate –log₁₀(P value) = 1.3, log₂FC(Glu + Fru / Glu) = 1, and log₂FC(Glu + Fru / Glu) = –1. b, Venn diagram of commonly increased metabolites in Glu + Fru compared to Glu across all four CRC cell lines (fold change > 2; P < 0.05). c, Venn diagram of commonly decreased metabolites in Glu + Fru compared to Glu across all four CRC cell lines (fold change > 2; P < 0.05). d, Scatter plot showing metabolite changes under Glu + Fru versus glucose (x-axis) and Glu + Fru versus fructose (y-axis) in four CRC cell lines. Cutoff values: fold change > 2 and P < 0.05. Red dashed lines indicate log₂FC(Glu + Fru / Glu) = 1, log₂FC(Glu + Fru / Glu) = –1, log₂FC(Glu + Fru / Fru) = 1, and log₂FC(Glu + Fru / Fru) = –1. D-sorbitol is the only metabolite that meets the criteria for consistent enrichment across all four cell lines. e, Medium sorbitol levels following incubation in 20 mM glucose (Glu; n = 3) or 10 mM glucose + 10 mM fructose (Glu + Fru; n = 3). Cells were seeded in DMEM with 10% FBS, pre-treated with Glu or Glu + Fru medium containing 10% dialyzed FBS for 1 h, and collected at various timepoints. Sorbitol levels were measured as peak areas by LC/MS, with the average 0 h value set to zero. f, Relative intracellular NAD⁺/NADH ratio in CRC cells assessed by LC/MS after 48-hour incubation under Glu or Glu + Fru conditions, normalized to the Glu group. (RKO, n = 6; HCT8, n = 5). All data represent mean ± s.e.m. and are derived from biological replicates. Statistical analysis was performed using two-tailed unpaired Student’s t-test (a - d and f). **P < 0.01. Source data
Extended Data Fig. 3
Extended Data Fig. 3. SORD expression, but not AKR1B1 expression, is elevated in human colorectal tumors.
a, SORD mRNA expression in normal tissues (n = 54), primary colorectal tumors (n = 185), and metastatic colorectal tumors (n = 67) in GSE41258. b, SORD mRNA expression in normal tissues (n = 7), primary colorectal tumors (n = 18), and metastatic colorectal tumors (n = 18) in GSE14297. c, SORD mRNA expression in normal tissues (n = 23), primary colorectal tumors (n = 30), and metastatic colorectal tumors (n = 27) in GSE35834 dataset. d, SORD mRNA expression in normal tissues (n = 18), primary colorectal tumors (n = 20), and metastatic colorectal tumors (n = 19) in GSE49355. e, SORD mRNA expression in normal tissues (n = 162), primary colorectal tumors (n = 233), and metastatic colorectal tumors (n = 55) in OncoGEO B37. f, SORD mRNA expression in normal tissues (n = 74), primary colorectal tumors (n = 137), and metastatic colorectal tumors (n = 21) in OncoGEO B38 dataset. g, AKR1B1 mRNA expression in normal tissue (n = 51) and colorectal tumor tissues (n = 612) in TCGA PANCAN dataset. One outlier (value > mean + 6σ) in the tumor group was excluded from the graph, which did not affect statistical significance. h, AKR1B1 mRNA expression in normal tissues (n = 54), primary colorectal tumors (n = 185), and metastatic colorectal tumors (n = 67) in GSE41258 dataset. i, AKR1B1 mRNA expression in normal tissues (n = 7), primary colorectal tumors (n = 18), and metastatic colorectal tumors (n = 18) in GSE14297 dataset. j, AKR1B1 mRNA expression in normal tissues (n = 18), primary colorectal tumors (n = 20), and metastatic colorectal tumors (n = 19) in GSE49355 dataset. k, AKR1B1 mRNA expression in normal tissues (n = 23), primary colorectal tumors (n = 30), and metastatic colorectal tumors (n = 27) in GSE35834 dataset. l, Dot plot of SORD, AKR1B1 and intestinal stem cell markers expression across all clusters (left) and tumor epithelial clusters (right) in the Human Colon Cancer Atlas (c295) single-cell dataset. Dot size indicates the percentage of cells expressing the gene; color intensity reflects average scaled expression. m, Relative expression of SORD and LGR5 in human CRC organoids, human enteroids, and during enteroid monolayer differentiation (Days 0, 3, 5, and 9) (n = 3). All data represent mean ± s.e.m. and are derived from biological replicates. Statistical analysis was performed using one-way ANOVA with Dunnett’s post hoc test (a-f, h-k, m) or two-tailed unpaired Student’s t-test (g). ****P < 0.0001; ***P < 0.001; *P < 0.05; ns, not significant. Source data
Extended Data Fig. 4
Extended Data Fig. 4. SORD, but not AR, mediates glucose–fructose-driven colorectal cancer (CRC) migration, invasion, and metastasis.
a, Transwell invasion assay of isogenic SORD WT (Cas9-expressing control) and two knockout (KO) clones derived from four CRC cell lines under Glu + Fru conditions. Invasion was quantified based on stained area and normalized to WT (SORD WT: HCT116, RKO and HCT8: n = 8; DLD1, n = 7. SORD KO1: HCT116 and HCT8: n = 4; DLD1: n = 6; RKO: n = 5. SORD KO2: HCT116 and DLD1: n = 3; HCT8 and RKO: n = 5). b, c, Transwell migration assay (b) and representative images (c) of wild-type (WT; n = 3) and SORD KO (n = 3) cells under Glu or Glu + Fru conditions. Migration was quantified based on stained area and normalized to WT-Glu. Scale bar, 500 μm. d, Transwell migration assay of isogenic aldose reductase (AR) WT (Cas9-expressing control) and two AR KO clones derived from HCT116 (n = 4) and HCT8 (n = 3) under Glu + Fru condition. Values were normalized to WT. e, Transwell invasion assay of isogenic AR WT and two KO clones derived from HCT116 (n = 4) and HCT8 (n = 3) under Glu + Fru condition. Values were normalized to WT. f, Schematic overview of tumor progression features evaluated using each xenograft model. Checkmarks indicate which biological processes—local growth, invasion, and metastasis—can be assessed based on injection site and model design. g, Number of macroscopic liver tumor foci from cecum tumors established with RKO-derived SORD WT (n = 13) or KO (n = 6) cells. h, Number of macroscopic liver tumor foci from cecum tumors established with HCT116-derived AR WT (n = 8) or KO (n = 7) cells. i, Representative H&E staining from Fig. 3g showing liver metastases in NOD scid gamma (NSG) mice injected in the spleen with luciferase-labeled SORD WT or KO HCT116 cells. Scale bars, 3 mm (left), 1 mm (right). j, Number of macroscopic liver tumor foci in mice injected with SORD WT and KO HCT8 cells in the splenic injection model (n = 4 per group). k, Number of macroscopic liver tumor foci in GFP-shRNA (n = 3) and SORD-shRNA2 (n = 4) groups derived from HCT8 in a splenic injection model. l, Microscopic liver metastases from NSG mice receiving colonic injection of SORD WT or KO HCT116 cells (n = 8 per group), followed by 4 weeks of 25% (w/v) Glu + Fru (45:55) in drinking water. Right: representative H&E staining; scale bars, 1 mm (left), 400 μm (right). m, Colon tumor size in NSG mice injected with SORD WT (n = 8) or KO (n = 8) HCT116 cells into the distal colon mucosa under colonoscopic guidance. All data represent mean ± s.e.m. and are derived from biological replicates. All mice receiving in vivo injections were treated with 25% (w/v) glucose + fructose (45:55) in drinking water for 5 weeks unless otherwise specified. Statistical analysis was performed using one-way ANOVA with Dunnett’s post hoc test (a, b, d, e) or two-tailed unpaired Student’s t-test (gm). ****P < 0.0001; ***P < 0.001; **P < 0.01; *P < 0.05; ns, not significant. Source data
Extended Data Fig. 5
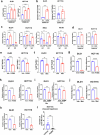
Extended Data Fig. 5. SORD mediates glucose–fructose-driven migration via the NAD⁺/NADH ratio, but not through sorbitol.
a, Sorbitol levels in isogenic SORD WT and KO clones derived from DLD1 were measured after 14 h of incubation under the following conditions: 20 mM U-[13C]-glucose (13 G), 10 mM U-[13C]-glucose + 10 mM fructose (13 G + F), or 10 mM glucose + U-[13C]-fructose (G + 13 F), 10 mM glucose + 10 mM fructose (G + F), all in DMEM with 10% dialyzed FBS. Metabolite levels were quantified using LC/MS (n = 5). b, Sorbitol levels in SORD WT and KO clones derived from RKO after 48 h of incubation under Glu + Fru (10 mM each) conditions, measured by LC/MS (n = 5). c, Sorbitol levels in isogenic SORD WT and KO clones derived from HCT116 were measured (n = 3). The condition is the same as in (a). d, Measurement of relative sorbitol level in SORD WT and KO clones derived from HCT8. (n = 5). The condition is the same as in (b). e, Relative NAD⁺/NADH ratio in CRC cells after 48 h of incubation under Glu + Fru conditions, measured by LC/MS (n = 3). f, The NAD⁺/NADH ratio in SORD WT and KO cells cultured in 20 mM glucose (Glu) or 10 mM glucose + 10 mM fructose (Glu + Fru) was measured using an enzymatic assay kit (DLD1: n = 4; HCT116: n = 3). g, Quantification of the cytosolic Peredox NADH biosensor in WT and SORD KO cells from DLD1 (WT Glu, n = 960; WT Glu + Fru, n = 1205; KO Glu, n = 1264; KO Glu + Fru, n = 1147), HCT116 (WT Glu, n = 382; WT Glu + Fru, n = 509; KO Glu, n = 382; KO Glu + Fru, n = 247), RKO (WT Glu, n = 783; WT Glu + Fru, n = 646; KO Glu, n = 1506; KO Glu + Fru, n = 1161), and HCT8 (WT Glu, n = 994; WT Glu + Fru, n = 1013; KO Glu, n = 1489; KO Glu + Fru, n = 1554), after 24 h under Glu or Glu + Fru conditions. The Peredox biosensor (green) and mCherry (red) were quantified, and the red/green fluorescence ratio reflects the NAD⁺/NADH ratio. All data represent mean ± s.e.m. from biological replicates. Statistical significance was determined using two-way ANOVA with Holm–Sidak post hoc test (a, c), two-tailed unpaired Student’s t-test (b, d, e) or one-way ANOVA with Dunnett’s post hoc test (f, g). ****P < 0.0001; ***P < 0.001; **P < 0.01; *P < 0.05; ns, not significant. Source data
Extended Data Fig. 6
Extended Data Fig. 6. Elevated NAD+/NADH ratio caused by SORD promotes CRC motility.
a, NAD⁺/NADH ratio in SORD KO cells measured by enzymatic bioluminescence assay after 24 h of treatment with vehicle, α-ketobutyrate (α-KB; DLD1: 1 mM; HCT116: 0.1 mM), or nicotinamide (NAM; DLD1: 2.5 mM; HCT116: 5 mM) (n = 3). b, NAD⁺/NADH ratio in SORD KO cells expressing either empty vector (Vec) or LbNOX, measured by LC/MS (n = 6). Values were normalized to Vec. c, Transwell migration assay of isogenic SORD WT and KO cells expressing either empty vector (Vec) or LbNOX (n = 3), derived from four CRC cell lines. Values were normalized to WT–Vec. d, Transwell migration assay of SORD KO cells treated with vehicle or NAM (DLD1: 2.5 mM; HCT116: 5 mM). Values were normalized to vehicle (n = 3). e, NAD⁺/NADH ratio in SORD KO cells measured by enzymatic assay after 24 h of treatment with vehicle or FK866 (DLD1: 10 nM; HCT116: 1 nM) (n = 3). f, NAD⁺/NADH ratio in SORD KO cells measured by enzymatic assay after 24 h of treatment with vehicle or metformin (1 mM) (n = 3). g, Migration of SORD WT cells treated with vehicle or FK866 (DLD1, 10 nM; HCT116, 1 nM), a NAMPT inhibitor, assessed by transwell assay (n = 3). h, Transwell migration assay of DLD1 (n = 3) and HCT116 (n = 3) cells treated with vehicle or FK866 (DLD1: 10 nM; HCT116: 1 nM). Drug concentrations were optimized for each cell line to minimize cytotoxicity while allowing assessment of migration effects. Cell numbers were measured in parallel under the same conditions to account for potential proliferation effects. Migration values were normalized to cell number using SYBR Green assay results and expressed as fold change relative to the vehicle group. i, Transwell migration assay of DLD1 (n = 3) and HCT116 (n = 3) cells under 20 mM glucose (Glu) with vehicle or FK866 (DLD1: 10 nM; HCT116: 1 nM). Migration values were normalized to cell number measurements and expressed as fold change relative to vehicle. j, Migration of SORD WT cells treated with vehicle or metformin (1 mM), assessed by transwell assay (n = 3). k, Migration values in (j) were normalized to cell number measurements and expressed as fold change relative to vehicle. l, Macroscopic liver tumor foci counts from cecal tumors established with HCT116 SORD WT cells treated with vehicle (n = 10) or FK866 (n = 9), administered by intraperitoneal injection (10 mg/kg body weight) every other day for 5 weeks under 25% (w/v) Glu + Fru (45:55) in drinking water. All in vitro experiments were conducted under Glu + Fru (10 mM each) conditions unless otherwise noted. All data represent mean ± s.e.m. from biological replicates. Statistical analysis was performed using one-way ANOVA with Dunnett’s post hoc test (a, c) or two-tailed unpaired Student’s t-test (b, dl). ****P < 0.0001; ***P < 0.001; **P < 0.01; *P < 0.05; ns, not significant. Source data
Extended Data Fig. 7
Extended Data Fig. 7. SORD-mediated NAD⁺ regeneration under glucose + fructose conditions activates glycolysis and the TCA cycle.
a, Heatmap of relative metabolite levels in sugars, glycolysis, and the TCA cycle in SORD WT and KO HCT116 cells after 48 h incubation under Glu + Fru conditions. b, Heatmap for SORD WT and Knockdown (KD) cells in HCT8 after 48 hours incubation under Glu + Fru conditions. c, Heatmap showing relative metabolite levels in sugars, glycolysis, and the TCA cycle after 48 h treatment under Glu or Glu + Fru conditions in DLD1 (n = 6) and HCT116 (n = 5) cells. d, Heatmap of relative metabolite levels in sugars, glycolysis, and the TCA cycle in SORD KO cells and SORD KO cells expressing LbNOX in DLD1 (n = 6) and HCT116 (n = 5) after 48 h under Glu + Fru conditions. e, Bar graph showing relative levels of glycolytic and TCA cycle metabolites in DLD1 cells from four groups: SORD WT under Glu (n = 6), SORD WT under Glu + Fru (n = 12), SORD KO under Glu + Fru (n = 6), and SORD KO expressing LbNOX under Glu + Fru (n = 6). Metabolite levels were normalized to SORD WT under Glu + Fru conditions. Medium conditions: Glu, 10 mM glucose; Glu + Fru, 10 mM glucose + 10 mM fructose. Red indicates an increase and blue a decrease in heatmaps (ad). All metabolite levels were measured by LC/MS (ae). Data represent mean ± s.e.m. from biological replicates. Statistical comparisons were made using a two-tailed unpaired Student’s t-test (e). ****P < 0.0001; ***P < 0.001; **P < 0.01; *P < 0.05. F-1,6-BP, fructose-1,6-bisphosphate; DHAP, dihydroxyacetone phosphate; GA3P, glyceraldehyde 3-phosphate; 3PG, 3-phosphoglycerate; G3P, glycerol-3-phosphate; PEP, phosphoenolpyruvate; α-KG, α-ketoglutarate; OAA, oxaloacetate. Source data
Extended Data Fig. 8
Extended Data Fig. 8. SORD-mediated NAD⁺ regeneration under glucose + fructose conditions activates the mevalonate pathway.
a, Heatmap of gene expression levels for genes in the mevalonate pathway in SORD WT and KO cells derived from HCT116, based on RNA-seq data. Cells were incubated in Glu + Fru (10 mM each) for 48 h (n = 4). b, Schematic of the mevalonate pathway highlighting key enzymes (in red) and metabolites. An asterisk marks HMG-CoA reductase (HMGCR), the pathway’s rate-limiting enzyme. Statins inhibit HMGCR. c, Heatmap of relative metabolite levels in the mevalonate pathway in WT and SORD KO cells after 24 h (DLD1 and RKO), 36 h (HCT8), or 48 h (HCT116) under Glu + Fru conditions (DLD1, n = 4; HCT116, n = 6; RKO, n = 4; HCT8, n = 4). d, Heatmap of relative metabolite levels in the mevalonate pathway in DLD1 (n = 4) and HCT116 (n = 5) cells after 24 h treatment with Glu (10 mM) or Glu + Fru (10 mM each). e, Heatmap of relative metabolite levels in the mevalonate pathway in SORD KO and SORD KO + LbNOX cells from DLD1 (n = 4) and HCT116 (n = 6) after 48 h under Glu + Fru conditions. Red indicates an increase and blue a decrease in all heatmaps. All metabolites were measured using LC–MS. Metabolite abbreviations: AcAc-CoA, acetoacetyl-CoA; HMG-CoA, 3-hydroxy-3-methylglutaryl-CoA; MVA, mevalonate; MVA-5P, mevalonate-5-phosphate; MVA-5PP, mevalonate-5-pyrophosphate; IPPP, isopentenyl pyrophosphate; GPP, geranyl pyrophosphate; FPP, farnesyl pyrophosphate. Extended Data Fig. 8b was created in BioRender. Yun, J. (2025) https://BioRender.com/2ebrqwu. Source data
Extended Data Fig. 9
Extended Data Fig. 9. The mevalonate pathway contributes to CRC cell motility.
a, Migration of SORD WT cells assessed by transwell assay under Glu + Fru conditions with vehicle (Veh) or fluvastatin (Fluv) (n = 3; HCT8, 2 μM; RKO, 0.5 μM). Values were normalized to vehicle. b, Normalized migration (by SYBR green assay-based cell number) of SORD WT cells from four CRC cell lines under Glu + Fru condition with vehicle (Veh) or fluvastatin (Fluv) (n = 3; DLD1, 1.5 μM; HCT116, 1 μM; HCT8, 2 μM; RKO, 0.5 μM). Values were normalized to vehicle. c, Normalized migration (by SYBR green assay-based cell number) of DLD1 and HCT116 cells under 20 mM glucose (Glu) with vehicle (Veh) or fluvastatin (Fluv) (n = 3). Values were normalized to vehicle. d, Normalized migration (by SYBR green assay-based cell number) of SORD KO cells or SORD KO cells expressing LbNOX under Glu + Fru conditions with vehicle (Veh) or fluvastatin (Fluv) (n = 3). Values were normalized to vehicle. e, Migration of SORD KO cells treated with vehicle (Veh) or mevalonolactone (MVA; a cell-permeable form of mevalonate) (n = 3; HCT8, 10 mM; RKO, 5 mM). Values were normalized to vehicle. f, Transwell migration of SORD WT cells derived from DLD1 and HCT116 treated with vehicle (Veh) or mevalonolactone (MVA; a cell-permeable form of mevalonate) (DLD1, 5 mM; HCT116, 2 mM. n = 3). Values were normalized to the vehicle group. All the in vitro experiments were conducted under Glu + Fru (10 mM each) condition unless otherwise noted. Data represent mean ± s.e.m. from biological replicates. Statistical analysis was performed using two-tailed unpaired Student’s t-test (a-c, e, f) or one-way ANOVA with Dunnett’s post hoc test (d). ****P < 0.0001; ***P < 0.001; **P < 0.01; *P < 0.05; ns, not significant. Source data

References

    1. Chan, A. T. & Giovannucci, E. L. Primary prevention of colorectal cancer. Gastroenterology138, 2029–2043.e10 (2010). - PMC - PubMed
    1. Johnson, R. J. et al. Potential role of sugar (fructose) in the epidemic of hypertension, obesity and the metabolic syndrome, diabetes, kidney disease, and cardiovascular disease. Am. J. Clin. Nutr.86, 899–906 (2007). - PubMed
    1. Lara-Castor, L. et al. Sugar-sweetened beverage intakes among adults between 1990 and 2018 in 185 countries. Nat. Commun.14, 5957 (2023). - PMC - PubMed
    1. Bleich, S. N., Wang, Y. C., Wang, Y. & Gortmaker, S. L. Increasing consumption of sugar-sweetened beverages among US adults: 1988–1994 to 1999–2004. Am. J. Clin. Nutr.89, 372–381 (2009). - PubMed
    1. Rosinger, A., Herrick, K., Gahche, J. & Park, S. Sugar-sweetened beverage consumption among US adults, 2011–2014. NCHS Data Brief270, 1–8 (2017). - PubMed