. 2025 Oct;26(20):5009-5026.
doi: 10.1038/s44319-025-00565-8. Epub 2025 Sep 19.

The invasion pore induced by Toxoplasma gondii

Affiliations

The invasion pore induced by Toxoplasma gondii

Yuto Kegawa et al. EMBO Rep. 2025 Oct.

Abstract

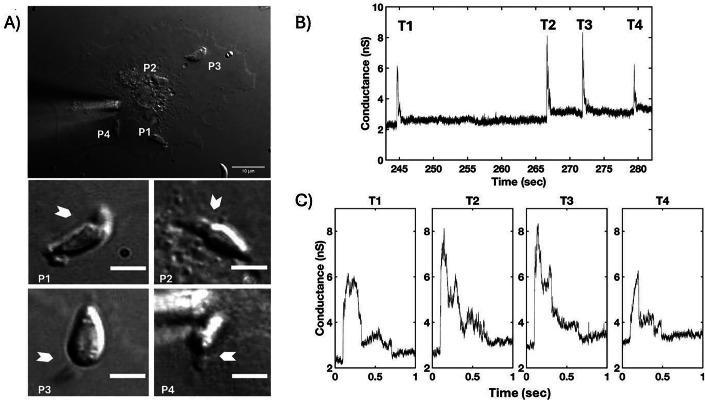
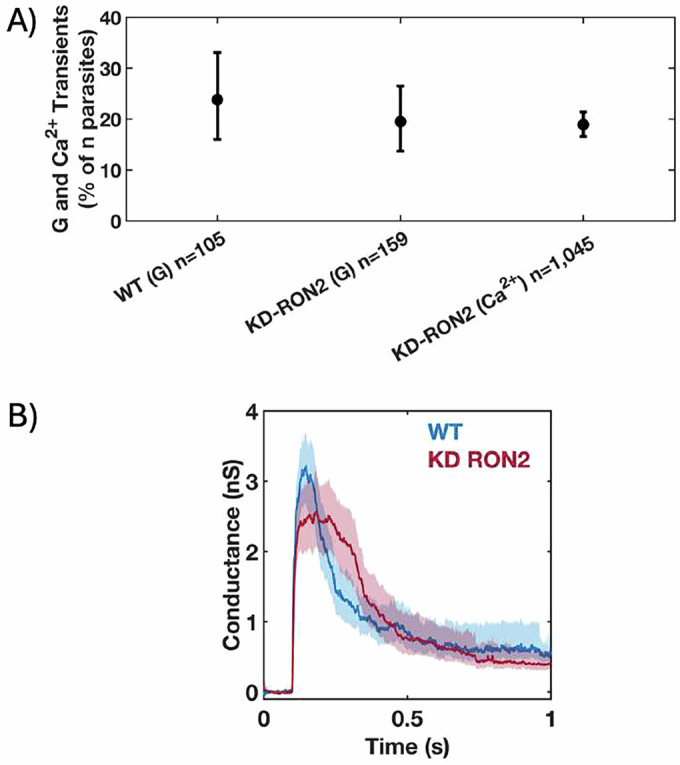
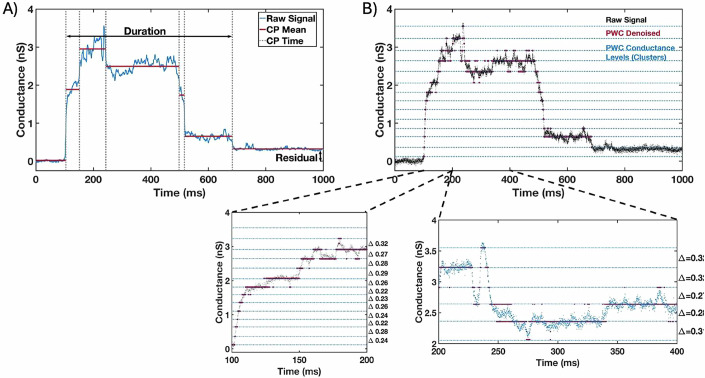
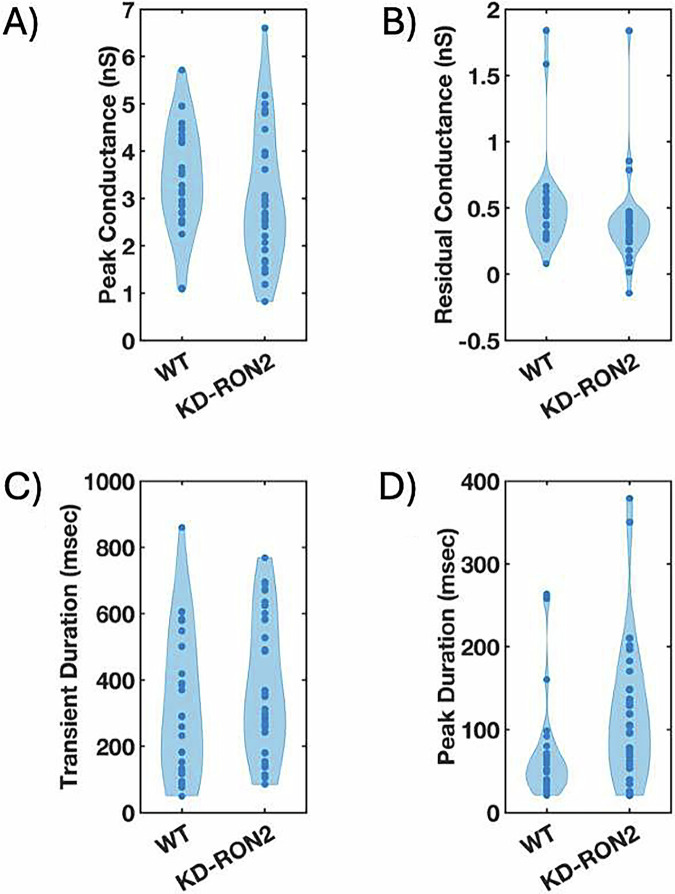
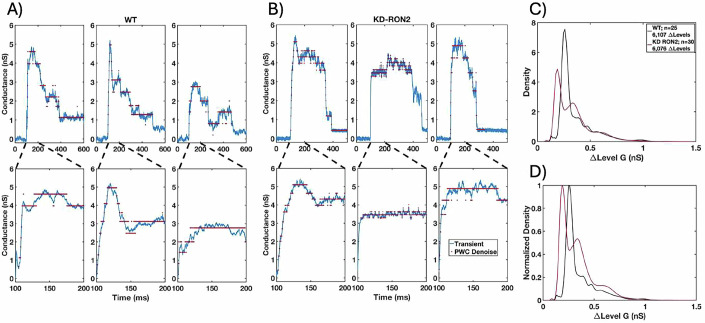
The parasite Toxoplasma gondii invades its host cell only after secreting proteins such as invasion-requisite RON2 that inserts into the host cell membrane to establish the moving junction. Electrophysiological recordings at sub-200 µs resolution show a transient increase in host cell membrane conductance following parasite exposure. Transients always precede invasion, but parasites depleted of RON2 generate transients without invading. Thus RON2 is not essential for transient generation. Time-series analysis developed here and applied to the 910,000 data point transient dataset reveal multiple quantal conductance changes in the parasite-induced transient, consistent with rapid insertion, then slower removal, blocking, or inactivation of potential pore components. Quantal steps for wild-type RH strain parasites have a principal mode with Gaussian mean of 0.26 nS, similar in step size to the pore forming protein EXP2, part of the PTEX translocon of malaria parasites. Without RON2 the quantal mean (0.19 nS) is significantly different. Because we observe no parasite invasion without poration, the term "invasion pore" is proposed to describe this transient breach in host cell membrane barrier integrity during invasion.

Keywords: Cell Membrane; Membrane Poration; Parasite; Rhoptry Secretion; Whole-Cell Patch-Clamp.


Conflict of interest statement

Disclosure and competing interests statement. The authors declare no competing interests.

Figures

Figure 1
Figure 1. Each invading T. gondii WT RH strain tachyzoite produces a single electrical transient.
(A) DIC microscopy of Toxoplasma invasion of COS1 cell under visible patch pipette (upper panel; 10 μm scale bar). Four parasites (P1–P4) invaded during the recording of a whole-cell patch-clamp electrophysiology experiment. White arrowheads indicate visible constrictions observed when parasites penetrate the host cell during invasion (middle panel: P1 and P2 invasions; lower panel: P3 and P4 invasions; 3 μm scale bar panels P1–P4). (B) Four transients were detected from the electrophysiological recording obtained under the whole-cell configuration (−60 mV holding potential) during the invasions of the four parasites. (C) Expanded time record of the transients (T1–T4) shown in B) for a clearer visualization of the waveform. Source data are available online for this figure.
Figure 2
Figure 2. T. gondii invasion pore formation does not require RON2, and thus does not require complete moving junction formation.
(A) Phenotype of untreated WT and KD-RON2 parasites evaluated using electrophysiology (G) or calcium assay (Ca2+) data sets. The data show the percentage of the parasites presented to the host cell that generated conductance or calcium transients. Errors are Wilson, two-tailed upper and lower 95% confidence intervals. The percentage of transients observed in KD-RON2 (G) and KD-RON2 (Ca2+) are not significantly different from WT (G) (two-proportion z-test, z = 0.8389, 1.227, p = 0.40, 0.22, respectively). (B) Conductance waveforms for WT (blue) and KD-RON2 strains (red) (mean, solid lines; 95% CI, shadings; n = 25, 30, respectively). Source data are available online for this figure.
Figure 3
Figure 3. Structure and analysis of a conductance transient induced by T. gondii prior to invasion.
(A) Representative change point analysis (CPA) of a transient waveform induced by a WT parasite. Time-dependent changes in conductance are represented by the gray dotted lines (CP Time) over a selected duration of 1 s. Characteristic features of the transient including the change point means (CP Mean, red), Duration, and Residual conductance (black arrows) are indicated. (B) Representative PWC analysis of the same transient in (A) showing the identified conductance levels (clusters) in blue. Expanded portions of the rising phase (100 ms) and a larger section of the transient (200 ms) are shown in the expanded plots. The changes in conductance between identified level sets (D) are indicated. The conductance changes from each set of transients were analyzed and used to identify the primary conductance change. Source data are available online for this figure.
Figure 4
Figure 4. The conductance transients induced by WT and KD-RON2 tachyzoites differ in peak duration but not in transient duration nor peak or residual conductance.
(AD) Violin plots comparing the waveform parameters obtained for WT (n = 25) and KD-RON2 parasites (n = 30): (A) peak conductance, (B) residual conductance, (C) transient duration, and (D) peak conductance duration. Note, in 4D the peak durations are different; bootstrap differences in the mean, alpha = 0.05; ANOVA, p = 0.034 without Box-Cox transformation; following Box-Cox transformation and Welch’s T-test for unequal variance, p = 5.69E-17. Source data are available online for this figure.
Figure 5
Figure 5. Evidence for quantal conductance levels from time series analysis of individual transient recordings.
Piecewise constant (PWC) filtering was used to analyze the time-dependent conductance changes observed during individual transients. Examples of three (A) WT-induced and (B) KD-RON2 transients analyzed using PWC filtering to calculate the distributions of conductance level changes. (C) Density distribution functions of combined transient conductance level changes (ΔLevel G) produced by WT and KD-RON2 strains (n = 25 and 30, respectively). (D) Peak normalized density of data presented in (C). Source data are available online for this figure.
Figure 6
Figure 6. Model for invasion pore formation during parasite invasion.
Invasion pore formation is triggered by rhoptry exocytosis (see companion paper, Male et al, 2025). Electrophysiological analysis supports multiple rather than single pore formation on the host cell membrane. The model depicted in this figure has pore-forming proteins emerging from the mouth of the fusion pore between the AV and parasite plasma membrane to incorporate into the underlying proximal host cell membrane. The parasite plasma membrane is orange and the host cell plasma membrane is green. While we think that it is likely that rhoptry proteins, perhaps after mixing with AV-resident proteins, have pore-forming activities, we cannot exclude the possibility that rhoptry proteins collaborate with resident host cell plasma membrane proteins to form the invasion pores.
Figure EV1
Figure EV1. Galleries of conductance transients induced by WT and cKD_TgRASP2 -ATc parasites.
(A) Gallery of 25 WT parasite conductance transients calculated from recorded current measured using −60 mV holding potential in an external buffer containing 2.0 mM CaCl2. The initial 100 ms of baseline is plotted prior to the detection of the transient. (B) Gallery of 25 WT parasite conductance transients calculated from recorded current measured using −60 mV holding potential in an external buffer containing 2.0 mM CaCl2. The initial 5 ms of baseline prior to the detection of the transient and the initial 105 ms of each recorded transient are plotted. (C) Gallery of ten WT parasite conductance transients in low external calcium, calculated from recorded current measured using −60 mV holding potential in an external buffer containing 0.1 mM CaCl2. The initial 100 ms of baseline is plotted prior to the detection of the transient. (D) Gallery of 10 WT parasite conductance transients in low external calcium, calculated from recorded current measured using −60 mV holding potential in an external buffer containing 0.1 mM CaCl2. The initial 5 ms of baseline prior to the detection of the transient and the initial 105 ms of each recorded transient are plotted. (E) Gallery of 26 cKD_TgRASP2 -ATc parasite conductance transients calculated from recorded current measured using −60 mV holding potential in an external buffer containing 2.0 mM CaCl2. The initial 100 ms of baseline is plotted prior to the detection of the transient. Because no ATc or solvent is applied, aside from the genetic alteration of the parasite, no change in the protein complement of this parasite line compared to WT is expected. (F) Gallery of 26 cKD_TgRASP2 -ATc conductance transients calculated from recorded current measured using −60 mV holding potential, showing the initial 105 ms of the transients. 5 ms of baseline is included prior to detection of the transient. Because no ATc or solvent is applied, aside from the genetic alteration of the parasite, no change in the protein complement of this parasite line compared to WT is expected.
Figure EV2
Figure EV2. Galleries of conductance transients induced by KD-RON2 parasites.
(A) Gallery of 30 KD-RON2 parasite conductance transients calculated from recorded current measured using −60 mV holding potential in an external buffer containing 2.0 mM CaCl2. The initial 100 ms of baseline is plotted prior to the detection of the transient. (B) Gallery of 30 KD-RON2 parasite conductance transients calculated from recorded current measured using −60 mV holding potential, showing the initial 105 ms of the transients in an external buffer containing 2.0 mM CaCl2. The initial 5 ms of baseline is plotted prior to the detection of the transient.
Figure EV3
Figure EV3. The same number of quantal units contributes to the conductance maxima of WT and KD-RON2 transients.
(A) Transformation of the mean transient conductance (Fig. 3A) using the peak quantal sizes for WT (0.26 nS) and KD-RON2 (0.19 nS), rounded to the nearest integer. (B) Violin plots of the number of quantal units at the maximum conductance of WT and KD-RON2 transients (n = 25 and 30, respectively).
Figure EV4
Figure EV4. Transients induced by WT parasites in low external calcium concentration (0.1 mM CaCl2) have similar properties to WT transients induced in regular LCIS (2.0 mM CaCl2; Fig. 3A).
The average waveform of low-calcium transients displays the characteristic fast rise to peak conductance and slower recovery to a new baseline (n = 10). The confidence interval (CI) is calculated for each point along the averaged transient.
Figure EV5
Figure EV5
Violin plot of pore diameters calculated from individual WT transient (n = 25) maximum conductance using a model for a cylindrical pore (see methods).

Update of

References

    1. Alexander DL, Mital J, Ward GE, Bradley P, Boothroyd JC (2005) Identification of the moving junction complesx of Toxoplasma gondii: a collaboration between distinct secretory organelles. PLoS Pathogens 2:0137–0149 - PMC - PubMed
    1. Aquilini E, Cova MM, Mageswaran SK, Dos Santos Pacheco N, Sparvoli D, Penarete-Vargas DM, Najm R, Graindorge A, Suarez C, Maynadier M et al (2021) An Alveolata secretory machinery adapted to parasite host cell invasion. Nat Microbiol 6:425–434 - PMC - PubMed
    1. Artimovich E, Jackson RK, Kilander MBC, Lin YC, Nestor (2017) MW PeakCaller: an automated graphical interface for the quantification of intracellular calcium obtained by high-content screening. BMC Neurosci 18:72 - PMC - PubMed
    1. Bansal D, Miyake K, Vogel SS, Groh S, Chen CC, Williamson R, McNeil PL, Campbell KP (2003) Defective membrane repair in dysferlin-deficient muscular dystrophy. Nature 423:168–172 - PubMed
    1. Besteiro S, Michelin A, Poncet J, Dubremetz JF, Lebrun M (2009) Export of a Toxoplasma gondii rhoptry neck protein complex at the host cell membrane to form the moving junction during invasion. PLoS Pathogens 5:e1000309 - PMC - PubMed

Substances

LinkOut - more resources