

Mapping multimorbidity cluster-specific intrinsic capacity impairment patterns and mortality risks in a community-dwelling aging population cohort
- PMID: 40974695
- PMCID: PMC12482628
- DOI: 10.1016/j.jnha.2025.100687
Mapping multimorbidity cluster-specific intrinsic capacity impairment patterns and mortality risks in a community-dwelling aging population cohort
Abstract
Background: Growing evidence indicate that chronic diseases have distinct clusters, each potentially influencing intrinsic capacity (IC) through unique pathological pathways. This raises two critical questions: (1) How do different multimorbidity clusters preferentially impact specific IC domains? (2) Which multimorbidity cluster would have the highest risk of mortality in individuals with IC impairment?
Methods: We used data from the China Health and Retirement Longitudinal Study (CHARLS), a nationally representative cohort study in China. Multimorbidity was defined as the presence of two or more chronic conditions. IC impairment was assessed across six domains: cognition, locomotion, vitality, psychology, hearing and vision. We identified multimorbidity clusters using latent class analysis (LCA). Logistic regression was used to evaluate the association between identified multimorbidity clusters and domain specific IC decline, while Kaplan-Meier analysis and cox regression analysis were used to assess the mortality risk.
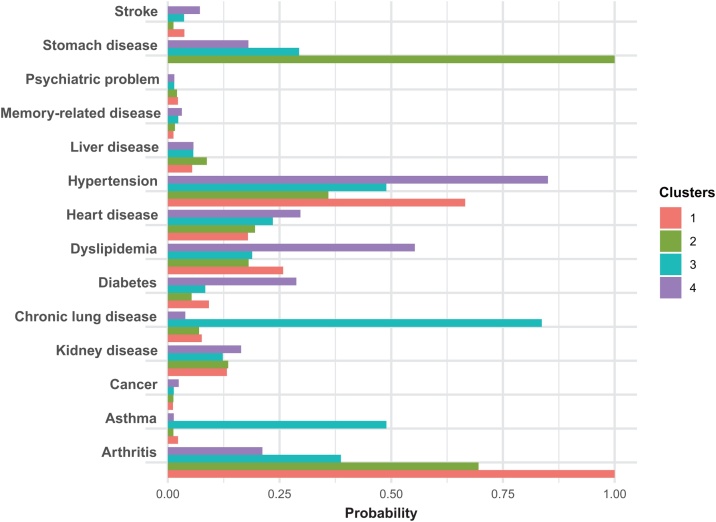
Results: Among the 4333 participants with multimorbidity, 48.6% were male, with mean age of 59.5 years. LCA method identified four distinct multimorbidity clusters: arthritis-metabolic (24.8%), stomach-arthritis (29.4%), respiratory (16.5%), metabolic-vascular (29.4%) clusters. Multimorbidity cluster-specific patterns of IC impairment revealed markedly elevated risks of decline in the cognitive, psychological, hearing, and vitality domains within the respiratory cluster. Similarly, the stomach-arthritis cluster was associated with significantly higher risks of impairment in the psychological, visual, hearing, and vitality domains. In contrast, the arthritis-metabolic cluster demonstrated significantly increased risks specifically in the cognitive and psychological domains. Survival analysis revealed significant mortality differences across multimorbidity clusters (p < 0.001). After multivariate adjustment, intrinsic capacity impairment remained significantly associated with increased mortality in the respiratory cluster (HR = 1.74, 95%CI:1.06-2.87, p = 0.029), demonstrating pattern-dependent prognostic value of IC.
Conclusions: Our findings revealed a significant heterogeneity in IC impairment patterns across different multimorbidity clusters, showing cluster-specific IC impairment and cluster-dependent risk of mortality according to IC impairment.
Keywords: Aging; Comorbidity; Disease cluster; Intrinsic capacity; Mortality risk; Multimorbidity cluster.
Copyright © 2025 The Authors. Published by Elsevier Masson SAS.. All rights reserved.
Conflict of interest statement
Declaration of competing interest The authors declare that they have no competing interests.
Figures


References
LinkOut - more resources
Full Text Sources
Research Materials
