. 2025 Aug 29;7(5):fcaf325.
doi: 10.1093/braincomms/fcaf325. eCollection 2025.

Polygenic scores contribution to Parkinson's disease comorbidities

Affiliations

Polygenic scores contribution to Parkinson's disease comorbidities

Carlos F Hernández et al. Brain Commun. .

Abstract

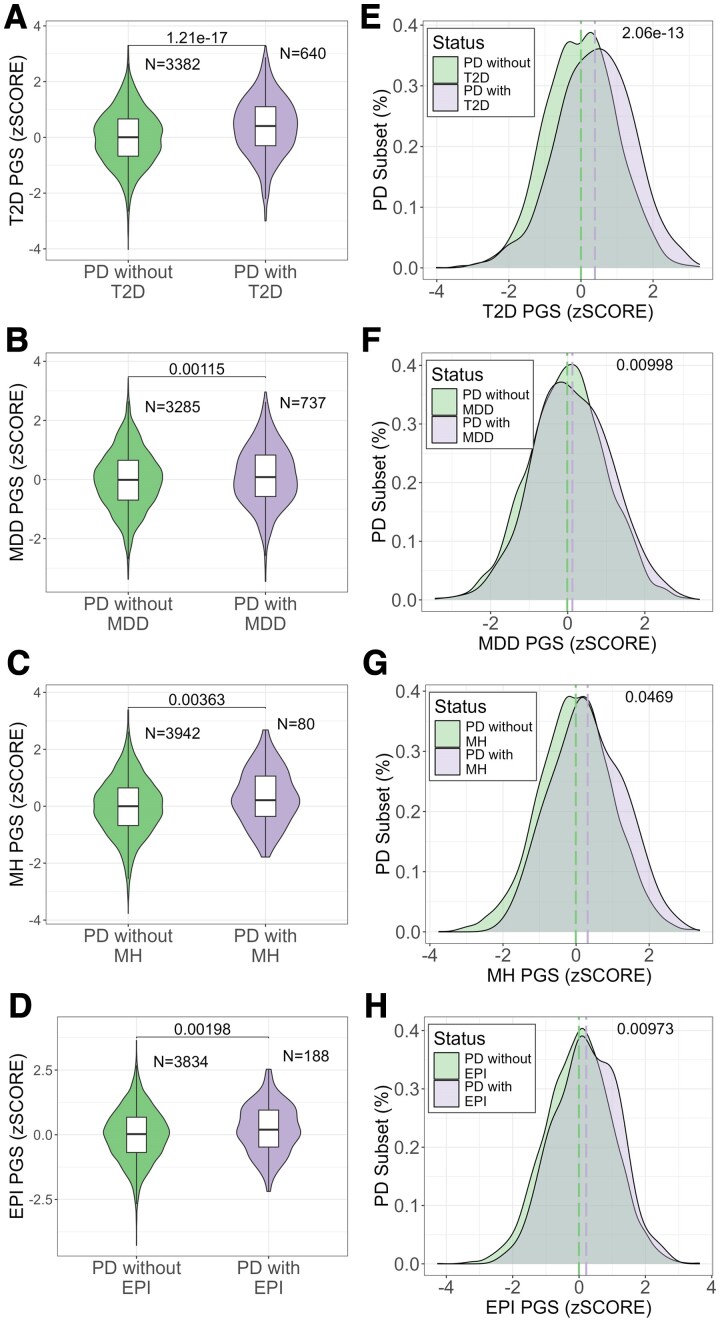
Comorbidities are common in Parkinson's disease and significantly impact the disease progression and management. While polygenic scores have been widely used to assess genetic risk for complex diseases, their role in comorbidity presentation in Parkinson's disease remains unclear. This study investigates whether genetic predisposition to comorbidities, as measured by polygenic scores, differs between individuals with Parkinson's disease and the general population and explores how genetic risk influences disease onset and sex-related differences. We analysed data from 4144 individuals with Parkinson's disease and 370 480 individuals from the general population in the UK Biobank, focusing on four comorbidities with high-quality genome-wide association study data: Type 2 diabetes, major depressive disorder, migraine headaches and epilepsy. We first compared polygenic score distributions between individuals with Parkinson's disease and the general population. While our findings indicate that comorbidities and polygenic risk scores do not significantly differ between individuals with Parkinson's disease and the general population, we show an association with disease onset and sex-specific differences. Individuals with earlier disease onset (50-70 years old) had higher genetic risk for major depressive disorder (odds ratio: 2.19, P-value: 1.27 × 10⁻¹⁵) and epilepsy (odds ratio: 1.58, P-value: 0.00845). Additionally, a female participant with Parkinson's disease exhibited higher genetic risk scores for major depressive disorder (odds ratio: 1.5, P-value: 0.0119) and migraine headaches (odds ratio: 2.1, P-value: 0.0155), while a male participant displayed higher genetic risk scores for Type 2 diabetes (odds ratio: 2.7, P-value: 2.11 × 10⁻¹⁷). Comorbidity-polygenic score did not differ between people with versus without Parkinson's disease, yet within Parkinson's disease, a higher genetic burden for specific comorbidities was linked to earlier onset and sex-specific presentation, implicating common variants as modifiers of clinical heterogeneity rather than the primary disease risk. These results enhance our understanding of the genetic influences shaping the broader clinical presentation of Parkinson's disease and highlight the need for further research into the interplay between genetic risk factors, comorbidities and disease heterogeneity.

Keywords: common variants; comorbidities; polygenic risk scores; polygenic scores.


Conflict of interest statement

The authors report that they do not have competing interests.

Figures

Graphical Abstract
Graphical Abstract
Figure 1
Figure 1
Study overview: schematic approach to assess the role of PGS associated with various comorbidities in shaping its manifestation within the context of PD. The methodology involves the analysis of type 2 diabetes, major depressive disorder, migraine headaches and epilepsy. The study explores the complex interaction between the genetic factors and the appearance of these comorbidities. By examining comorbidity-PGS profiles at different stages of PD onset and considering gender-specific patterns, the methodology aims to uncover insights into the nuanced genetic architecture that underlies the coexistence of PD and specific comorbidities.
Figure 2
Figure 2
Comorbidity-PGS in PD patients from the UK Biobank: (A–D) PGS comparison between PD and PD with (A) type 2 diabetes (n = 640, T = −8.74, P-value = 1.21 × 10⁻¹⁷), (B) major depressive disorder (n = 737, T = −3.26, P-value = 0.0115), (C) migraine headache (n = 80, T = −2.99, P-value = 0.00363), (D) epilepsy (n = 188, T = −3.13, P-value = 0.00198). P-values were obtained with the t-student test for group comparison. Each group shows the number of individuals included in each group. (E–H) PGS distribution between the PD only subset and PD with (E) type 2 diabetes (n = 640, D = 0.166, P-value = 2.06 × 10⁻¹³), (F) major depressive disorder (n = 640, D = 0.0663, P-value = 0.00998), (G) migraine headache (n = 640, D = 0.154, P-value = 0.0469), (H) epilepsy (n = 640, D = 0.122, P-value = 0.00973). The dashed lines indicate the mean for each group. The P-value was calculated with the Kolmogorov–Smirnov to compare the normal distribution between the groups.
Figure 3
Figure 3
Association of comorbidity-PGSs with the PD onset in individuals from the UK Biobank: (A) shows are the OR and the 95% confidence interval for PD comorbidities in the PD subset, 50–70 (lower line/dot) and >70 (upper line/dot) age at onset. The OR was obtained with a logistic regression for comorbidity using age, sex and the first four PC as covariates comparing 20% of high PGS with the rest of the group in each age interval. A total of 2352 PD cases with AAO > 70 and 1571 with AAO between 50 and 70 was included (T2D > 70: 417 cases, 50–70: 215; MDD > 70: 408, 50–70: 306; MH > 70: 45, 50–70: 31; EPI > 70: 108, 50–70: 75). (B–E) Prevalence of (B) type 2 diabetes, (C) major depressive disorder, (D) migraine headache, (E) epilepsy as a function of the onset of PD for PGS strata. Each point represents the percentage of individuals with the comorbidity at a given age of the PD onset. Curves are shown separately for the low PGS group (0–20%, blue, n = 785) and the high PGS group (80–100%, orange, n = 785). No statistical test was applied; this is a descriptive analysis.
Figure 4
Figure 4
Association of comorbidity-PGS with sex patterns. Shows are OR and 95% confidence interval, for PD comorbidities in PD patients analysed by sex (males as circles and females as triangles). OR was obtained using the logistic regression for comorbidities with age, sex and the first four PC as covariates compared to 20% of the high PGS groups. A total of 2466 males and 1457 females with PD were included (T2D: males 446 cases, females 186; MDD: males 401, females 292; MH: males 28, females 48; EPI: males 120, females 63).

References

    1. Pringsheim T, Jette N, Frolkis A, Steeves TDL. The prevalence of Parkinson’s disease: A systematic review and meta-analysis: PD PREVALENCE. Mov Disord. 2014;29(13):1583–1590. - PubMed
    1. Reed X, Bandrés-Ciga S, Blauwendraat C, Cookson MR. The role of monogenic genes in idiopathic Parkinson’s disease. Neurobiol Dis. 2019;124:230–239. - PMC - PubMed
    1. Santiago JA, Bottero V, Potashkin JA. Biological and clinical implications of comorbidities in Parkinson’s disease. Front Aging Neurosci. 2017;9:394. - PMC - PubMed
    1. Santos García D, Suárez Castro E, Expósito I, et al. Comorbid conditions associated with Parkinson’s disease: A longitudinal and comparative study with Alzheimer disease and control subjects. J Neurol Sci. 2017;373:210–215. - PubMed
    1. Leibson CL, Maraganore DM, Bower JH, Ransom JE, O’Brien PC, Rocca WA. Comorbid conditions associated with Parkinson’s disease: A population-based study: Comorbidity and Parkinson’s disease. Mov Disord. 2006;21(4):446–455. - PubMed

LinkOut - more resources