Is tumor shape associated with molecular diagnosis, extent of resection, or postoperative focal deficits in diffuse low-grade gliomas?
- PMID: 40980438
- PMCID: PMC12448425
- DOI: 10.1093/noajnl/vdaf138
Is tumor shape associated with molecular diagnosis, extent of resection, or postoperative focal deficits in diffuse low-grade gliomas?
Abstract
Background: This study aimed to explore the potential association between tumor shape, 1p/19q codeletion, EOR, and new postoperative focal deficits in patients with diffuse low-grade glioma.
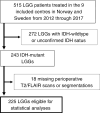
Methods: We analyzed data from 225 WHO grade 2 glioma surgeries performed in nine centers in Norway and Sweden. The tumor measurements were based on automatic segmentations of preoperative T2/FLAIR MRI scans by Raidionics. Contact surface area (CSA) was defined as the area between the tumor and brain parenchyma and was estimated by subtracting the surface area covered by the dura from the total surface area. The sphericity index (SI) was defined as the quotient of the tumor surface area and the surface area of a sphere with equal volume. Focal deficits were defined as any new motor, language, or visual deficits postoperatively.
Results: The univariable analyses showed that a larger CSA was associated with higher age (P = .02), lower EOR (P < .0001), and more focal deficits (P = .005) but not with 1p/19q codeletion (P = .54). A higher SI was associated with higher age (P = .02) and lower EOR (P < .0001) but not with focal deficits (P = .08) or 1p/19q codeletion (P = .90). The multivariable linear regression model supported the univariable associations between EOR and CSA (P = .0003) and SI (P = .0013), respectively. Contrarily, the logistic regression model showed that focal deficits were associated with SI (P = .014) but not with CSA (P = .056).
Conclusion: The tumor shape appears to be independently associated with EOR and new focal deficits but not with molecular diagnosis in patients with low-grade glioma.
Keywords: LGG; sphericity index; tumor shape; tumor size; tumor surface area.
© The Author(s) 2025. Published by Oxford University Press, the Society for Neuro-Oncology and the European Association of Neuro-Oncology.
Figures


References
-
- Tiefenbach J, Lu VM, Metzler AR, et al. The use of advanced neuroimaging modalities in the evaluation of low-grade glioma in adults: a literature review. Neurosurg Focus. 2024;56(2):E3. - PubMed
-
- Patel SH, Poisson LM, Brat DJ, et al. T2–FLAIR mismatch, an imaging biomarker for IDH and 1p/19q status in lower-grade gliomas: a TCGA/TCIA project. Clin Cancer Res. 2017;23(20):6078–6085. - PubMed
LinkOut - more resources
Full Text Sources
