. 2025 Jul 8;9(4):473-490.
doi: 10.1093/evlett/qraf014. eCollection 2025 Aug.

Continent-wide differentiation of fitness traits and patterns of climate adaptation among European populations of Drosophila melanogaster

Esra Durmaz Mitchell  1   2 Envel Kerdaffrec  1 Ewan Harney  3 Tânia F Paulo  4 Marija Savic Veselinovic  5 Marija Tanaskovic  6 Venera Tyukmaeva  7 Teresa Abaurrea Fernandez de Arcaya  8 Cansu Aksoy  9 Eliza Argyridou  10 Tiphaine P M Bailly  11 Dogus Can  9 Ezgi Cobanoglu  9 Nicola Cook  8 Seda Coşkun  9 Slobodan Davidovic  6 Ekin Demir  9 Tânia Dias  12   13 Somayeh Rasouli-Dogaheh  14 Pedro Duque  12   13 Katarina Eric  6 Pavle Eric  6 Priscilla Erickson  15   16 Filip Filipovski  5 Bettina Fishman  17 Amanda Glaser-Schmitt  10 August Goldfischer  18 Llewellyn Green  3 Sonia Janillon  19 Mihailo Jelic  5 Hristina Kostic  20 Lucas E Kreiman  21 Natacha Kremer  19 Manolis Lyrakis  22   23 Oleksandr M Maistrenko  24   25 Sapho-Lou Marti  26 Megan McGunnigle  8 Miriam Merenciano  3 Mário S Mira  11 Vincent Montbel  14   27 Laurence Mouton  19 Dmitry V Mukha  28 Siddharth Murali  29 Aleksandra Patenkovic  6 Oleksandra Protsenko  30   31 Florencia A Putero  32 Micael Reis  19 Natalia V Roshina  28   33 Olga Y Rybina  33 Mads F Schou  34 Thibault Schowing  1 Senel Selin Senkal  9 Svitlana Serga  31   35 Virginie Trieu  1 Alexander V Symonenko  33 Mikhail V Trostnikov  33 Evgenia A Tsybul'ko  33 Joost van den Heuvel  36 David van Waarde  36 Ekaterina R Veselkina  33 Cristina P Vieira  12   13 Xiaocui Wang  11 Jelle Zandveld  37 Jessica Abbott  38 Jean-Christophe Billeter  11 Hervé Colinet  26 Mehregan Ebrahimi  39 Patricia Gibert  19 Jan Hrcek  14   27 Maaria Kankare  40 Iryna Kozeretska  31 Volker Loeschcke  34 Julián Mensch  21 Banu Sebnem Onder  9 John Parsch  10 Elena G Pasyukova  33 Marina Stamenkovic-Radak  5 Eran Tauber  17 Cristina Vieira  19 Christian Wegener  41 Katja M Hoedjes  20   42 Bas J Zwaan  36 Andrea J Betancourt  43 Claudia Fricke  44 Sonja Grath  10 Nico Posnien  29 Jorge Vieira  12   13 Martin Kapun  45   46 Christian Schlötterer  22 Paul Schmidt  18 Élio Sucena  4   47   48 Josefa González  49 Alan Bergland  15 Michael G Ritchie  8 Thomas Flatt  1
Affiliations

Continent-wide differentiation of fitness traits and patterns of climate adaptation among European populations of Drosophila melanogaster

Esra Durmaz Mitchell et al. Evol Lett. .

Abstract

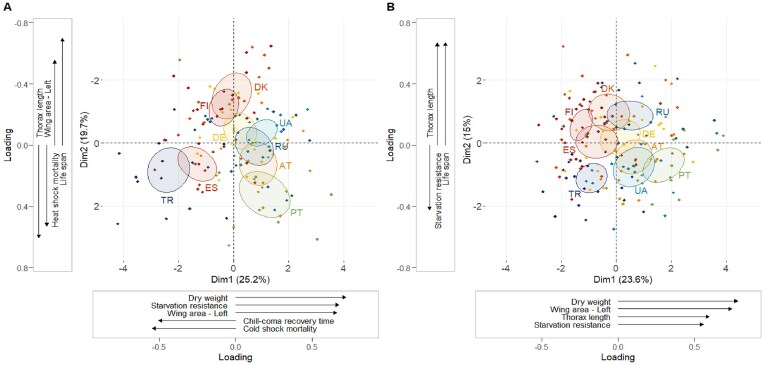
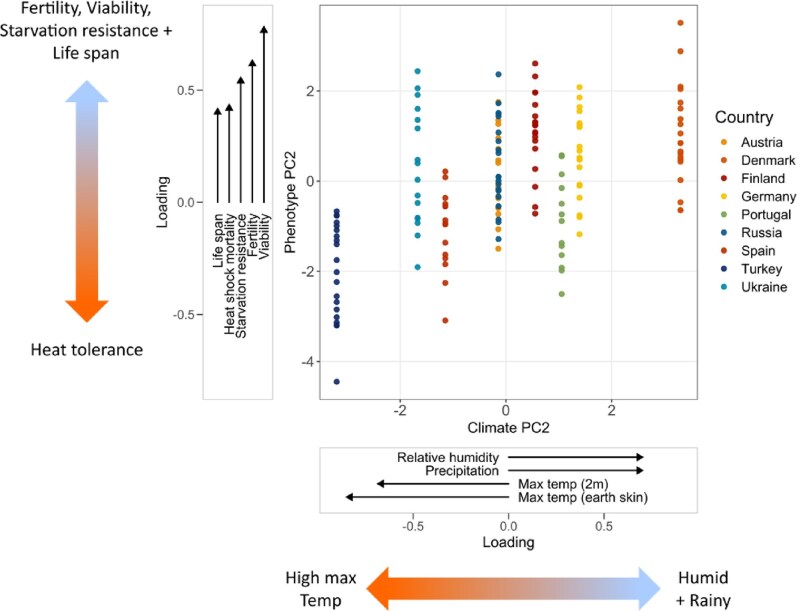
A particularly well-studied evolutionary model is the vinegar fly Drosophila melanogaster, a cosmopolitan insect of ancestral southern-central African origin. Recent work suggests that it expanded out of Africa ∼9,000 years ago, and spread from the Middle East into Europe ∼1,800 years ago. During its global expansion, this human commensal adapted to novel climate zones and habitats. Despite much work on phenotypic differentiation and adaptation on several continents (especially North America and Australia), typically in the context of latitudinal clines, little is known about phenotypic divergence among European populations. Here, we sought to provide a continent-wide study of phenotypic differentiation among European populations of D. melanogaster. In a consortium-wide phenomics effort, we assayed 16 fitness-related traits on a panel of 173 isofemale lines from 9 European populations, with the majority of traits measured by several groups using semi-standardized protocols. For most fitness-related traits, we found significant differentiation among populations on a continental scale. Despite inevitable differences in assay conditions among labs, the reproducibility and hence robustness of our measurements were overall remarkably good. Several fitness components (e.g., viability, development time) exhibited significant latitudinal or longitudinal clines, and populations differed markedly in multivariate trait structure. Notably, populations experiencing higher humidity/rainfall and lower maximum temperature showed higher viability, fertility, starvation resistance, and lifespan at the expense of lower heat-shock survival, suggesting a pattern of local adaptation. Our results indicate that derived populations of this tropical fly have been shaped by pervasive spatially varying multivariate selection and adaptation to different climates on the European continent.

Keywords: D. melanogaster; Europe; adaptation; fitness traits; phenotypic variation; population differentiation.


Conflict of interest statement

The authors declare no conflict of interest. Note: After February 24, 2022, no collaborative actions or exchanges have taken place between Ukrainian and Russian scientists within our project.

Figures

Figure 1.
Figure 1.
(A) Map of the nine locations where European populations of Drosophila melanogaster were sampled by the DrosEU consortium. PT, Portugal (Recarei = RE); ES, Spain (Gimenells = GI [Lleida]); TR, Turkey (Yesiloz = YE); DE, Germany (Munich = MU); AT, Austria (Mauternbach = MA); UA, Ukraine (Uman = UM); DK, Denmark (Karensminde = KA); FI, Finland (Akaa = AK); and RU, Russia (Valday = VA) (see Supplementary Table S1 and our GitHub website; also see Kapun et al., 2020, 2021). (B) Map showing the locations of the labs that contributed to phenotyping, an effort involving >100 researchers in 26 groups in 17 countries. Lines were maintained by É. Sucena (Instituto Gulbenkian de Ciência, Oeiras, Portugal) and shipped to recipient labs for phenotyping (Table 1; see also Supplementary Table S2).
Figure 2.
Figure 2.
Phenotypic differentiation among European populations of Drosophila melanogaster and reproducibility of trait measurements. (A) Percentage of phenotypic variance explained by sampling location (R2 = variance explained by the fixed-effect factor Population), for each trait (and sex, where applicable). Each dot represents the R2 value extracted from each of the 97 individual linear models. (95 dots represent marginal R2 values from linear mixed models; for two trait measurements [viability measured by the PS lab; locomotor activity ‒ absolute phase, measured by the ET lab], we used simple linear models and extracted regular R2 values.) Colored dots represent significant model p-values (⍺ = 0.05). Note that circadian eclosion timing was not analyzed using a linear modeling approach and is not shown here (see Supplementary Sections 1.6 and 2). (B) Pairwise Pearson’s correlation coefficients (r) between isofemale trait values for the same phenotype estimated by different (pairs of) labs that had measured the same trait, using line coefficients extracted from linear models. Colored dots show significant correlations (⍺ = 0.05). Traits that were only measured by a single lab are not shown. (C) Results of the meta-analyses for the effect of “Population,” showing (among-population) heterogeneity (Cochran’s Q statistic), extracted from subgroup meta-analyses based on population estimates from linear models. Colored dots represent significant differences between subgroups (= populations) after Bonferroni correction (α’ = α/n = 0.05/26 = 0.0019). As in (B), traits measured in single labs (as well as thorax length in males) did not enter these analyses. For further details, see the Supplementary Materials.
Figure 3.
Figure 3.
Principal component analysis (PCA) plots and loadings for the first principal component (PC1) and the second principal component (PC2) in (A) males and (B) females. The same nine phenotypic traits were used in both PCAs. Confidence ellipses (95%) are drawn for each of the nine populations. Phenotypic traits with greater-than-average contributions (loadings) to a given principal component are shown in the accompanying x- and y-axis vector plots. Note that in males, the y-axis (PC2) is inverted so that the direction of phenotypic trait correlations matches across the two sexes. For further details, see the Supplementary Materials; also see Website Section 2.8.
Figure 4.
Figure 4.
Correlation between phenotype principal component 2 and climate principal component 2, using all female phenotypic traits plus viability, and climatic data from the previous 30 years. Climatic and phenotypic variables with greater-than-average contributions (loadings) to a given principal component are shown in the accompanying x- and y-axis vector plots, respectively. For the corresponding results on males, which look qualitatively similar but were not significant after permutation testing, see Website Section 2.12  for details.

References

    1. Ackermann M., Bijlsma R., James A. C., Partridge L., Zwaan B. J., Stearns S. C. (2001). Effects of assay conditions in life history experiments with Drosophila melanogaster . Journal of Evolutionary Biology, 14:(2), 199–209. 10.1046/j.1420-9101.2001.00281.x - DOI
    1. Adrion J. R., Hahn M. W., Cooper B. S. (2015). Revisiting classic clines in Drosophila melanogaster in the age of genomics. Trends in Genetics, 31, 434–444. 10.1016/j.tig.2015.05.006 - DOI - PMC - PubMed
    1. Agis M., Schlötterer C. (2001). Microsatellite variation in natural Drosophila melanogaster populations from New South Wales (Australia) and Tasmania. Molecular Ecology, 10, 1197–1205. 10.1046/j.1365-294X.2001.01271.x - DOI - PubMed
    1. Anderson A. R., Collinge J. E., Hoffmann A. A., Kellett M., McKechnie S. W. (2003). Thermal tolerance trade-offs associated with the right arm of chromosome 3 and marked by the hsr-omega gene in Drosophila melanogaster. Heredity, 90, 195–202. 10.1038/sj.hdy.6800220 - DOI - PubMed
    1. Arguello J. R., Laurent S., Clark A. G. (2019). Demographic history of the human commensal Drosophila melanogaster. Genome Biology and Evolution, 11, 844–854. 10.1093/gbe/evz022 - DOI - PMC - PubMed