. 2025 Aug 14;5(1):ycaf137.
doi: 10.1093/ismeco/ycaf137. eCollection 2025 Jan.

Temperature-driven biogeography of marine giant viruses infecting picoeukaryotes Micromonas

Affiliations

Temperature-driven biogeography of marine giant viruses infecting picoeukaryotes Micromonas

David Demory et al. ISME Commun. .

Abstract

Climate shapes the biogeography of microbial and viral communities in the ocean. Among abiotic factors, temperature is one of the main drivers of microbial community distribution. However, we lack knowledge on how temperature shapes the life history traits, population dynamics, and the biogeography of marine viruses. This study integrates mathematical modeling with in situ observations to investigate the temperature-driven biogeography of marine viruses. We focused on prasinoviruses, a group of giant viruses that infect the picoeukaryote Micromonas, a widespread phytoplankton with thermotypes adapted from poles to tropics. Analyzing the Tara Oceans and Polar Circle databases, we found that temperature is the primary determinant of Micromonas virus (MicV) distribution in the surface ocean. Phylogenetic reconstruction of MicVs revealed that these viruses form several groups with cryophile or cryo-mesophile preferences. We applied a mechanistic model to describe temperature-driven population dynamics, allowing us to predict the global presence and absence of MicVs. The probability of lysis and the probability of infection emerged as reliable predictors of MicV distribution, indicating that temperature-driven cellular mechanisms significantly shape viral community structure and distribution in the global oceans.

Keywords: Micromonas; TARA; biogeography; ecological modeling; marine viruses; phytoplankton; temperature.


Conflict of interest statement

None declared.

Figures

Figure 1
Figure 1
Environmental descriptors of MicV community distribution in global surface ocean. A) Location map of Tara Oceans expedition samples. B) Relative frequencies of MicV within the NCLDV (Nucleocytoplasmic Large DNA Viruses) community as function of latitude of the sample sites. C) Principal coordinate analysis (PCoA) with Bray–Curtis dissimilarity of the MicV communities. Ellipses represent the 75formula image and 95formula image CI of the centroids, respectively. D) Goodness of fit (formula image) of linear model of the first coordinate of PCoA vs. environmental variables: Chlorophyll a (chla), Mixed Layer Depth (MLD), Nitrates/Nitrites (N), Phosphates (P), Salinity (S), Silicates (Si), Temperature (T), and depth (z). E) Linear model of the first coordinate of PCoA vs. temperature. PCoA loadings can be found in Supplementary Table S3.
Figure 2
Figure 2
Relation between thermal distribution and MicV phylogeny. A) Phylogenetic affiliations of environmental MicVs. Reference and environmental PolB sequences are shown in triangle and circle marks, respectively, at the first layer. Environmental sequences placed on other virus lineages were removed from the analysis and shown in open circles in this plot. Box plots in the second and third layers represent the temperature range where each phylotype exists and the relative frequency, respectively. The outside layer indicates the phylogenetic positions of MicV strains having clade information. B) Relative frequency of MicV subclades as function of temperature. C) Optimal temperature of MicV subclades distributions. Boxplot edges are the 25formula image and 75formula image quantiles, horizontal black lines are the means, white circle are the medians, and the vertical black lines are the 5formula image and 95formula image quantiles. D) Distribution of MicV subclades across environmental gradients of chlorophyll A concentration and temperature at isolation sites. Ellipses represent the 95formula image and 99formula image CI of the centroids for each subclades. Data points in B) and D) represent individual values.
Figure 3
Figure 3
Inference of a geographical association-derived virus–host interaction network. A) Network is color-coded by the optimal temperatures of viruses (circle) and hosts (square). Edge width and node size indicate correlation coefficient and degree (i.e. the number of connections), respectively. B) Relationship between the optimal temperatures of host–host (formula image), virus–host (formula image), and virus–virus (formula image) pairs having positive associations in the network. All edge types (node category combinations) represent significant positive correlations at formula image.
Figure 4
Figure 4
ROC analysis using the probability of lysis and of infection and the proportion of infectious produced virions estimated from mathematical modeling for MicV groups A) A, B) B, C) C, and D) Pol. Left panels are the ROC curves for probability of lysis (colored solid line), probability of infection (colored medium-dashed line) and proportion of infectious produced virions (colored small-dashed line). Vertical and horizontal dashed black lines are the 70formula image threshold of Specificity and Sensitivity. Gray 1:1 curve represents models that cannot distinguish between presence and absence in data. Right panels are ROC statistics with Accuracy (how many positive and negative observations are correctly classified), Precision (how many positive estimations are actually positive), Recall or Sensitivity (how many positive observations are classified correctly), F1 score (harmonic mean of precision and recall), and AUC (area under the curve)—see Methods for more details.
Figure 5
Figure 5
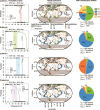
Model estimation of MicV global distribution based on the probability of lysis for MicV groups A) Clade A, B) Clade B, C) Clade C, and D) Clade Pol. Left panels are the probability of lysis (solid line) as function of temperature. Black dots are Tara presence and absence data. We considered presence when the relative frequency of each group is positive and absence when it is null. Vertical dashed black and colored lines are the temperature threshold estimated using formula image and probability of lysis. Shaded areas represent the threshold temperature for the optimum sensitivity (Sen) and specificity (Spe) with 70formula image Sen—70formula image Spe for group A, 80formula image Sen—80formula image Spe for groups B and Pol, and 50formula image Sen—60formula image Spe for group C. Middle panels are the global map estimation of presence and absence of MicV groups. Gray areas are the presence regions estimated with the best threshold for the probability of lysis. Dots are Tara samples with colors based on their classification: True Positive (TP–green), True Negative (TN–blue), False Positive (FP–orange), and False Negative (FN–yellow). Right panels are the classification percentage for TP (green), TN (blue), FP (orange), and FN (yellow). formula image is the total number of Tara samples, formula image is the number of Tara samples that have presence observations, and formula image is the percentage of good estimation of presence and absence (TP+TN) by our model.

References

    1. Suttle CA. Marine viruses—major players in the global ecosystem. Nat Rev Microbiol 2007;5:801–12. 10.1038/nrmicro1750 - DOI - PubMed
    1. Simon R, Brum Jennifer R, Dutilh Bas E et al. Ecogenomics and potential biogeochemical impacts of globally abundant ocean viruses. Nature 2016;537:689–93. 10.1038/nature19366 - DOI - PubMed
    1. Wilson WH, Van Etten JL, Allen MJ. The Phycodnaviridae: the story of how tiny giants rule the world. Lesser Known Large dsDNA Viruses .2009:1–42, Berlin, Heidelberg, Springer Berlin Heidelberg, 10.1007/978-3-540-68618-7_1. - DOI - PMC - PubMed
    1. Chantal A, Matthieu L, Jean-Michel C. The rapidly expanding universe of giant viruses: Mimivirus, Pandoravirus, Pithovirus and Mollivirus. FEMS Microbiol Rev 2015;39:779–96. 10.1093/femsre/fuv037 - DOI - PubMed
    1. Brussaard Corina PD. Viral control of phytoplankton populations—a review. J Eukaryot Microbiol 2004;51:125–38. 10.1111/j.1550-7408.2004.tb00537.x - DOI - PubMed

LinkOut - more resources