. 2025 Sep 16;13(3):195.
doi: 10.3390/medsci13030195.

Mast Cell Association with the Microenvironment of a Phosphaturic Mesenchymal Tumour Secreting Fibroblast Growth Factor 23

Affiliations

Mast Cell Association with the Microenvironment of a Phosphaturic Mesenchymal Tumour Secreting Fibroblast Growth Factor 23

Andrey Kostin et al. Med Sci (Basel). .

Abstract

Background: Phosphaturic mesenchymal tumours secreting fibroblast growth factor 23 (hereinafter referred to as FGF23+ PMT) are rare neoplasms that can cause hypophosphataemic osteomalacia, owing to excessive FGF23 production. Mast cells (MCs) play a key role in tumour biology by modulating proliferative activity of atypical cells, resistance to innate and acquired immunity, angiogenesis, and metastatic behaviour. However, MCs associated with FGF23+ PMT have not previously been investigated. This study, to our knowledge, is the first to characterise features of the tumour microenvironment through spatial phenotyping of the immune and stromal landscape, together with histotopographic mapping of intercellular MC interactions with other subcellular populations in FGF23+ PMT. Methods: Histochemical staining (haematoxylin and eosin, toluidine blue, Giemsa solution, picro-Mallory protocol, silver impregnation), as well as monoplex and multiplex immunohistochemical staining with spatial phenotyping, were performed to detect atypical FGF23-secreting cells, immune cells (CD3, CD4, CD8, CD14, CD20, CD38, CD68, or CD163), stromal components (CD31, α-SMA, or vimentin), and specific MC proteases (tryptase, chymase, or carboxypeptidase A3). Bioinformatics analysis using artificial intelligence technologies was applied for spatial profiling of MC interactions with tumour, immunocompetent, and stromal cells in the tumour microenvironment. Results: Bioinformatic analysis of the entire tumour histological section, comprising over 70,000 cells stained using monoplex and multiplex immunohistochemical protocols, enabled identification of more than half of the cell population. The most abundant were CD14+ (30.7%), CD163+ (23.2%), and CD31+ (17.9%) cells. Tumour-associated MCs accounted for 0.7% of the total pool of immunopositive cells and included both mucosal and connective tissue subpopulations, predominantly of the tryptase + chymase-CPA3-specific protease phenotype. This pattern reflected combined multidirectional morphogenetic processes in the patient's FGF23+ PMT. More than 50% of MCs were colocalized with neighbouring cells of the tumour microenvironment within 20 μm, most frequently with monocytes (CD14+CD68+), M2 macrophages (CD68+CD163+), and endothelial cells (CD31+). In contrast, colocalization with atypical FGF23-secreting cells was rare, indicating minimal direct effects on tumour cell activity. Interaction with T lymphocytes, including CD8+, was also infrequent, excluding their activation and the development of antitumour effects. Mapping of MC histotopography validated the hypothesis of their inductive role in monocyte differentiation into M2 macrophages and probable polarisation of macrophages from M1 into M2, thereby contributing to slow tumour growth. MCs were further involved in extracellular matrix remodelling and participated in the formation of pro-osteogenic niches within the FGF23+ PMT microenvironment, leading to pathological osteoid development. Conclusions: This study demonstrated active MC participation in the evolution of the FGF23+ PMT microenvironment. The findings may be applied in translational medicine to develop novel algorithms for personalised therapy in patients with FGF23-secreting tumours, offering an alternative when surgical removal of the tumour is not feasible.

Keywords: carboxypeptidase A3; chymase; extracellular matrix; immune landscape; intercellular interaction; mast cells; multiplex immunohistochemistry; phosphaturic mesenchymal FGF23-secreting tumour; spatial phenotyping; tryptase; tumour microenvironment.


Conflict of interest statement

The authors declare that there are no conflicts of interest that could be perceived as prejudicing the impartiality of this article.

Figures

Figure 1
Figure 1
Phosphaturic mesenchymal tumour secreting fibroblast growth factor 23: positron emission tomography/computed tomography (PET/CT) and gross visualization images. (A) 68Ga-DOTATATE PET/CT showing a 2 cm soft tissue tumour, positive for somatostatin receptor, located in the subcutaneous adipose tissue of the inguinal region (arrow). (B) Gross specimen of the excised tumour (arrow).
Figure 2
Figure 2
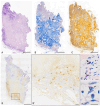
General view of the FGF23-secreting tumour. Techniques: (AC) Histochemical staining with hematoxylin and eosin (A), picro-Mallory (B), Giemsa (E,F), and silver impregnation (C). (D) Immunohistochemical staining of mast cells (MCs) for tryptase. (D’) Enlarged fragment of (D), showing localisation of mast cells at the periphery of osteo-like formations. (E) Connective tissue MCs with high (arrow) and low (double arrowed) activity of secretory granules transfer into the extracellular matrix. (F) Small MCs with morphological features of the mucosal subpopulation (arrow). Scale bars: (E,F) = 10 μm; (D’) = 100 μm; others = 1000 μm.
Figure 3
Figure 3
Features of osteo-like material and collagen fibrillogenesis in an FGF23-secreting tumour. Techniques: (A) Haematoxylin and eosin staining. (B,C) Picro-Mallory staining. (D,E) Silver impregnation. (F,G) Picrosirius red staining with polarisation microscopy. Notes: (A) Bone tissue with signs of sinus resorption of bone trabeculae and proliferation of loose connective tissue with vascular proliferation (arrow). (B,D) Pathological regeneration of bone tissue in the form of deformed layers of compact substance (arrow). (C) Locus of the tumour microenvironment with osteolytic outgrowths. (E) Tumour areas with high content of reticular fibers (arrow) and randomly oriented platelets of ossein fibrils with type I collagen in the background (double arrow). (F) Abnormal arrangement of osteoid as alternating bone plates with different directions of ossein fibrils and a predominant content of type I collagen (arrow). Minor areas of the tissue microenvironment rich in type III collagen, appearing as thin disordered fibers are found adjacent (double arrow). (G) Type I collagen in atypical plates of varying density and orientation of osteoid (double arrow) co-localising in the tumour microenvironment with extensive areas of type III collagen accumulation in thin, randomly oriented fibers (arrow). (H) Abnormal arrangement of bone plates, with one plate disrupting the spatial orientation of others (arrow). (I) Disordered arrangement of atypical bone plates with a predominant content of type I collagen within ossein fibrils. (J) Locus of the tumour microenvironment with chaotic arrangement of bone plates containing type III collagen within ossein fibrils (arrow). Scale bars: (HJ) = 10 μm; others = 50 μm.
Figure 4
Figure 4
Morphology of FGF23+ cells in the tumour. (A) Diffuse arrangement of FGF23+ cells in the tumour. (A’) Three-dimensional (3D) model of an elongated FGF23+ cell (video presented in Supplementary S1). (A”) Enlarged view of (A) showing a likely multinucleated FGF23+ cell (arrow). (B) Formation of small islands of FGF23+ cells (arrow). (B’) 3D model of an enlarged (B) fragment showing an FGF23+ cell with outgrowths (arrow); video is presented in Supplementary S2. (C) Cluster of FGF23+ cells with variable morphology. (D) Co-localisation of two mast cells (arrow), one with a prolonged cytoplasmic outgrowth, together with an atypical FGF23+ tumour cell (double arrow). (EG) Giemsa staining showing variants of atypical outgrowth-like cells (presumably, arrow). Scale bars: (A,B) = 50 µm; others = 5 µm.
Figure 5
Figure 5
Profiles of immune and stromal cells in the FGF23-secreting tumour microenvironment. (A) Ratio of all phenotyped cells to other cells (%). (A’) Relative proportion of immunopositive cells to the total number of tumour cell populations (%). (B) Profiling of cell phenotypes within the total pool of immunopositive cells (%). (C) Profile of different phenotypes of tumour microenvironment-associated mast cells (%).
Figure 6
Figure 6
Mast cell (MC)-specific proteases in the regulation of the FGF23-secreting tumour microenvironment. (A) Predominant localisation of MCs at the tumour periphery. (B,C) Localisation of single MC and their derivatives in the central region of the FGF23+ PMT, in close contact with the osteo-like extracellular matrix. (B’,C’) Enlarged fragments of (B) and (C), respectively, showing active release of tryptase from autonomous MC granules ((B’), arrow) and from the MC via exosomal transport ((C’), arrow). (D) Active tryptase secretion spreading over paracrine distances to extracellular matrix targets (arrow). (E) Tryptase secretion to the basement membrane of capillary endothelial cells in the tumour microenvironment (arrow); its direction towards targets may be guided by nanotube formation (presumably). (F,G) Regulation of the tissue microenvironment by tryptase secretion simultaneously affecting several cells of the tumour microenvironment (arrow). (H) Use of transgranulation mechanism for tryptase secretion to targets in the local tissue microenvironment (arrow). (I) Interaction of MCs with stromal cells in the tumour microenvironment (presumably, arrow). (J) Effect of MC tryptase on lymphocytes of the tumour microenvironment (arrow) and on fibroblast (double arrow). (K) Contact of MCs with fibroblast during tryptase secretion (arrow). (L) Preferential localisation of tryptase in large secretory granules. (M) CPA3-positive granules localised in the cytoplasm of elongated MCs with a cytoplasmic outgrowth of considerable length (arrow). A large cytoplasmic fragment of the MC filled with granules is also visible (double arrow). (N) Secretion of individual large CPA3+ granules into the intercellular matrix (arrow). (O,P) Secretion of carboxypeptidase A3, which can be selectively transported to loci of the tissue microenvironment at paracrine distances (arrow). (Q,R) Variants of intracellular MC chymase accumulation in large secretory granules, subsequently secreted into the extracellular matrix (arrow). Scale bar: (AC) = 50 μm; others = 5 μm.
Figure 7
Figure 7
Cytotopography of tryptase and carboxypeptidase A3 in mast cells associated with FGF23-producing tumours. Technique: diplex immunohistochemical detection of tryptase (labelled with Alexa Fluor 488) and CPA3 (labelled with Alexa Fluor 594). (A) Predominant accumulation of specific proteases in secretory granules filling the cytoplasm, with peripheral intragranular co-localisation (arrow). Secretion of granules containing different levels of specific proteases is also observed (double arrow). (B) 3D models of the cytotopography of specific mast cell proteases in (A), with simultaneous (B) and separate (B’,B”) visualisation of tryptase and carboxypeptidase A3, are presented in Supplementary S3A, S3B, and S3C, respectively.
Figure 8
Figure 8
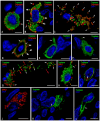
Visualisation of specific protease profiling in mast cells (MCs) associated with FGF23-producing tumour. Technique: (AF) Diplex immunohistochemical detection of tryptase and chymase (labelled with Alexa Fluor 488 and Alexa Fluor 647, respectively), (GL) diplex immunohistochemical detection of tryptase and CPA3 (labelled with Alexa Fluor 488 and Alexa Fluor 594, respectively). (A) A round MC with the Tryptase+Chymase+ phenotype secreting single chymase-positive granules (arrow). The 3D model is presented in Supplementary S4. (B) An elongated MC containing both tryptase and chymase. Active secretion of granules with the Tryptase-Chymase+ (arrow) and Tryptase+Chymase+ (double arrow) phenotypes is observed. The 3D model is presented in Supplementary S5. (C) Evidences of active MC degranulation with transfer of autonomous secretory granules (arrow) to the pathological osteoid region of the tumour microenvironment. The 3D model is presented in Supplementary S6. (D) Predominant mechanism of transgranulation in the delivery of tryptase and chymase to tumour microenvironment targets (arrow), with preserved secretion of individual granules (double arrow). The 3D model is presented in Supplementary S7. (E,F) MCs with the Tryptase+Chymase- phenotype (mucosal subpopulation) showing a small cytoplasm, with signs of forming large cytoplasmic outgrowths ((E), arrow) and nanotubules ((F), arrow) for the delivery of secretory products to tissue microenvironment targets. (G) Extensive MC degranulation with dissemination of secretory granules of various phenotypes in the area of pathological osteoid, including Tryptase+CPA3+ (white arrow), Tryptase+CPA3- (green arrow), and Tryptase-CPA3+ (red arrow). The 3D model is presented in Supplementary S8. (H) Tumour-associated MCs containing specific proteases in mature granules with signs of secretion into the extracellular matrix. (I) Tryptase and CPA3 localisation in immature secretory granules; CPA3 containing progranules are identified (arrow). (J) A MC with the Tryptase-CPA3+ phenotype; the cytoplasm is filled with granules containing carboxypeptidase A3. (K,L) MCs with the Tryptase-CPA3+ phenotype forming outgrowths of varying thickness and length to provide intercellular communication (arrow).
Figure 9
Figure 9
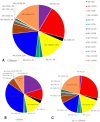
Spatial profiling of intercellular interactions (co-localisation) of tryptase-positive mast cells (MCs) with atypical, immunocompetent, and stromal cells of the FGF23-producing tumour microenvironment (in %, based on bioinformatics analysis of the entire section image). (A) Frequency of MC co-localisation with other cells of the FGF23-producing tumour microenvironment within the integral range of intertarget distances from 0 to 20 μm. (B,C) Frequency of MC co-localisation with other cellular targets of the tumour microenvironment within the ranges of 0 to 10 μm (B) and 10 to 20 μm (C). Explanations are provided in the text.
Figure 10
Figure 10
Mapping of tryptase-positive mast cells (MCs) in the immune and stromal landscape of the FGF23-producing tumour microenvironment. Technique: multiplex immunohistochemical staining of MC tryptase with CD3 (AC), CD8 (DF), CD31 (GI), and CD163 (JL). (A) Spatial phenotyping of MCs and T lymphocytes. (A’) Enlarged view of (A). (B,C) Juxtacrine ((B), arrow, 3D model presented in Supplementary S9) and paracrine (C) interactions of MCs and CD3+ lymphocytes. (D) Spatial phenotyping of MCs and cytotoxic T lymphocytes. (D’) Enlarged view of (D). (E) Direct contact between MCs and CD8+ lymphocytes (arrow). The 3D model is presented in Supplementary S10. (F) Paracrine co-localisation of MCs and T-killer. The 3D model is presented in Supplementary S11. (G) Spatial mapping of MCs and endothelial cells in the tumour microenvironment, showing intensive development of the microvasculature. (G’) Enlarged fragment of (G). (G’,H) Close MC co-localisation with endothelium. (I) Signs of tryptase secretion to the basement membrane and cytoplasm of endothelial cells (arrow). The 3D model is presented in Supplementary S12. (J) Histotopography of MC-M2 macrophage co-localisation. (J’) Enlarged fragment of (J). (K) High content of CD163+ macrophages in the tumour microenvironment. (L) Contact between MCs and M2 macrophages (arrow). The 3D model is presented in Supplementary S13. Scale bars: (A,D,G,J) = 1000 µm; (H,K) = 50 µm; others = 5 µm.

References

    1. Folpe A.L., Fanburg-Smith J.C., Billings S.D., Bisceglia M., Bertoni F., Cho J.Y., Econs M.J., Inwards C.Y., Jan de Beur S.M., Mentzel T., et al. Most osteomalacia-associated mesenchymal tumors are a single histopathologic entity: An analysis of 32 cases and a comprehensive review of the literature. Am. J. Surg. Pathol. 2004;28:1–30. doi: 10.1097/00000478-200401000-00001. - DOI - PubMed
    1. Ungari C., Rocchi G., Rinna C., Agrillo A., Lattanzi A., Pagnoni M. Hypophosphaturic mesenchymal tumor of the ethmoid associated with oncogenic osteomalacia. J. Craniofac. Surg. 2004;15:523–527. doi: 10.1097/00001665-200405000-00036. - DOI - PubMed
    1. Gronskaia S.A., Belaya Z.E., Melnichenko G.A. FGF23 tumor induced osteomalacia. Probl. Endokrinol. 2022;68:56–66. doi: 10.14341/probl13130. - DOI - PMC - PubMed
    1. Villepelet A., Casiraghi O., Temam S., Moya-Plana A. Ethmoid tumor and oncogenic osteomalacia: Case report and review of the literature. Eur. Ann. Otorhinolaryngol. Head Neck Dis. 2018;135:365–369. doi: 10.1016/j.anorl.2018.07.001. - DOI - PubMed
    1. Kocelak P., Olszanecka-Glinianowicz M., Chudek J. Fibroblast growth factor 23--structure, function and role in kidney diseases. Adv. Clin. Exp. Med. 2012;21:391–401. - PubMed

Substances

LinkOut - more resources