Comparative Study
. 2025 Sep 22;16(1):8299.
doi: 10.1038/s41467-025-63935-9.

Comparative single-cell and spatial profiling of anti-SSA-positive and anti-centromere-positive Sjögren's disease reveals common and distinct immune activation and fibroblast-mediated inflammation

Affiliations
Comparative Study

Comparative single-cell and spatial profiling of anti-SSA-positive and anti-centromere-positive Sjögren's disease reveals common and distinct immune activation and fibroblast-mediated inflammation

Jun Inamo et al. Nat Commun. .

Abstract

Sjögren's disease (SjD) is an autoimmune disease that causes salivary gland dysfunction due to immune-mediated destruction. While autoantibodies such as anti-SSA and anti-centromere (CENT) are associated with distinct clinical manifestations, the molecular features remain to be elucidated. In this study, we apply multi-modal single-cell technologies: single-cell RNA sequencing, T cell and B cell receptor sequencing and spatial transcriptomics to salivary gland lesions, aiming to elucidate common and unique cellular and transcriptional signatures linked to different autoantibody profiles. Our analysis demonstrates that GZMB+GNLY+ CD8+ T cells are the main expanded subset across different autoantibody statuses, highlighting their central role in SjD pathogenesis, while the enrichment of memory B cells is more prominent in anti-CENT-positive patients. Cytokine signaling also differs by autoantibody profile, with an activated interferon signature in anti-SSA-positive patients, whereas TGFβ signaling is enhanced in anti-CENT-positive patients. Furthermore, spatial profiling reveals THY1+ fibroblasts, expressing complement genes and chemokines, as key hubs orchestrating inflammation within the salivary glands. These findings deepen our understanding of the pathogenesis of SjD, and may inform the development of targeted and personalized therapeutic strategies.


Conflict of interest statement

Competing interests: The authors declare no competing interests.

Figures

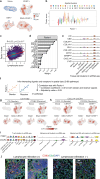
Fig. 1
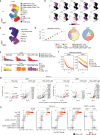
Fig. 1. Overview of the study design and analysis.
a Clinical overview of Sjögren’s disease (SjD) and motivation for this study. The upper section illustrates common symptoms of SjD, and the lower section classifies patients based on autoantibody profiles (SSA+ and/or CENT+) by associated clinical features. The bottom part of the figure shows a schematic of the sample processing and analysis workflow, including biopsy collection from the salivary gland, followed by single-cell RNA sequencing (scRNA-seq) and T- and B-cell receptor repertoire analysis. Created in BioRender. Inamo, J. (2025) https://BioRender.com/pgjlzhs. b The UMAP plot illustrates broad cell types identified in the salivary glands. c Marker gene expressions in different cell types.
Fig. 2
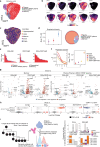
Fig. 2. Cell-type-specific analysis of T cell diversity and functionality in SjD.
a The UMAP plot displays T cell subsets in salivary glands. b Expression levels of markers across T cell subsets. c Clonal expansion of T cells. d TCR repertoire diversity by cell clusters, with the left plot quantifying diversity scores and the right plot depicting connectivity diagrams of TCR clonotypes for different T cell subsets. Data are presented as mean values ±  standard deviation (SD) derived from 200 bootstrap replicates for each group. e Subtype analysis of top 20 expanded clones in CD8+ and CD4+ T cells across different SjD autoantibody profiles. f TCR repertoire diversity as a smooth function (D) of a single parameter q by autoantibody status. As the parameter q increases from 0 to + ∞ the diversity index (D) depends less on rare clones and more on common (abundant) ones. Large diversity index (D) are interpreted as high diversity in clonal populations. Lines represent mean diversity values, and shaded areas indicate 95% confidence intervals estimated from 200 bootstrap replicates. g Differentially expressed gene (DEG) analysis in CD4+ and CD8 + T cells across SjD subgroups compared to Sicca using the Wilcoxon rank-sum test (two-sided). Volcano plots show log₂ fold changes (logFC) (x-axis) and –log₁₀ adjusted p-values (y-axis) for DEGs between each SjD subgroup and Sicca controls in CD4+ (left three panels) and CD8 + T cells (right three panels). Upregulated genes (red) and downregulated genes (blue) are highlighted with selected key genes annotated. Genes not reaching significance are shown in grey. h Differential abundance profiles of T cell populations in SjD subtypes. Beeswarm plots showing the distribution of logFC in neighborhoods in different cell type clusters in T cells. Each plot compares the abundance in SjD overall, SSA+, CENT+, and SSA + CENT+ subtypes versus Sicca or each other. Significant changes (false discovery rate (FDR) < 0.05) are highlighted, indicating enriched or depleted in each case. Source data are provided as a Source Data file.
Fig. 3
Fig. 3. Comprehensive profiling of B and plasma cell subpopulations in SjD.
a The UMAP displays B/plasma cell subsets in salivary glands. b Expression levels of markers across B/plasma cell subsets. c Clonal expansion of B/plasma cells. d BCR repertoire diversity by cell clusters, with the left plot quantifying diversity scores and the right plot depicting connectivity diagrams of BCR clonotypes for different B/plasma cell subsets. Plasmablasts were excluded from the analysis due to their low abundance. Data are presented as mean values ± standard deviation (SD) derived from 200 bootstrap replicates for each group. e Subtype analysis of top 20 expanded clones in B/plasma cells across different SjD autoantibody profiles. f BCR repertoire diversity as a smooth function (D) of a single parameter q by autoantibody status. The right plot focuses on the diversity at a specific parameter (q = 4), comparing SjD with Sicca conditions. Data are presented as mean values ± SD derived from 200 bootstrap replicates for each group. g Differentially expressed gene (DEG) analysis in memory and plasma cells (Plasma and NR4A1+NFKB+ plasma) across SjD subgroups compared to Sicca using the Wilcoxon rank-sum test (two-sided). Volcano plots show log₂ fold changes (logFC) (x-axis) and –log₁₀ adjusted p-values (y-axis) for DEGs between each SjD subgroup and Sicca controls in memory (left three panels) and plasma cells (right three panels). Upregulated genes (red) and downregulated genes (blue) are highlighted with selected key genes annotated. Genes not reaching significance are shown in grey. h Differential abundance profiles of B/plasma cell populations in SjD subtypes. Beeswarm plots showing the distribution of logFC in neighborhoods in different cell type clusters in B/plasma cells. Each plot compares the abundance in SjD overall, SSA+, CENT+, and SSA + CENT+ subtypes versus Sicca or each other. Significant changes (false discovery rate (FDR) < 0.05) are highlighted, indicating enriched in each case. i The schematic diagram on the left illustrates the strategy for investigating antibody responses to SjD-related antigens. Antibodies are generated from the largest B cell lineage trees per participant (maximum 5). Their responses to each antigen (Ro60, Ro52 and centromere) were analyzed by flow cytometry. The right bar graph shows the antigens associated with the largest trees per sample. The y-axis represents the proportion of cells in the total B/plasma cells per sample and the x-axis represents the participants analyzed. Created in BioRender. Inamo, J. (2025) https://BioRender.com/kz9vcu3. Source data are provided as a Source Data file.
Fig. 4
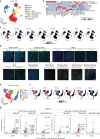
Fig. 4. Identification of tissue cells with cross-phenotypes and identified myeloid and NK cells in salivary glands.
a The UMAP plot displaying tissue cell types. b Heatmap illustrates expression levels of marker genes across different tissue cell types. c Expression levels of markers across tissue cell subsets. d Immunofluorescence images displaying the localization of specific markers in various tissue structures, including serous and mucous acini, ducts, myoepithelial cells, and stem cells. The last four figures are representative of cells with cross-phenotypes of different tissue cell subsets. e The UMAP plot displaying subsets of myeloid cells and NK cells in salivary glands. f Expression levels of markers across myeloid and NK cell subsets. g Differentially expressed gene (DEG) analysis in acinar (Serous and Mucous) and monocytes (classical (CL Mono) and non-classical monocytes (NC Mono)) across SjD subgroups compared to Sicca. Volcano plots show log₂ fold changes (logFC) (x-axis) and –log₁₀ adjusted p-values (y-axis) for DEGs between each SjD subgroup and Sicca controls in acinar (left three panels) and monocytes (right three panels). Upregulated genes (red) and downregulated genes (blue) are highlighted with selected key genes annotated. Genes not reaching significance are shown in grey. Source data are provided as a Source Data file.
Fig. 5
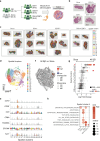
Fig. 5. Spatial transcriptome analysis of salivary glands reveals enrichment of leukocyte clusters across SjD subtypes and differential pathways by autoantibody status.
a Schema showing the study design for spatial transcriptome analysis (10X Visium). Created in BioRender. Inamo, J. (2025) https://BioRender.com/mu09iuk. b Hematoxylin and eosin (H&E) stained sections of representative samples used for spatial transcriptome analysis. Distribution of spatial clusters within salivary gland tissues on histological sections (c) and UMAP (d). Colors represent 19 unique spatial clusters. e Violin plots displaying the expression levels of key markers across the spatial clusters. f Neighborhood graph of spatial regions using differential abundance testing. Nodes represent neighborhoods from the spatial clusters. Colors indicate the log2-fold change (logFC) between SjD overall and Sicca. Neighborhoods that increased in patients with SjD are shown in red. g Beeswarm plot showing the distribution of logFC in neighborhoods in different spatial clusters comparing the abundance between SjD overall and Sicca. Significant changes (false discovery rate (FDR) < 0.05) are highlighted, indicating enriched in all SjD. h Gene Set Enrichment Analysis (GSEA) comparing autoantibody status. Only selected pathways with significance (FDR < 0.05) in spot cluster 4 are shown. The size of the dots represents the set size of genes involved, and the color intensity indicates the normalized enrichment score (NES).
Fig. 6
Fig. 6. Unsupervised factorization analysis reveals fibroblasts as core players in cell-cell interaction in the inflammatory foci of SjD.
a Spatial maps highlighting the Factor-1 values across different SjD subtypes and Sicca. Color intensity varies from low (blue) to high (red). b Box plots representing the distribution of Factor-1 values across distinct spatial clusters identified in salivary glands. The center line indicates the median, the boxes represent the interquartile range (IQR; 25th to 75th percentiles), and whiskers extend to the most extreme data points within 1.5 × IQR. c Scatter plot illustrating the correlation between Factor-1 levels and lymphocyte scores across tissue samples. The Spearman’s correlation coefficient (R) and p-value are indicated. d Bar graph displaying the weights of top genes contributing to Factor-1. Higher weights suggest a stronger influence on the factor. e Violin plots showing the expression of key genes associated with Factor-1 across different tissue cell clusters identified in scRNA-seq data. f Schematic representing the methodology used to infer interacting ligands and receptors in spatial data that covary with Factor-1. The number of pathways analyzed and the criteria for significance (Spearman’s correlation coefficient and adjusted p-value) are shown. Spatial map of the expression patterns of C3 (sender) and ITGB2 (receiver) (g) and CXCL14 (sender) and CXCR4 (receiver) h across SjD subtypes and Sicca, correlating these with Factor-1. The color intensity indicates the level of expression in each tissue. i Receiver gene expression profiles across cell subsets identified in scRNA-seq data. j Representative immunofluorescence images displaying the co-localization of CD90 and C3d in foci of inflammatory cells in salivary glands of four independent individuals with SjD. In (b) each point represents a single spot, and the number of spots is as follows: Cluster 0: n = 1414; Cluster 1: n = 1023; Cluster 2: n = 1018; Cluster 3: n = 924; Cluster 4: n = 853; Cluster 5: n = 824; Cluster 6: n = 714; Cluster 7: n = 613; Cluster 8: n = 458; Cluster 9: n = 384; Cluster 10: n = 338; Cluster 11: n = 249; Cluster 12: n = 229; Cluster 13: n = 160; Cluster 14: n = 136; Cluster 15: n = 117; Cluster 16: n = 114; Cluster 17: n = 74; Cluster 18: n = 56.
Fig. 7
Fig. 7. Characterizing shared and distinct spatial transcriptome profiles associated with GZMK+ and GZMB+ in CD8+ T cells in salivary glands.
a Expression of GZMK and GZMB in spatial regions containing CD8+ T cells. b The top 10 and bottom 10 genes correlating with GZMK and GZMB expression in spatial regions containing CD8+ T cells, along with their correlation coefficients by Spearman’s correlation test. c Venn diagram displaying the up-regulated pathways along with expression of GZMK and GZMB, respectively. d Gene Set Enrichment Analysis (GSEA) comparing GZMK and GZMB correlated genes. Only selected pathways with significance (false discovery rate (FDR) < 0.05) are shown. The size of the dots represents the set size of genes involved, and the color intensity indicates the normalized enrichment score (NES).

References

    1. Mariette, X. & Criswell, L. A. Primary Sjögren’s syndrome. N. Engl. J. Med.378, 931–939 (2018). - PubMed
    1. Beydon, M. et al. Epidemiology of Sjögren syndrome. Nat. Rev. Rheumatol.20, 158–169 (2023). - PubMed
    1. Nocturne, G. & Mariette, X. Advances in understanding the pathogenesis of primary Sjögren’s syndrome. Nat. Rev. Rheumatol.9, 544–556 (2013). - PubMed
    1. Lin, X. et al. Th17 cells play a critical role in the development of experimental Sjögren’s syndrome. Ann. Rheum. Dis.74, 1302–1310 (2015). - PubMed
    1. Pontarini, E. et al. Unique expansion of IL-21+ Tfh and Tph cells under control of ICOS identifies Sjögren’s syndrome with ectopic germinal centres and MALT lymphoma. Ann. Rheum. Dis.79, 1588–1599 (2020). - PMC - PubMed

Publication types

MeSH terms