. 2025 Sep 22;16(1):8330.
doi: 10.1038/s41467-025-64088-5.

NR3C1-mediated epigenetic regulation suppresses astrocytic immune responses in mice

Affiliations

NR3C1-mediated epigenetic regulation suppresses astrocytic immune responses in mice

Seongwan Park et al. Nat Commun. .

Abstract

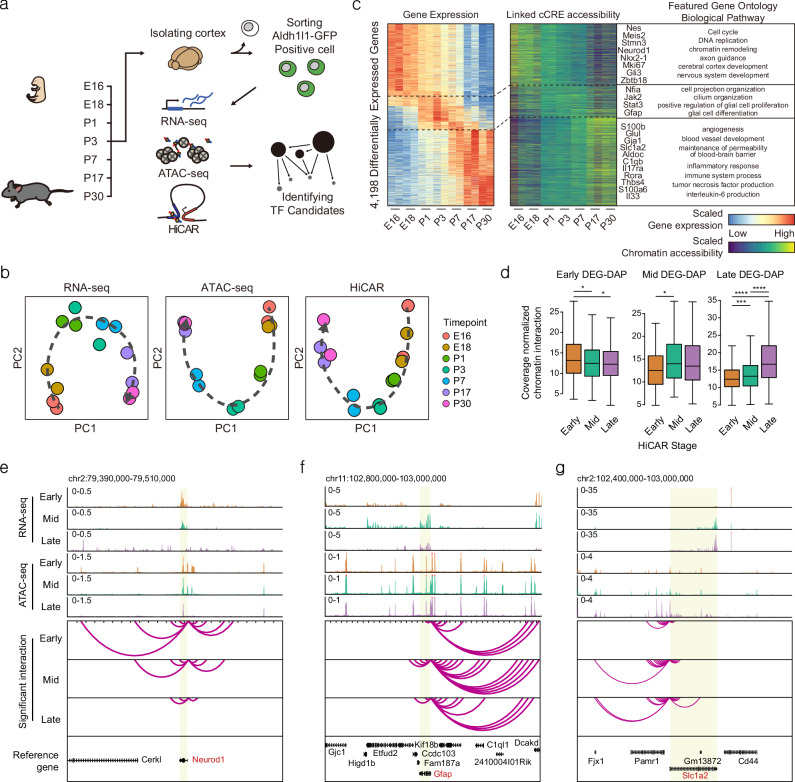
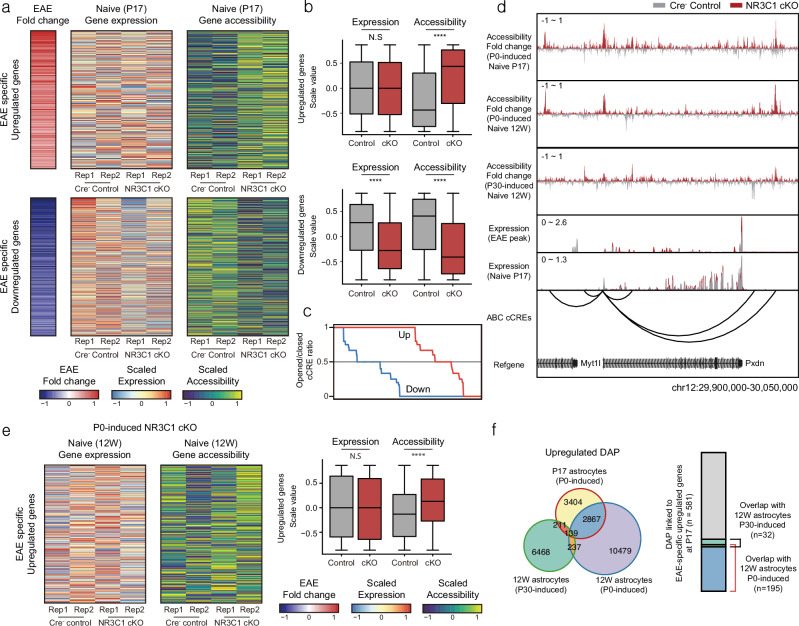
Astrocytes are critical contributors to brain disorders, yet the mechanisms underlying their selective vulnerability to specific diseases remain poorly understood. Here, we demonstrate that NR3C1 acts as a key regulator of early postnatal astrocyte development, shaping long-term immune responses in mice. Through integrative analyses of gene expression, chromatin accessibility, and long-range chromatin interactions, we identify 55 stage-specific TFs, with NR3C1 uniquely associated with early postnatal maturation. Although mice lacking astrocytic NR3C1 exhibit no detectable developmental abnormalities, these mice display heightened susceptibility to exacerbated immune responses following adult-onset experimental autoimmune encephalomyelitis (EAE). Many of the dysregulated EAE response genes are linked to candidate cis-regulatory elements altered by early NR3C1 loss, driving exacerbated inflammatory responses. Notably, only NR3C1 depletion during early, but not late, astrocyte development induces long-lasting epigenetic reprogramming that primes astrocytic immune responses.


Conflict of interest statement

Competing interests: The authors declare no competing interests.

Figures

Fig. 1
Fig. 1. Landscapes of transcriptome, epigenome, and long-range chromatin interactions during astrocyte development.
a Schematic of the multi-omics analyses of astrocyte development. Astrocytes were isolated from E16, E18, P1, P3, P7, P17, and P30 mouse cortices with two biological replicates. b Principal component analyses based on RNA-seq (left), ATAC-seq (middle), and HiCAR (right) representing astrocyte developmental trajectory throughout each dataset. The color indicates the time point of each developmental stage. c Heatmap showing the expression patterns of developmental DEGs (left) and accessibility patterns of their linked cCREs (right). Representative genes and ontologies are displayed to the right of the heatmap. d Boxplots representing significant long-range chromatin interaction scores between DEGs and Differentially Accessible Peaks (DAPs). The box indicates the interquartile range (IQR), and the whiskers represent the highest and lowest points within 1.5 × IQR. P values of differences of interaction between early DEG and DAP (n = 438) were P = 0.029 for Early vs Mid, P = 0.016 for Early vs Late, P = 0.332 for Mid vs Late; between mid DEG and DAP (n = 106) were P = 0.014 for Early vs Mid, P = 0.239 for Early vs Late, P = 0.505 for Mid vs Late; between late DEG and DAP (n = 572) were P = 1.24 × 103 for Early vs Mid, P < 2.20 × 1016 for Early vs Late, P < 2.20 × 1016 for Mid vs Late (two-sided Kolmogorov–Smirnov test). Early, E16 and E18; Mid, P1, P3, and P7; Late, P17 and P30. eg Genome browser snapshots of representative DEGs, including Neurod1 (e), Gfap (f), and Slc1a2 (g) with gene expression, chromatin accessibility, and significant long-range chromatin interactions.
Fig. 2
Fig. 2. Identification of stage-specific transcription factors in astrocyte development.
a Integrated analysis for the identification of developmental TFs. The color represents the scaled gene expression of each TF. The size of the square indicates the normalized PageRank score of each TF estimated by Taiji. The maximum activity time point for each TF is highlighted by a black box. b, c UMAP projection of 72,666 cells of neurogenic and astrocytic lineages from mouse developing cortices. The plots were colored by annotated cell types (b) or pseudotime (c). d Relative expression patterns of developmental TFs identified in Fig. 2a. The TFs expressed with more than a twofold change in astrocytic lineages are colored blue (n = 6), while in neurogenic lineages, colored green (n = 7). e, f UMAP plots colored by the normalized expression of Nr3c1 (e) and Neurod6 (f). g Scatter plot representing the effect of each TF in silico perturbation within both neurogenic and astrocytic lineages. The color indicates the developmental stage at which each TF shows the highest PageRank scores. The x and y axes indicate the effects of TF perturbation at astrocyte and neurogenic lineages, respectively. TFs that are highly expressed in astrocytic lineages are marked with black circles.
Fig. 3
Fig. 3. Disease-associations of astrocyte lineage-specific TFs.
a A heatmap displaying the enrichment scores of the target genes regulated by each TF for brain disorders. The NES score was obtained from GSEA analysis, indicating the degree of disease association for the target genes of each TF. Bidirectional hierarchical clustering was performed based on Euclidean distances of NES scores. *FDR < 0.05, **FDR < 0.01, ***FDR < 0.001. b, c GSEA for STAT3 and NR3C1 to disease-associated genes for ‘Bipolar disorder’ (b P = 0.010) and ‘Multiple sclerosis’ (c P = 0.012), respectively.
Fig. 4
Fig. 4. Exacerbated immune responses after EAE induction in NR3C1 cKO mice.
a Schematics of experiments for the generation of NR3C1 cKO mice and autoimmune challenges. b The number of NR3C1+ astrocytes in Cre control and NR3C1 cKO mice at P17. Mice were used with n = 3 for Cre control, n = 5 for NR3C1 cKO. Data are shown as mean ± standard error of the mean (SEM) and are analyzed by one-sided unpaired t test (P < 0.0001). c Heatmap representing DEGs of NR3C1 cKO astrocytes at P17 under naive conditions. d Bar graphs showing the overlapping ratio between DEGs of NR3C1 cKO astrocytes and astrocyte developmental stage-specific DEGs. Hypergeometric p value are shown together (Up-P7, P = 1.64 × 105; Up-P17, P = 0.010; Down-P17, P = 2.72 × 1013; Down-P30, P = 1.31 × 107). e Top 5 enriched MSigDB Hallmark pathways of DEGs in NR3C1 cKO astrocytes. f GFAP expression in the corpus callosum. Bar graphs showing the area of GFAP expression compared between Cre control and NR3C1 cKO mice under naive conditions (P = 0.749) and at the peak of EAE (P = 4.65 × 102). Mice were used with n = 3 or n = 7 for Cre control and n = 4 or n = 7 for NR3C1 cKO at naive or EAE peak stage, respectively. Data are shown as mean ± SEM and were analyzed by a two-sided unpaired t test. g EAE clinical score in Cre control mice (n = 12) and NR3C1 cKO mice (n = 10). Two-way ANOVA, P < 0.0001. Data are shown as mean ± SEM. Scale bars, 20 μm. h IBA1 expression in corpus callosum at the EAE peak (P = 0.056). Mice were used with n = 7 for Cre control and 7 for NR3C1 cKO. Data are shown as mean ± SEM and were analyzed by two-sided unpaired t test. i The number of CD4+ T cells in corpus callosum at the EAE peak (P = 1.6 × 103). Mice were used with n = 7 for Cre control and 7 for NR3C1 cKO. Data are shown as mean ± SEM and were analyzed by two-sided unpaired t test. Scale bars, 40 μm. j, k GFAP expression (j P = 2.09 × 102) and the number of CD45+ cells (k P = 6.50 × 103) in the spinal cord at the peak of EAE. Mice were used with n = 3 for Cre control and n = 4 for NR3C1 cKO. Data are shown as mean ± SEM and were analyzed by two-sided unpaired t test. Scale bars, 100 μm (j) and 50 μm (k). Source data are provided as a Source Data file.
Fig. 5
Fig. 5. Single-nucleus transcriptome analyses of NR3C1 cKO mice at the peak of EAE.
a Heatmap representing DEGs between astrocytes from Cre control and NR3C1 cKO mice at the EAE peak. b t-SNE projections illustrating subpopulation information of astrocytes (C0-C4). c Dot plots showing the expression patterns of DEGs in astrocyte subpopulations. Dot size indicates the average ratio of expressed gene numbers per cell. Color represents the average expression level of genes in subpopulations. d Scatter plots of representative DEG expressions in astrocytes from Cre control and NR3C1 cKO mice. e Violin plots showing expression levels of DEGs at the EAE peak in active or inactive brain lesions of multiple sclerosis patients (two-sided Kolmogorov–Smirnov test, Up, P < 2.20 × 1016; Down, P < 2.20 × 1016). f Top 5 enriched MSigDB Hallmark pathways of upregulated or downregulated DEGs in astrocytes from NR3C1 cKO mice at the EAE peak. P values were calculated by one-sided hypergeometric test. g Violin plots showing gene expression scores of TNF-α signaling (P = 2.89 × 1015), IFN-γ signaling (P = 0.015), and IL-2/STAT5 signaling (P = 8.77 × 105). The box indicates the IQR, and the whiskers represent the highest and lowest points within 1.5 × IQR. h Distribution of fold change values between Cre control and NR3C1 cKO for GR-suppressing LPS responsive genes (P = 9.66 × 1015). P values were calculated by two-sided Kolmogorov–Smirnov test.
Fig. 6
Fig. 6. Epigenetic predisposition of astrocyte inflammatory response genes in the perinatal NR3C1 cKO mice.
a Heatmap showing gene expression and gene body accessibility of EAE-specific DEGs (n = 526 for upregulated and n = 1019 for downregulated). Expression fold changes at EAE peak, expression levels at naive, and accessibility of gene body in naive P17 astrocytes were shown. b Boxplots showing the gene expression and chromatin accessibility of EAE-specific DEGs shown in Fig. 6a. Two-sided Kolmogorov–Smirnov test, Up-accessibility P < 2.20 × 1016, Down-expression P < 2.20 × 1016, Down-accessibility P < 2.20 × 1016. The box indicates the IQR, and the whiskers represent the highest and lowest points within 1.5 × IQR. c Line plots represent the ratio of open-to-closed cCREs linked to EAE-specific up- and downregulated genes. A value of 1 (or 0) indicates that all linked cCREs are upregulated (or downregulated) in NR3C1 cKO mice. d Genome browser snapshots of representative EAE-responsive upregulated genes (Pxdn). e Heatmap showing gene expression and gene body accessibility of EAE-specific upregulated genes (n = 526). Expression levels and accessibility of the gene body in astrocytes from 12 W naive mice following P0-induced NR3C1 cKO were shown (left). Boxplots showing the gene expression and chromatin accessibility of EAE-specific upregulated genes (right). Two-sided Kolmogorov-Smirnov test, accessibility P = 9.59 × 108. The box indicates the IQR, and the whiskers represent the highest and lowest points within 1.5 × IQR. f Venn diagram showing the overlap between differentially accessible peaks in three groups: astrocytes from P17 naive NR3C1 cKO mice (P0-induced NR3C1 cKO), astrocytes from 12 W naive NR3C1 cKO mice (P0-induced or P30-induced NR3C1 cKO) (left). Bar graph showing the overlap of DAPs linked to EAE-specific upregulated genes with DAPs in astrocytes from 12 W naive NR3C1 cKO mice (P0-induced or P30-induced NR3C1 cKO) (right).
Fig. 7
Fig. 7. NR3C1-dependent epigenetic predisposition of EAE-responsive genes.
a Genome browser snapshot of representative EAE-responsive upregulated genes (Mxi1) with NR3C1 and c-JUN binding in cultured primary astrocytes. b Pie charts illustrating the proportion of NR3C1-bound cCREs associated with upregulated genes (left), downregulated genes (middle), and cCREs not linked to dysregulated genes (right) at the peak of EAE. c Boxplot showing the distance between dysregulated genes (n = 704 for upregulated, n = 1160 for downregulated) and the nearest NR3C1-only binding sites or NR3C1/c-JUN co-bound regions. Two-sided Mann–Whitney test, NR3C1-only, upregulated P = 9.04 × 102, downregulated P = 2.82 × 1023; NR3C1/c-JUN co-bound, upregulated P = 5.36  × 103, downregulated P = 1.23 × 1025. The box indicates the IQR, and the whiskers represent the highest and lowest points within 1.5 × IQR. d Top 5 enriched TF motif sequences in cCREs for EAE-responsive genes. P values were calculated by a one-sided hypergeometric test. e A schematic overview illustrating the impact of NR3C1 depletion-induced epigenetic predisposition on the selective vulnerability of immune responses in astrocytes.

References

    1. Lee, H. G., Wheeler, M. A. & Quintana, F. J. Function and therapeutic value of astrocytes in neurological diseases. Nat. Rev. Drug Discov.21, 339–358 (2022). - PMC - PubMed
    1. Kenny, E. M. et al. Excess of rare novel loss-of-function variants in synaptic genes in schizophrenia and autism spectrum disorders. Mol. Psychiatry19, 872–879 (2014). - PubMed
    1. Kirov, G. et al. De novo CNV analysis implicates specific abnormalities of postsynaptic signalling complexes in the pathogenesis of schizophrenia. Mol. Psychiatry17, 142–153 (2012). - PMC - PubMed
    1. Kraft, A. W. et al. Attenuating astrocyte activation accelerates plaque pathogenesis in APP/PS1 mice. FASEB J.27, 187–198 (2013). - PMC - PubMed
    1. Knott, C., Wilkin, G. P. & Stern, G. Astrocytes and microglia in the substantia nigra and caudate-putamen in Parkinson’s disease. Parkinsonism Relat. Disord.5, 115–122 (1999). - PubMed

LinkOut - more resources