. 2025 Oct;7(10):2142-2164.
doi: 10.1038/s42255-025-01365-z. Epub 2025 Sep 22.

The Neurolipid Atlas: a lipidomics resource for neurodegenerative diseases

Affiliations

The Neurolipid Atlas: a lipidomics resource for neurodegenerative diseases

Femke M Feringa et al. Nat Metab. 2025 Oct.

Abstract

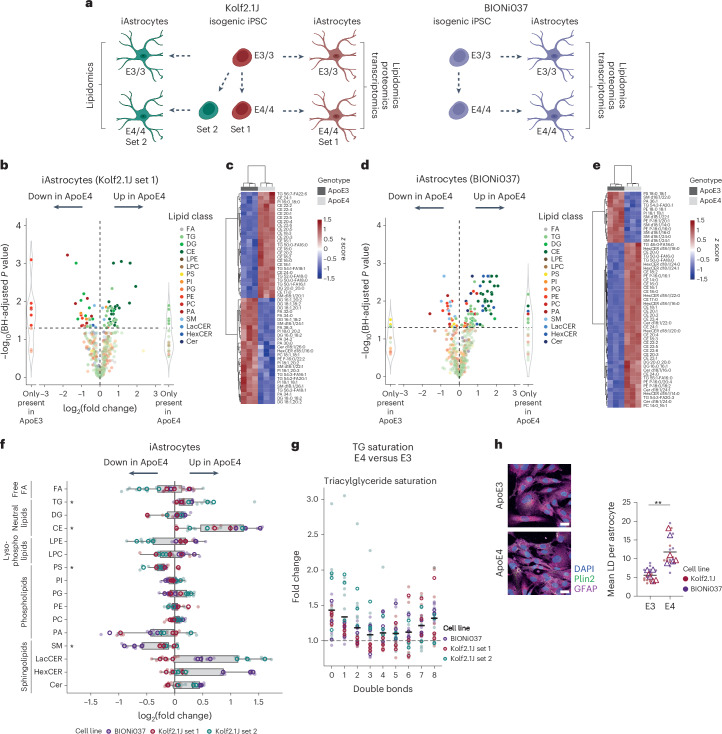
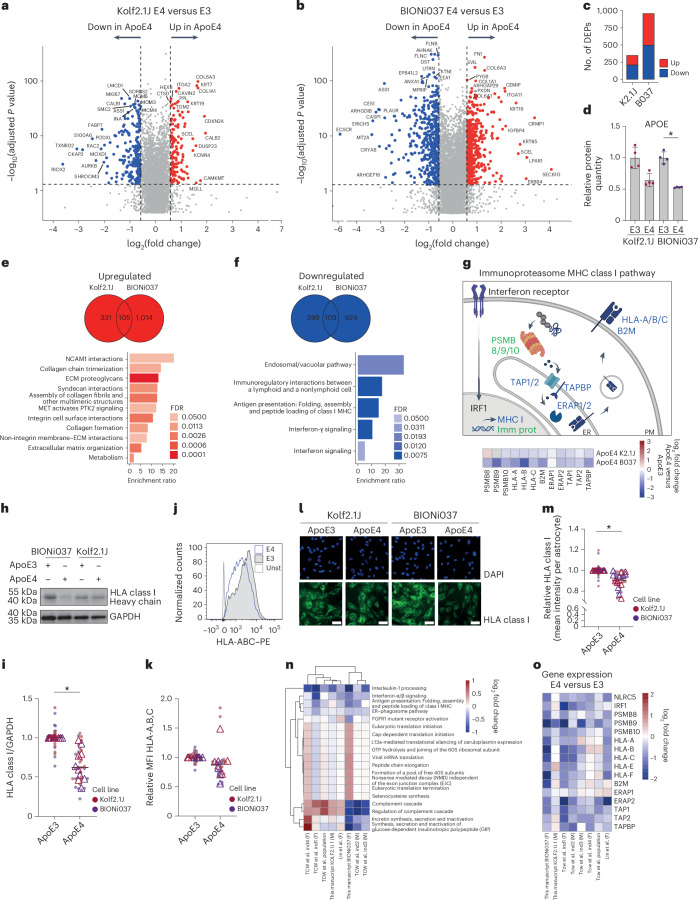
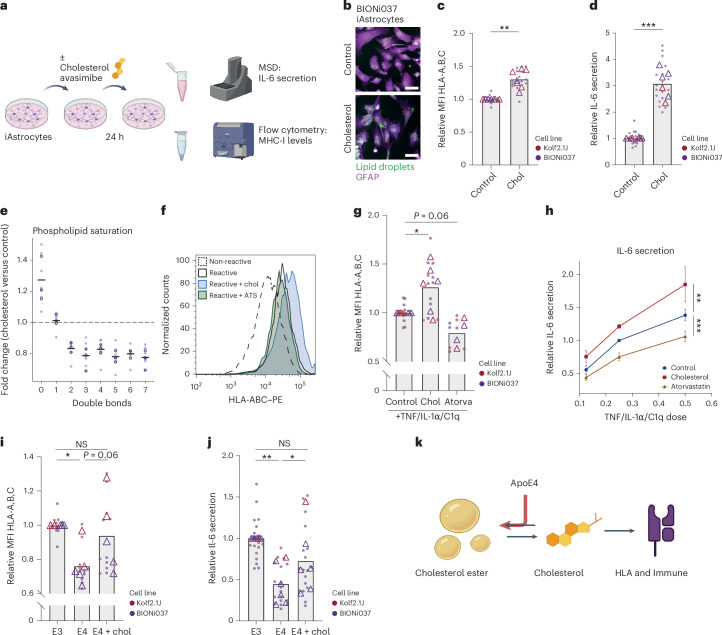
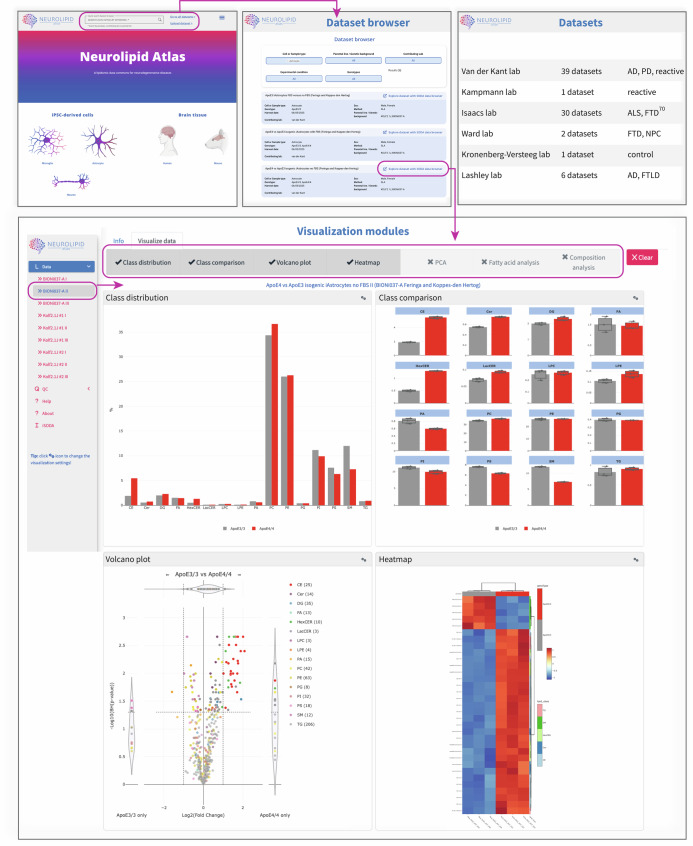
Lipid alterations in the brain have been implicated in many neurodegenerative diseases. To facilitate comparative lipidomic research across brain diseases, we establish a data common named the Neurolipid Atlas that we prepopulated with isogenic induced pluripotent stem cell (iPS cell)-derived lipidomics data for different brain diseases. Additionally, the resource contains lipidomics data of human and mouse brain tissue. Leveraging multiple datasets, we demonstrate that iPS cell-derived neurons, microglia and astrocytes exhibit distinct lipid profiles that recapitulate in vivo lipotypes. Notably, the Alzheimer disease (AD) risk gene ApoE4 drives cholesterol ester (CE) accumulation specifically in human astrocytes and we also observe CE accumulation in whole-brain lipidomics from persons with AD. Multiomics interrogation of iPS cell-derived astrocytes revealed that altered cholesterol metabolism has a major role in astrocyte immune pathways such as the immunoproteasome and major histocompatibility complex class I antigen presentation. Our data commons, available online ( https://neurolipidatlas.com/ ), allows for data deposition by the community and provides a user-friendly tool and knowledge base for a better understanding of lipid dyshomeostasis in neurodegenerative diseases.


Conflict of interest statement

Competing interests: R.K. has acted as a consultant for NewAmsterdam Pharma. M.K. is a coscientific founder of Montara Therapeutics, serves on the scientific advisory boards of Engine Biosciences, Casma Therapeutics, Cajal Neuroscience, Alector and Montara Therapeutics and is an advisor to Modulo Bio and Recursion Therapeutics. M.G. is a consultant to Boehringer-Ingelheim Pharma and an inventor of patent application WO2023172132A1. The other authors declare no competing interests.

Figures

Fig. 1
Fig. 1. Lipotypes of human iNeurons, iAstrocytes and microglia.
a, Schematic overview of the Neurolipid Atlas workflow and resource. b, Schematic overview of iPS cell differentiation protocols. c, Representative confocal microscopy images of iNeurons, iAstrocytes and iMicroglia in monoculture of at least three independent differentiations per cell type. Scale bar, 50 μm (BIONi037-A parental line). d, Heat map of z-scored lipid class abundance in iNeurons, iAstrocytes and iMicroglia (BIONi037-A parental line). e, PCA analysis of iPS cell-derived brain cell lipotypes. f, Pie charts showing relative abundance of all detected lipid classes in the iPS cell-derived brain cell types. g, Bar graphs present individual lipid class levels in each cell type, normalized to total lipid level. N (iNeurons), n = 4 wells; A (iAstrocytes), n = 3 wells; M (iMicroglia), n = 4 wells. Data are shown as the mean ± s.d. Images in a,b were created using BioRender.com.
Fig. 2
Fig. 2. Human (AD) brain lipidomics.
a, Schematic overview of human postmortem brain tissue samples and summary of participant characteristics. Metadata for individual participants can be found in the Methods. This image was created using BioRender.com. b, PCA analysis of unbiased lipidomic analysis from indicated brain areas (control group only). c, Heat map shows z-scored relative lipid class abundance (control group) per brain region. d, PCA plot of unbiased lipidomic analysis of AD (purple) and control (green) brain tissue samples from frontal cortex gray matter. e, Heat map depicting changes (log2 fold change for AD group versus average control group) at the lipid class level for each individual with AD and each brain area. Samples from participants with AD are ordered 1–20 from left to right in each brain area (metadata in Methods). f, Average log2 fold change of lipid classes in all AD brain samples compared to control samples per brain area. *P < 0.05 and **P < 0.01 (two-sided t-test or Mann–Whitney U-test with Benjamini–Hochberg (BH) correction). g, Changes in levels of CE, DG and TG (neutral) lipid species in control versus AD group. Data are shown as the median and interquartile range (IQR). *P < 0.05 and **P < 0.01 (two-sided t-test or Mann–Whitney U-test with BH correction). All lipid values in this figure are plotted as a percentage of total lipids (raw concentration in Extended Data Fig. 2b,f–j).
Fig. 3
Fig. 3. Lipidomic analysis of human isogenic APOE3/3 and APOE4/4 iAstrocytes.
a, Schematic overview of isogenic iPS cell lines and experimental design. This image was created using BioRender.com. be, Volcano plot presents a typical example of log2 fold change of altered lipid species in Kolf2.1J set 1 (b) and BIONi037 (d) ApoE4 versus ApoE3 iAstrocytes. Also shown are heat maps of most differentiating lipid species between ApoE4 and ApoE3 iAstrocytes in Kolf2.1J set 1 (c) and BIONi037 (e). f, Summary data of changes in all detected lipid classes in ApoE4 versus ApoE3 iAstrocytes (N = 9; three independent experiments from three isogenic sets). Data are shown as the median and IQR; whiskers indicate the furthest data point within 1.5× the IQR. *P < 0.05 (two-sided paired t-test or Mann–Whitney U-test with BH correction). g, Fold change in TGs with indicated number of double bonds (unsaturation) in ApoE4 versus ApoE3 iAstrocytes. All experiments presented in f are included here. Data are shown as the mean. h, Representative images and quantification of the average lipid droplet number per astrocyte based on Plin2 staining (N = 6; three independent experiments from two isogenic sets). Data are shown as the mean. **P < 0.01 (two-sided t-test). Scale bar, 25 μm. Open circles and triangles indicate the mean per experiment, while solid dots represent all independent wells.
Fig. 4
Fig. 4. Proteomic and transcriptomic analysis of human isogenic ApoE3 and ApoE4 iAstrocytes.
a,b, Volcano plots present log2 fold changes in protein levels in ApoE4 versus ApoE3 iAstrocytes from Kolf2.1J set 1 (a) and BIONi037 (b). The top ten proteins with the highest log2 fold changes and top ten proteins with the most significant P values are labeled (N = 4 wells per genotype). Statistical analysis was performed using a two-sided pairwise t-test. c, Number of DEPs (fold change > 1.5, FDR < 0.05) detected in ApoE4 versus ApoE3 iAstrocytes of Kolf2.1J (set 1) and BIONi037 isogenic sets. d, Relative ApoE protein levels in ApoE3 and ApoE4 iAstrocytes (from proteomic analysis) from BIONi037 and Kolf2.1J background. Data are shown as the mean and s.d. *P < 0.05 (two-sided Mann–Whitney U-test). e,f, Venn diagrams depicting the number of DEPs significantly upregulated (e) or downregulated (f) (fold change > 1.25, log2 fold change > 0.3) in Kolf2.1J, BIONi037 or both ApoE4 iAstrocytes. A Reactome ORA was performed on the 105 common upregulated (e) or 109 common downregulated (f) proteins and the enrichment ratio was plotted for all significant pathways (FDR < 0.05). g, Schematic overview of interferon-dependent regulation of MHC class I antigen presentation (in blue) and immunoproteasome (in green) pathways. The heat map indicates the log2 fold change of indicated proteins in ApoE4 versus ApoE3 iAstrocytes (proteomics). PM, plasma membrane. This image was created using BioRender.com. h,i, Representative western blot (h) and quantification (i) of MHC I levels (stained for HLA class I heavy chain) in ApoE4 versus ApoE3 iAstrocytes (N = 10; five independent experiments from two isogenic sets). Data are shown as the mean. *P < 0.05 (one-sample t-test). j,k, Representative histogram (BIONi037) (j) and quantification (k) of plasma membrane MHC I levels (stained for HLA-A, HLA-B and HLA-C) by flow cytometry (N = 9; five (Kolf2.1J) or four (Bi037) independent experiments from two isogenic sets). Data are shown as the mean. Unst, unstained control. l,m, Example images (l) and quantification (m) of MHC I levels as measured by immunofluorescence microscopy (stained for HLA class I heavy chain) (N = 14; seven independent experiments from two isogenic sets). Data are shown as the mean. *P < 0.05 (two-sided one-sample t-test). Scale bar, 50 μm. n, Comparison of significant Reactome pathways (by gene set enrichment analysis) from our transcriptomic analysis of ApoE4 versus ApoE3 astrocytes (BIONi037) with previously published datasets. Shown is the average log2 fold change of all measured genes in the indicated pathway in each isogenic set or case–control set. Tcw et al. ind1–ind4 (four different isogenic sets) and population (control versus ApoE4) represent iAstrocytes from a previous study. Lin et al. represents one isogenic set of ApoE4 versus ApoE3 iAstrocytes from a previous study. F, female; M, male. o, Heat map shows the log2 fold change in individual genes in the MHC I and immunoproteasome pathway across indicated studies, including our data here. Open triangles indicate the mean per experiment, while solid dots represent all independent wells. Source data
Fig. 5
Fig. 5. Lipidomic and proteomic analysis of reactive human iAstrocytes.
a, Schematic overview of experimental design. A cocktail of TNF, IL-1α and C1q was added for 24 h to make astrocytes reactive. b, The volcano plot presents the log2 fold change of altered individual lipid species in reactive versus control iAstrocytes (Kolf2.1J set 1, ApoE3). c, Summary data of changes in all detected lipid classes in reactive versus control iAstrocytes (N = 6; three independent experiments from two ApoE3 lines). Data are shown as the median and IQR; whiskers indicate the furthest data point within 1.5× the IQR. *P < 0.05 (two-sided paired t-test or paired Mann–Whitney U-test with BH correction). d, Fold change of all phospholipid species with indicated number of double bonds (unsaturation) in reactive versus control iAstrocytes. All experiments presented in c are included here. Data are shown as the mean. e, Number of DEPs (fold change > 1.5, FDR < 0.05) in reactive versus control iAstrocytes for indicated lines. f,g, The log2 fold changes in protein levels of reactive versus control iAstrocytes for Kolf2.1J set 1 (f) and BIONi037 (g). The top ten proteins with the highest log2 fold change and top ten proteins with the highest P values are labeled (N = 4 wells per genotype). Statistical analysis was performed using a two-sided pairwise t-test. h,i, Venn diagram depicting the number of proteins that were significantly upregulated (h) or downregulated (i) (fold change > 1.25, log2 fold change > 0.3) in reactive Kolf2.1J, BIONi037 and both iAstrocytes. A Reactome ORA was performed on the 275 common upregulated or 129 common downregulated proteins. No significantly enriched downregulated pathways were observed; the enrichment ratios for all significantly (FDR < 0.05) upregulated pathways are plotted in k. j, Top, heat map depicting the log2 fold change of indicated lipid classes in ApoE4 or reactive iAstrocytes versus ApoE3 control iAstrocytes. Lipid classes that were changed in ApoE4 or reactive iAstrocytes with P < 0.05 are shown. Bottom, heat map depicting the log2 fold change of indicated proteins from the MHC class I and immunoproteasome pathway in ApoE4 or reactive iAstrocytes versus ApoE3 control iAstrocytes (based on proteomics data). k, Relative membrane MHC I levels (stained for anti-HLA-A, anti-HLA-B and anti-HLA-C) according to flow cytometry in reactive versus control iAstrocytes (N = 9; four (Kolf2.1J) or five (Bi037) independent experiments from two isogenic sets). Data are shown as the mean. ****P < 0.0001 (two-sided one-sample t-test). l, Schematic representation of opposing lipidomic and proteomic phenotypes in ApoE4 and reactive iAstrocytes. Open circles or triangles indicate the mean per experiment, while solid dots represent all independent wells. The images in a,l were created using BioRender.com.
Fig. 6
Fig. 6. Cholesterol regulates reactivity of human iAstrocytes.
a, Schematic representation of the experimental design. b, Representative image of lipid droplet staining by Lipidspot in iAstrocytes (BIONi037 ApoE3) following 24-h treatment with 50 μM cholesterol. Scale bar, 50 μm. c, Normalized membrane MHC I levels (stained for anti-HLA-A, anti-HLA-B and anti-HLA-C) in control versus 50 μM cholesterol-treated ApoE3 iAstrocytes, as determined by flow cytometry (N = 7; three (Kolf2.1J) or four (Bi037) independent experiments from two isogenic sets). Data are shown as the mean. **P < 0.01 (two-sided one-sample t-test). d, Normalized IL-6 secretion in control versus cholesterol-treated ApoE3 iAstrocytes (N = 6; two (Kolf2.1J) or four (Bi037) independent experiments from two isogenic sets). Data are shown as the mean. ***P < 0.001 (two-sided one-sample t-test). e, Fold change of phospholipid species with indicated number of double bonds (unsaturation) in cholesterol-treated versus control iAstrocytes (BIONi037 ApoE3) (N = 3 independent experiments from Bi037A iAstrocytes). Data are shown as the mean. f,g, Representative histogram (f) and quantification (g) of normalized MHC I membrane levels determined by flow cytometry (stained for anti-HLA-A, anti-HLA-B and anti-HLA-C) in response to indicated treatment conditions in iAstrocytes (N = 4–6; three (control and cholesterol) or two (atorvastatin) independent experiments from two isogenic sets. Data are shown as the mean. *P < 0.05 (two-sided one-sample t-test for cholesterol and atorvastatin versus 1). h, Secreted Il-6 levels in medium of ApoE3 iAstrocytes that were pretreated with or without exogenous cholesterol (10 μM) or atorvastatin (0.5 μM) for 1 h before 24-h cotreatment with increasing doses of TNF, IL-1α and C1q (N = 5; two (Kolf2.1J) or three (Bi037) independent experiments from two isogenic sets). Data are shown as the mean and s.e.m. **P < 0.01 (intercept difference by linear regression model). Relative IL-6 levels with vehicle 0.25× cocktail dose set at 1. i, Relative changes in membrane MHC I levels determined by flow cytometry (stained for anti-HLA-A, anti-HLA-B and anti-HLA-C) in ApoE3, ApoE4 or ApoE4 iAstrocytes treated with 50 μM cholesterol (N = 5; two (Kolf2.1J) or three (Bi037) independent experiments from two isogenic sets. Data are shown as the mean. *P < 0.05 (two-sided one-sample t-test for E4 and E4 + cholesterol versus 1). *P < 0.05 (paired t-test for E4 versus E4 + cholesterol). BH correction was applied to the three P values. NS, not significant. j, Relative changes in IL-6 secretion in ApoE3, ApoE4 or ApoE4 iAstrocytes treated with 50 μM cholesterol (N = 6; one (Kolf2.1J) or five (Bi037) independent experiments from two isogenic sets). Data are shown as the mean. *P < 0.05 (two-sided one-sample t-test for E4 and E4 + cholesterol versus 1). *P < 0.05 (paired t-test for E4 versus E4 + cholesterol). BH correction was applied to the three P values. k, Schematic representation of ApoE4 decreasing MHC class I expression and immune function in human glia by increased cholesterol storage in CEs. Open circles or triangles indicate mean per experiment, while solid dots represent all independent wells. Images in a,k were created using BioRender.com.
Fig. 7
Fig. 7. The Neurolipid Atlas.
Overview of the Neurolipid Atlas data commons (https://neurolipidatlas.com) to explore all lipidomics datasets from this study. A representative image of the homepage is shown, where one can proceed to a list of experiments by selecting one of the cell type, human or mouse icons or enter a search term as indicated in the top panel. Alternatively, a list of all datasets can be found by selecting; ‘go to all datasets. A link to the quick start guide can be found at the bottom of the homepage or behind the menu (≡) icon in the top right corner. To explore data, experiments can be selected in the dataset browser window as indicated. Independent replicates of the experiment can be selected in the left column under ‘data’. Visualization options can be (de)selected in the top horizontal bar. Examples of bar graphs, volcano plots and heat maps for visualization of changes in lipid class (bar graphs) or lipid species (volcano plots and heat maps) levels between selected conditions are shown. The ‘QC’ and ‘help’ modules present in the left column offer extensive background information on the QC, data-processing steps, lipid class measurements and visualization options. Lastly, a summary list of currently available datasets is shown.
Extended Data Fig. 1
Extended Data Fig. 1. Culture purity and lipotypes (most differentiating species) of human iPSC-derived neurons, astrocytes and microglia.
a) Representative image of iNeurons used for purity quantification. White circles in the right panel indicate ring region around automatically detected intact nuclei where MAP2 intensity was measured. Scale bar = 50μm (BIONi037-A parental line). b) Percentage of MAP2 positive cells. N=3, three independent experiments. Mean c-d) Representative images (c) and quantification (d) of the percentage of Vimentin or AQP4 positive ApoE3 and ApoE4 iAstrocytes. N=4 two independent experiments from two isogenic sets. Mean. Scale bar = 50μm. e) Representative flow cytometry plots showing that >97% of cells generated from the EB differentiation protocol are pre-macrophages that are then plated for final differentiation to iMicroglia. f) Representative images of differentiated iMicroglia (day 14). Scale bar = 50μm (BIONi037-A parental line). g) Relative mRNA expression levels determined by qPCR of indicated microglial genes at 0-14 days of differentiation from pre-macrophage stage. N=3, three independent experiments. Mean + sem. h) Heatmap of most differentiating lipid species different between iPSC-derived neurons, astrocytes and microglia. alpha = 0.8 is used for discriminant analysis.
Extended Data Fig. 2
Extended Data Fig. 2. Extended analysis of human (AD) brain lipidomics at the lipid class level.
a) PCA analysis of unbiased lipidomic analysis from indicated brain areas (control group subjects only, showing PC1 and PC2). b) Heatmap with Z-scored lipid class concentrations (nmol/mg brain material) from indicated brain regions (control subjects only, main text Fig. 2c shows same data as percentage of total lipidome). c) PCA loadings plot shows how individual lipid species drive PC1 and PC2 in PCA plot of AD vs control brain tissue from Fig. 2d. d-e) PCA plot of unbiased lipidomic analysis of AD (purple) and control (green) brain tissue samples from (FC) white matter (d) and Cerebellum (e). f) Heatmap depicting changes in lipid classes (based on concentrations) for individual AD samples compared to the average of control samples. Log2fold change plotted independent for each donor and each brain area. g) Average log2fold change in AD subject group compared to control samples per lipid class and brain area. Data from (f). *P<0.05, t-test or Mann-Whitney U test with Benjamini-Hochberg correction. h-j) Bar graphs present individual lipid class levels in FC gray matter (h), FC white matter (I) and cerebellum (j) in AD and control samples (group levels) as concentrations. Mean + sd. k-m) Bar graphs present individual lipid class changes in FC gray matter (k), FC white matter (l) and Cerebellum (m) in AD versus control samples (group level) as percentage of total lipids. Mean + sd.
Extended Data Fig. 3
Extended Data Fig. 3. Extended analysis of human isogenic APOE3/3 and APOE4/4 iAstrocytes.
a) Representative sequencing result for confirming cell identity and expected ApoE genotype. b) Representative images of differentiated iAstrocytes, from both Kolf2.1J (set #1) and BIONi037 lines. Scale bar = 50μm. c) Gene expression levels (as determined by RNAseq) of indicated mature and immature astrocyte markers in our iPSC-derived astrocytes. n=6 wells BIONi037 (n=3 ApoE3, n=3 ApoE4). d) Relative ApoE levels secreted in the medium. N=3, one or two independent experiments from two isogenic sets. Mean e) Percentage of LD positive (>5 LDs quantified) iAstrocytes. N=6, three independent experiments from two isogenic sets. Mean **P<0.01 t-test. Data corresponds to Fig. 3h. In all panels open triangles indicate mean per experiment, while solid dots represent all independent wells.
Extended Data Fig. 4
Extended Data Fig. 4. Extended lipidomic analysis of human isogenic APOE3/3 and APOE4/4 iAstrocytes.
a-c) Volcano plots of lipid species changed in ApoE4 vs ApoE3 iAstrocytes in the independent replicate experiments in Kolf2.1J set #1 (a), BIONi037 (b) or Kolf2.1J set #2 (c). d) Bar graphs of lipid class levels in ApoE3 and ApoE4 iAstrocytes from all datasets presented in Fig. 3f. N=9, three independent experiments from three isogenic sets, Mean + sd. e-f) Fold change of cholesterol ester (e) or phospholipid (f) species with indicated number of double bonds in ApoE4 vs ApoE3 iAstrocytes. Mean. In all panels open circles indicate mean per experiment, while solid dots represent all independent wells.
Extended Data Fig. 5
Extended Data Fig. 5. Extended proteomic analysis of human isogenic APOE3/3 and APOE4/4 iAstrocytes.
a-b) Gene-set enrichment analysis with redundancy reduction by a weighted set cover algorithm was performed on proteomics data from ApoE4 versus ApoE3 iAstrocytes for the Kolf2.1J set #1 and the BIONi037 lines. Plotted are the enrichment scores (for both lines) for the Reactome pathways significantly enriched in Kolf2.1J set #1 (a) and pathways significantly enriched in BIONi037 (b). c) Representative western blots and quantifications of TAP1 and TAP2 protein levels in ApoE4 van ApoE3 iAstrocytes. (Kolf2.1J set #1) N=6, three independent experiments from three isogenic sets, Mean *P<0.05 one-sample t-test. d) Plasma membrane MHC I levels (stained for HLA-A,B,C) by flow cytometry. Data from Fig. 4k after outlier removal based on the ROUT method (Q=1). Mean **P<0.01 one sample t-test. In all panels open triangles indicate mean per experiment, while solid dots represent all independent wells. Source data
Extended Data Fig. 6
Extended Data Fig. 6. Extended transcriptomic analysis of human isogenic APOE3/3 and APOE4/4 iAstrocytes.
a-b) Volcano plots present log2fold change of differentially expressed genes (DEGs) in ApoE4 vs ApoE3 iAstrocytes from BIONi037 (a) or Kolf2.1J set #1 (b) from transcriptomics experiments. Top ten genes with the highest log2fold change and top ten genes with the most significant P-value are labeled. c-d) Top 10 Reactome pathways upregulated or downregulated (with lowest FDR) in ApoE4 vs ApoE3 iAstrocytes by gene-set enrichment analysis of transcriptomics data. e) Heatmap shows transcriptomic changes of indicated genes (all genes from the Reactome interferon signaling pathway) in ApoE4 vs ApoE3 iAstrocytes from our study and previous studies (as indicated). f) Plin2 gene expression based on the transcriptomic analysis of ApoE4 vs ApoE3 iAstrocytes from BIONi037 or Kolf2.1J set #1. n=3 wells per genotype in each isogenic set. Mean + sd. CPM = normalized counts per million. g) Relative mRNA expression levels of indicated genes in ApoE4 vs ApoE3 iAstrocytes quantified by qPCR. N=3 independent experiments from each isogenic set. Mean + sem. *P<0.05 one sample t-test with Benjamini-Hochberg correction on the p-values. (Kolf2.1J set #1).
Extended Data Fig. 7
Extended Data Fig. 7. Extended lipidomics analysis of reactive human iAstrocytes.
a) Volcano plots of lipid species changed in reactive vs control iAstrocytes in independent replicate experiments in Kolf2.1J set #1 ApoE3/3 and BIONi037 ApoE3/3. b) Bar graphs of lipid class levels in reactive and control iAstrocytes from all datasets presented in Fig. 5c. N=6, three independent experiments from two ApoE3 lines, Mean + sd. c) Relative levels of cholesterol in the medium in control vs reactive iAstrocytes (ApoE3). N=4, two independent experiments from two ApoE3 lines, Mean *P<0.05 one sample t-test. (Kolf2.1J set #1). d) Fold change of cholesterol ester (left panel) or triacylglyceride (right panel) species with indicated number of double bonds in reactive vs control iAstrocytes (ApoE3). All experiments presented in Fig. 5c are included here. Mean. e) Summary data of changes in all detected lipid classes in reactive vs control iAstrocytes from the Kampmann lab (WTC11 iPSC line, ApoE3/3 cultured in 2% FBS). n=3 wells per condition. f-g) Fold change of phospholipid (f) or triacylglyceride (g) species with indicated number of double bonds in reactive vs control iAstrocytes (WTC11, ApoE3). n=3 wells per condition. h) Summary data of changes in all detected lipid classes in reactive vs control iAstrocytes (ApoE4). N=4, two independent experiments from two ApoE4 lines. (Kolf2.1J set #1). i) Fold change of phospholipid, triacylglyceride or cholesterol ester species with indicated number of double bonds in reactive vs control iAstrocytes (ApoE4). All experiments presented in H are included here. Mean. j) Relative membrane MHC I levels (stained for anti-HLA-A,B,C) by flow cytometry in reactive vs control iAstrocytes (ApoE4). N=7, three or four independent experiments from two ApoE4 lines, Mean ****p<0.0001 one sample t-test. (Kolf2.1J set #1). In all panels open triangles or circles indicate mean per experiment, while solid dots represent all independent wells.
Extended Data Fig. 8
Extended Data Fig. 8. Mouse reactive vs control lipidomics analysis.
a) Representative image of purified mouse astrocytes. scale bar = 50μm. b) Relative mRNA expression of indicated genes in mouse astrocytes after treatment with the reactive cocktail analyzed by qPCR. N=3 mice. Mean + sem. c) Scatterplot presents log2fold change of individual lipid species in Kolf2.1J set #1 iAstrocytes vs mouse astrocytes. Both run in the same lipidomics batch to allow for direct comparison. N=4 for mice, n=3 (replicate wells) for iAstrocytes. d) Volcano plots present log2fold change of individual lipid species in reactive vs control astrocytes in mouse astrocytes cultured in FBS with 24h FBS removal (as for human astrocytes), mouse astrocytes that never saw FBS and Kolf2.1J iAstrocytes (ApoE3 from set #1) treated with TNF/Il-1α/C1q. N=4 for mice, n=3 (replicate wells) for iAstrocytes. e) Summary data of changes in all detected lipid classes in reactive vs control astrocytes of indicated datasets, corresponding to the data shown in D. Median + IQR. *P<0.05 paired t-test or paired Mann Whitney U test with Benjamini Hochberg correction. N=4 for mice, n=3 (replicate wells) for iAstrocytes. f) Fold change of phospholipid species with indicated number of double bonds in reactive vs control astrocytes of indicated datasets, corresponding to data shown in D. Mean. In all panels open circles and triangles indicate mean per experiment, while solid dots represent all independent wells.
Extended Data Fig. 9
Extended Data Fig. 9. Extended proteomic analysis of reactive human iAstrocytes.
a) Venn diagram depicting the number of proteins that were significantly downregulated >1.25 fold (>0.3 log2fold) in reactive Kolf2.1J set #1, BIONi037 and both iAstrocytes. Top 10 (non-significant) enriched Reactome pathways detected by overrepresentation analysis are plotted. b) Heatmap shows the log2fold change of all proteins significantly upregulated >1.5 fold in both Kolf2.1J and BIONi037 reactive astrocytes. Next to it are the log2fold change values of these proteins in ApoE4 vs ApoE3 iAstrocytes. c) Heatmap shows the log2fold change of all proteins significantly downregulated >1.5 fold in Kolf2.1J and BIONi037 reactive astrocytes and the log2fold change values of these proteins in ApoE4 vs ApoE3 iAstrocytes. BIONi037 (B037) and Kolf2.1J (K2.1J).
Extended Data Fig. 10
Extended Data Fig. 10. Cholesterol regulates astrocyte reactivity extended data.
a) STRING analysis of all proteins significantly upregulated >1.5 fold in Kolf2.1J and BIONi037 reactive astrocytes (dataset from proteomics in Fig. 5). Zoom in shows cluster of proteins related to cholesterol metabolism. b) Normalized Il-6 secretion in iAstrocytes (ApoE3), pre-treated with vehicle or avasimibe (0.5μM) for one hour and then treated for 24 hours with vehicle, cholesterol (50μM) or cholesterol + avasimibe. N=6, four or two independent experiments from two ApoE3 lines, Mean *P<0.05, ***P<0.001 one sample t-test for Chol and Ava + Chol vs 1. *P<0.05 t-test for Chol vs Ava + Chol with Benjamini-Hochberg correction on the three p-values. c) Relative mRNA expression of indicated genes after cholesterol (10μM) + avasimibe (0.5μM) treatment vs control, quantified by qPCR. N=5, two or three independent experiments from two ApoE3 lines, Mean + sem *P<0.05 one sample t-test with Benjamini-Hochberg correction on the p-values. d) Volcano plots represent log2fold change of individual lipid species in cholesterol treated vs control iAstrocytes in three independent replicate lipidomics experiments (BIONi037-A). e) Summary data of changes in all detected lipid classes in cholesterol vs control treated iAstrocytes (BIONi037-A). N=3 Median + IQR. Paired t-test or paired Mann Whitney U test with Benjamini Hochberg correction. f) Bar graphs of lipid classes in cholesterol vs control treated iAstrocytes from BIONi037-A background (% of total). All experiments presented in E are included here. Mean + sd. g-h) Fold change of phospholipid (g) and triacylglyceride (h) species with indicated number of double bonds in cholesterol treated vs control iAstrocytes (BIONi037-A). All experiments presented in E are included here. Mean. In all panels open circles or triangles indicate mean per experiment, while solid dots represent all independent wells.

Update of

References

    1. Yoon, J. H. et al. Brain lipidomics: from functional landscape to clinical significance. Sci. Adv.8, 9317 (2022). - PMC - PubMed
    1. Kollmann, K. et al. Cell biology and function of neuronal ceroid lipofuscinosis-related proteins. Biochim. Biophys. Acta1832, 1866–1881 (2013). - PubMed
    1. Vance, J. E. Lipid imbalance in the neurological disorder, Niemann–Pick C disease. FEBS Lett.580, 5518–5524 (2006). - PubMed
    1. Chan, R. B. et al. Comparative lipidomic analysis of mouse and human brain with Alzheimer disease. J. Biol. Chem.287, 2678–2688 (2012). - PMC - PubMed
    1. de Leeuw, S. M. et al. APOE2, E3, and E4 differentially modulate cellular homeostasis, cholesterol metabolism, and inflammatory response in isogenic iPSC-derived astrocytes. Stem Cell Rep.17, 110 (2022). - PMC - PubMed

LinkOut - more resources