. 2025 Oct;57(10):2456-2467.
doi: 10.1038/s41588-025-02321-z. Epub 2025 Sep 22.

Rapid epigenomic classification of acute leukemia

Affiliations

Rapid epigenomic classification of acute leukemia

Til L Steinicke et al. Nat Genet. 2025 Oct.

Abstract

Acute leukemia requires precise molecular classification and urgent treatment. However, standard-of-care diagnostic tests are time-intensive and do not capture the full spectrum of acute leukemia heterogeneity. Here, we developed a framework to classify acute leukemia using genome-wide DNA methylation profiling. We first assembled a comprehensive reference cohort (n = 2,540 samples) and defined 38 methylation classes. Methylation-based classification matched standard-pathology lineage classification in most cases and revealed heterogeneity in addition to that captured by genetic categories. Using this reference, we developed a neural network (MARLIN; methylation- and AI-guided rapid leukemia subtype inference) for acute leukemia classification from sparse DNA methylation profiles. In retrospective cohorts profiled by nanopore sequencing, high-confidence predictions were concordant with conventional diagnoses in 25 out of 26 cases. Real-time MARLIN classification in patients with suspected acute leukemia provided accurate predictions in five out of five cases, which were typically generated within 2 h of sample receipt. In summary, we present a framework for rapid acute leukemia classification that complements and enhances standard-of-care diagnostics.


Conflict of interest statement

Competing interests: C.S. discloses advisory honoraria from AbbVie, Astellas, AstraZeneca, BMS, Laboratories Delbert, Jazz Pharmaceuticals, Novartis, Otsuka, Pfizer and Roche, institutional research support from Jazz Pharmaceuticals and travel grants from AbbVie, BMS, Jazz Pharmaceuticals and Pfizer. E.C.C. discloses advisory honoraria from AbbVie, Merck, ImCheck, Rigel, Guidepoint, Trinity Health Sciences and GLG, and research support from AbbVie. G.K.G. receives research support from Calico Life Sciences. The other authors declare no competing interests.

Figures

Fig. 1
Fig. 1. DNA methylation-based classification of acute leukemia.
a, Overview of acute leukemia reference cohort shown as a t-SNE dimensionality reduction with samples colored by methylation class (n = 38). The legend at the left of the figure shows grouped methylation classes. Top right shows cohort composition by array version and immunophenotype; bottom right shows dataset origin, the number of samples per dataset and age group. b. t-SNE as in a colored by tissue type. c. t-SNE colored by average global methylation level. d. t-SNE colored by immunophenotype with concordant and discordant cases colored separately (left). Stacked bar plots showing the percentage of immunophenotypes for samples in methylation classes BCL11B-activated ALAL, HOXA9-activated T-ALL, KMT2A-r B-ALL and ZNF384-r B-ALL (right). NA, not available. Source data
Fig. 2
Fig. 2. Characterization of AML methylation classes.
a, Subsection of the t-SNE dimensionality reduction as in Fig. 1a showing only AML classes, with cases colored by methylation class-defining genetic alterations. b, t-SNE as in a, colored for FAB classification. c, t-SNE as in a, colored for expression of HOXA9 (left) and HOXB5 (right). d, t-SNE as in a, colored for genetic alterations common to HOX-activated AML. Source data
Fig. 3
Fig. 3. HOX-activated AML methylation classes.
a, Pie charts showing genetic alterations for samples in HOX groups 1 (left), 2 (middle) and 3 (right). Primary mutations (for example, in NPM1) are indicated in the outer circle, while co-mutations in TET2, IDH1, IDH2 and DNMT3A are indicated in the inner circle. b, Pie chart as in a for samples in HOXA/B-activated group 4. c, Pie charts as in a, but for samples in HOXA groups 5–9. d, Oncoplot showing genetic alterations, clinical characteristics and expression of key genes across HOX groups 5–9 in samples from the TARGET AML0531 and AML1031 studies. e, Kaplan–Meier plot showing all cases in HOX groups 5–9 stratified by methylation class. Log-rank test P value is shown. f, Kaplan–Meier plot showing KMT2A::MLLT3 cases in HOX groups 5, 7 and 8 stratified by methylation class. Log-rank test P values are shown, without adjustment for multiple comparisons. Source data
Fig. 4
Fig. 4. Development of the MARLIN classifier.
a, Schematic of MARLIN training and performance estimation. Cutout shows the reference cohort from Fig. 1a. Reference methylation array beta values are binarized, 50 samples for each class are randomly selected and 10% artificial noise is added to the data. Fivefold cross-validation is performed to estimate model performance at different levels of sparsity in the test sets. b, Schematic depicting MARLIN neural network architecture. The network is composed of an input layer equal to the number of probes in the reference (357,340), two hidden layers with 256 and 128 nodes and a final layer for the multiclass classification represented by 42 nodes. A 99% dropout is applied to the input layer only during training at each epoch (left). MARLIN generates scores corresponding to methylation class probabilities. Scores sum up to 1 across classes (right). Methylation class colors are the same as in Fig. 1a.
Fig. 5
Fig. 5. Validation of MARLIN in external datasets.
a, Confusion matrix obtained during the fivefold cross-validation, using all available methylation values. Rectangles represent methylation class families HOXA, HOXA/B, myelodysplasia AML and Ph/PAX5 B-ALL. b, Heatmap showing multi-platform external validation of acute leukemia cases driven by specific genetic alterations. Samples were profiled by 27k array (n = 58), 450k array (n = 4), whole-genome bisulfite sequencing (WGBS; n = 11) or nanopore sequencing (n = 2). c, Heatmap showing external validation of B-ALL cases associated with class-defining genetic alterations (n = 182). The color scale indicates MARLIN prediction scores. All samples were profiled using 450k arrays. d, Heatmap showing external validation of T-ALL cases (n = 39). e, Heatmap showing MARLIN predictions for healthy blood controls (n = 100). PB, peripheral blood. Source data
Fig. 6
Fig. 6. Analysis of a retrospective patient cohort sequenced with nanopore.
a, Overview of the retrospective acute leukemia patient cohort (n = 19). Patients previously underwent conventional diagnosis (left) and were subjected to nanopore profiling and MARLIN classification (right). b. Bar plots show the number of covered reference CpGs and MARLIN prediction scores for 19 samples of the retrospective acute leukemia cohort. Patient characteristics are indicated in the table on the left. Methylation classes with the highest score are indicated on the right. The top eight rows represent samples for which nanopore profiling resulted in a concordant methylation class that was equivalent to the clinical diagnosis. The subsequent seven rows represent samples for which MARLIN analysis resulted in a refinement of the clinical diagnosis. Analysis of the next three samples did not yield a clear methylation class prediction (score of <0.8). However, methylation classes with the highest scores were concordant with clinical diagnosis, and lineage and/or methylation class family predictions were obtained with high confidence. The bottom row represents a sample for which MARLIN analysis yielded a discordant methylation class prediction with high confidence. c, IGV visualization of reads supporting a RUNX1::RUNX1T1 fusion in AL_010. Reads are sorted by sample ID and colored by strand. d, IGV visualization as in c but for PML::RARA in AL_024. e, IGV visualization as in c but for DUX4-r in AL_002. Multiple copies of DUX4 exist in a repeat array on chromosome 4. Only one copy of DUX4 is translocated to the IGH locus. t-AML, therapy-related AML; BM, bone marrow; PF, pericardial fluid. Source data
Fig. 7
Fig. 7. Real-time classification of the first prospective case.
a, Timeline for patient RTC_001 from sample collection to diagnosis using rapid epigenomic classification (left) and conventional diagnostics (right). CNV, copy-number variation. b, Line graph showing real-time MARLIN prediction scores. Lines and colors correspond to different methylation classes; dashed lines show a probability threshold at 0.8. A classification was obtained after 40 min of sequencing. Methylation class colors are the same as in Fig. 1a. c, Images show Wright–Giemsa staining of diagnostic bone marrow aspirate (n = 1) and zoom in on blasts (left). Image on the right shows hematoxylin and eosin (H&E) staining of the same bone marrow core biopsy. Scale bars, 10 μm (Wright–Giemsa) and 20 μm (H&E). d, Flow cytometry plot showing results for blast population identification based on the expression of myeloid markers CD13 and CD34. Complete gating strategy is provided in Extended Data Fig. 9d. e, Images showing immunohistochemistry analysis of diagnostic bone marrow core biopsy stained for CD34 (n = 1) and P53 (n = 1). Scale bars, 20 μm. f, Copy-number variation profile obtained after 72 h of nanopore sequencing. Dots represent bins of 1 Mb in size, and orange lines represent genomic segments. Source data
Fig. 8
Fig. 8. Real-time classification of a second prospective case.
a, Diagnostic timeline for patient RTC_002. b, Line graph showing MARLIN prediction scores. A classification was obtained after 40 min of sequencing. c, Flow cytometry plots showing blast population identification based on SSC-A and CD45 expression and myeloid markers CD33 and CD64 expression. CD33high/CD64high cells (orange) represent mature monocytes; CD33low/CD64low cells (red) represent mature lymphocytes, CD33dim/CD64dim cells represent a blast population of monocytic origin (blue). Complete gating strategy is provided in Extended Data Fig. 9g. SSC, side scatter. d, Images show diagnostic Wright–Giemsa staining (n = 1) and H&E staining (n = 1) of the bone marrow core biopsy. Scale bars, 10 μm (Wright–Giemsa) and 20 μm (H&E). e, IGV visualization showing nanopore reads supporting a FLT3 internal tandem duplication (ITD). f. Protein paints of TET2 (top) and NPM1 (bottom) showing mutations detected using gene panel sequencing. Variant allele frequencies are indicated in brackets. Fill colors of the protein paint indicate protein domain. Source data
Extended Data Fig. 1
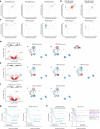
Extended Data Fig. 1. Construction of the acute leukemia reference cohort.
a. t-SNE dimensionality reduction of the acute leukemia reference cohort colored by data source. b. Similar to panel (a) but colored by array type. c. Table showing the origin of methylation classes (left) and what they are named in this work (right). The left part of the table is further divided by study origin. d. Unsupervised clustering of all samples with Ph/Ph-like or CRLF2-r in original annotation to determine initial samples for the methylation classes Ph/Ph-like and CRLF2-r/Ph-like. e. Unsupervised clustering of all samples with PAX5alt or PAX5 P80R in original annotation to determine initial samples for the methylation classes PAX5 Group A and PAX5 Group B. f. Unsupervised clustering of infant KMT2A-r FAB classification M4 or M5 AML excluding cases with KMT2A-MLLT10/MLLT3 to determine initial samples for the methylation classes HOXA-activated Group 8 and HOXA-activated Group 9. g. t-SNE dimensionality reduction with samples colored by initial labels from panel (c). h. Semi-supervised clustering workflow. Over 100 iterations, the algorithm’s four key steps (i) subsampling, (ii) construction of correlation matrix, (iii) graph construction from correlation matrix, and (iv) label propagation are repeated. i. Bar plots showing the percentual class assignment for each sample over the 100 iterations (top). Class assignment algorithm is shown below (bottom). j. t-SNE dimensionality reduction colored by final class labels (same as Fig. 1a). k. Similar to panel (a) but colored by predicted sex. Source data
Extended Data Fig. 2
Extended Data Fig. 2. Comparison between lineage and methylation class.
a. Stacked bar plots showing lineage concordance by lineage (left), dataset (middle) and age group (right). Fractions are colored by immunophenotype with concordant and discordant cases colored separately. b. Visualization of lineage discordant cases. Out of the 60 lineage discordant cases, 49 were in the methylation classes ZNF384-r B-ALL (n = 4), HOXA9-activated T-ALL (n = 23), BCL11B-activated ALAL (n = 17), KMT2A-r B-ALL (n = 5). Sankey plots compare diagnosed immunophenotypes and study within those four methylation classes. We found that the lineage discordance was across a broad range of immunophenotypes and studies for the four classes. Highlighting that lineage discordance is not due to isolated studies, and that methylation patterns are robust between independent studies. c. Pie charts showing genetics of lineage discordant cases inside ZNF384-r, HOXA9-activated T-ALL, BCL11B-activated, and KMT2A-r B-ALL classes. We found characteristic lineage ambiguous alterations inside each class, including ZNF384-r (n = 3, methylation class ZNF384-r), PICALM::MLLT10 (n = 10, methylation class HOXA9-activated T-ALL), BCL11B (n = 6, methylation class BCL11B-activated), and KMT2A-r (n = 4, methylation class KMT2A-r B-ALL). d. Visualization of lineage ambiguous genetics specific to methylation classes. The top part shows all samples with known ZNF384-r, PICALM::MLLT10, BCL11B alteration, and KMT2A-r visualized on the t-SNE from Fig. 1a. The bottom part compares methylation class (rows) to immunophenotype (columns). We found that ZNF384-r, PICALM::MLLT10, and BCL11B are specific to the methylation classes ZNF384-r, HOXA9-activated T-ALL, and BCL11B-activated. Contrarily, KMT2A-r are genetic alterations that occur in several methylation classes across lineages. e. For cases within the BCL11B-activated methylation class, we wanted to see if we could verify their status as BCL11B-activated leukemia. Therefore, we first looked for BCL11B enhancer tandem amplification (BETA) in the copy-number profile of newly classified patients in the methylation class BCL11B-activated. BETA is a characteristic genetic event occurring in about 20% of BCL11B-activated leukemia. We could confirm BETAs in 2/13 newly classified patients (15.4%). f. Comparison of BCL11B gene expression between AML, B-ALL, T-ALL, and BCL11B-activated methylation class samples across four cohorts (Alexander et al, TARGET AML0531, TARGET AML1031, Giacopelli/BeatAML). Boxplots depict the interquartile range (IQR, 25th to 75th percentiles) with central lines indicating median values. Whiskers extend to the most extreme data points that are no more than 1.5 × IQR from the respective quartile boundary. Individual points beyond the whiskers represent outliers. We found that samples inside the BCL11B-activated methylation class show strong expression of BCL11B in all four cohorts. Source data
Extended Data Fig. 3
Extended Data Fig. 3. Adult and pediatric acute myeloid leukemia in the methylation space.
a. Confusion matrix comparing AML methylation classes (columns) and common genetic alterations (AML). Boxes are colored by genetic alteration and color intensity is relative to abundance of genetic alteration per class. Numbers in boxes show the number of altered samples divided by the number of samples with available information. Statistically significance was determined by Chi-squared test followed by Benjamini-Hochberg adjustment for multiple comparisons to calculate q-values (*q < 0.05,**q < 0.01,***q < 0.001, ****q < 0.0001; see row names). For significantly different mutated genes, post-hoc analysis was performed to assess which methylation classes were differentially mutated. Here, one-sided Fisher’s exact test was performed followed by Benjamini-Hochberg adjustment for multiple comparisons to calculate q-values (*q < 0.05,**q < 0.01,***q < 0.001, ****q < 0.0001). b. t-SNE dimensionality reduction of AML classes colored by age groups. AYA, adolescents and young adults. c. Boxplots showing age distribution by methylation class. Boxplots depict the interquartile range (IQR, 25th to 75th percentiles) with central lines indicating median values. Whiskers extend to the most extreme data points that are no more than 1.5 × IQR from the respective quartile boundary. Individual points beyond the whiskers represent outliers. d. Kaplan-Meier plots with log-rank test P value showing survival for PML::RARA, CBFB::MYH11, RUNX1::RUNX1T1 and CEBPA methylation classes in adult (left) and pediatric (middle) cohorts. These favorable-risk genotypes exhibit improved survival compared to other genotypes, and as such patients in the methylation classes also show favorable outcomes (P = 4.4e-9,P = 1e-13, respectively). The right panel shows a Kaplan-Meier plot with log-rank test P value comparing survival for patients in the methylation classes ETV6::MNX1, HNRNPH1::ERG, AMKL-mixed, GLIS-r and FUS-r. Source data
Extended Data Fig. 4
Extended Data Fig. 4. Analysis of CEBPA methylation class and myelodysplasia-related methylation classes.
a. t-SNE dimensionality reduction of AML classes highlighting CEBPA altered samples (left). Details of genetic alterations detected in 13 CEBPA mutated samples outside the CEBPA methylation class are provided in the table on the right. b. t-SNE dimensionality reduction of AML classes colored by FLT3-ITD or activating FLT3-PM. c. Kaplan-Meier plots comparing survival of samples with verified basic leucine zipper (bZIP) domain indel or biallelic CEBPA mutations to all other samples in the CEBPA methylation class for pediatric (left) and adult cohorts (right). Log-rank test P value is shown. d. Kaplan-Meier plots comparing survival of samples in CEBPA methylation class to CEBPA-mut samples outside the methylation class for pediatric (left) and adult (right) cohorts. Log-rank test P value is shown. e. t-SNE dimensionality reduction of AML classes colored by myelodysplasia genetics. In the IDH-enriched methylation class, mutations in IDH1 or IDH2 were found in nearly all cases (14/15, 93.3%, also see Extended Data Fig. 3a). However, IDH1 and IDH2 mutations were also found recurrently in several other classes, including HOX-activated AML. Similarly, the Chromatin/spliceosome-enriched methylation class was enriched for mutations in DNMT3A, chromatin regulators and/or spliceosome genes, but these alterations were also recurrently found in several other classes (IDH-enriched, TP53/aneuploidy-enriched, and HOX-activated). Lastly, the TP53/aneuploidy-enriched methylation class had frequent TP53 alterations (22/75, 29.3%) and copy-number changes such as deletions of chromosome 5/5q (24/84, 28.6%) or chromosome 7/7q (31/84, 36.9%). However, this class also contained a significant number of TP53 wild-type cases (53/75, 70.7%) and contained other alterations associated with myelodysplasia-related AML and adverse prognosis, including MECOM rearrangements (9/67, 13.4%) and RUNX1 mutations (18/74, 24.3%). f. t-SNE of AML methylation classes with samples colored by AML with myelodysplasia-related changes (AML-MRC) status according to WHO2016 and whether they are inside or outside of MDS-associated methylation classes. g. Barchart showing the number of WHO2016 AML-MRC cases by methylation class. h. Kaplan-Meier plots comparing survival for patients in the methylation classes IDH-enriched, Chromatin/spliceosome-enriched, and TP53/aneuploidy-enriched. Outcomes for the TP53/aneuploidy-enriched and Chromatin/spliceosome-enriched methylation classes are particularly poor (median overall survival of 0.69 and 0.98 years, respectively). Log-rank test P value is shown. Source data
Extended Data Fig. 5
Extended Data Fig. 5. Gene expression and survival analysis for HOX-activated methylation classes.
a. Scatterplots showing HOXA9 and HOXB5 expression for samples with available RNAseq data in HOXA/B-activated Groups 1 to 3. Samples are colored by HOX activating genetic alteration (see Fig. 2d). b. Scatterplot as in panel (a) for HOXA/B-activated Group 4. c. Scatterplot as in panel (a) for HOXA Groups 5 to 9. d. Volcano plots depicting differential gene expression analysis between HOXA-activated Group 5 vs others (left). Wald test P value followed by adjustment for multiple comparisons using the Benjamini-Hochberg procedure is shown on the y-axis. We observed specific expression of MECOM, which is associated with adverse prognosis. The middle and right panel show a t-SNE dimensionality reduction of AML classes colored by expression of MECOM (middle) and PRDM16 (right). PRDM16 is a MECOM paralog that has been shown to be a poor prognostic factor in pediatric AML. Strong PRDM16 expression can be found in HOXA/B Groups 1 and 4. Interestingly, 22 KMT2A-r were found in HOXA/B-activated Group 4, which show strong MECOM, and no PRDM16 expression. Hinting at potential similarities between KMT2A-r in HOXA-activated Group 5 and HOXA/B-activated Group 4. e. Same as in panel (e) but differential gene expression is between HOXA Groups 6-8 vs others. We found specific expression of HMX3, which has been described as a vulnerability in KMT2A-r acute leukemia. The three right panels highlight expression patterns for HMX2, HMX3, and LAMP5. f. Same as in panel (e) but differential gene expression is between HOXA-activated Group 9 vs others. We observed specific expression of the transcription factor FOXC1, which has been implicated in a maturation block in AML. The three right panels highlight expression patterns for FOXC1 and USP44. g. Kaplan-Meier plot comparing survival for patients in the methylation classes HOXA Groups 5 to 9, filtered by patients in TARGET0531 (left) or TARGET1031 (right). Log-rank test P value is shown. h. Kaplan-Meier plot comparing survival for patients in the methylation classes HOXA Groups 5 to 9, stratified by methylation class (left) and by gene fusion (right). Filtered for samples with full fusion information. Log-rank test P value is shown. Source data
Extended Data Fig. 6
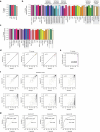
Extended Data Fig. 6. MARLIN performance estimation at different levels of sparsity.
a. Bar plots showing MARLIN performance as measured by F1 scores for each lineage. b. Bar plots for F1 scores as in panel (a) but for methylation classes. Methylation classes belonging to the same family are annotated. c. Bar plots for F1 scores as in panel (a) but for methylation classes and families. Methylation class families are shaded in gray. d. Scatterplots comparing F1 score per class between full data (sparsity 0, x-axis) and with increasing levels of sparsity (sparsity 0.97 - 0.99, y-axis). Pearson’s correlation coefficient is shown on the top left. e. Summary of Pearson correlation coefficient of F1 scores between no sparsity (y-axis) and increasing levels of sparsity (x-axis). Purple line shows dropoff at 97% sparsity. f. Scatterplots comparing maximum prediction score per sample between full data (sparsity 0, x-axis) and with increasing levels of sparsity (sparsity 0.25 - 0.99, y-axis). Pearson’s correlation coefficient is shown on the top left. g. Receiver operating characteristic (ROC) curves comparing false positive rate (1-specificity, x-axis) and true positive rate (sensitivity, y-axis) at different prediction cut-offs for different sparsity levels. The optimal prediction cut-off that maximizes the Youden index is shown for each level of sparsity. Source data
Extended Data Fig. 7
Extended Data Fig. 7. Details of the retrospective acute leukemia nanopore cohort.
a. Chart showing immunophenotyping assessment for 18 samples of the retrospective cohort. b. Photograph showing the nanopore sequencing setup. On the right are the GridION and PromethION 2 Solo instruments. The monitor on the left displays the output of the real-time MARLIN prediction. c. Protein paint for mutations detected in AL_014 by gene panel sequencing. d. Copy-number profiles of the retrospective nanopore cohort at 1Mb-resolution. Orange lines indicate results from automated segmentation.
Extended Data Fig. 8
Extended Data Fig. 8. Additional retrospective acute leukemia, MDS and healthy control nanopore samples.
a. Chart showing immunophenotyping assessment for 15 acute leukemia samples of the multiplexed retrospective cohort. b. Predicted methylation classes for acute leukemia samples with a classification score of ≥0.8 overlaid on t-SNE visualization of the reference cohort. c. Bar plots show the number of covered reference CpGs and MARLIN prediction scores for 15 samples of the multiplexed retrospective acute leukemia cohort. Patient characteristics are indicated in the table on the left. Methylation classes with the highest score are indicated on the right. Concordance of MARLIN predictions with conventional diagnostics is visualized with an icon (see legend at the bottom of the panel). Notably, despite the multiplexed approach, the median number of covered reference CpGs was comparable to our initial cohort (309,066 vs. 324,990, respectively) due to the higher output of the PromethION platform. Among cases that did not reach the methylation class prediction threshold, 2/5 (AL_029 diagnosed as B-ALL Ph + , AL_036 diagnosed as AML-MRC) surpassed the prediction threshold on the methylation class family level (indicated by dotted lines) and the methylation class with the highest score was concordant with initial diagnosis in both cases (B-ALL Ph/Ph-like and AML TP53/aneuploidy-enriched, respectively). One case (AL_039 diagnosed as AML-MRC) received the highest score for HOX Grp 3 AML, coherent with a TP53-mut and structural alterations involving chromosome 11q23 (harbouring KMT2A). d. Bar plots show MARLIN prediction results for healthy donor bone marrow and whole blood samples. All ten samples have one of the control classes as the highest scoring methylation class. e. Bar plots show MARLIN prediction results for 6 MDS donor bone marrow and whole blood samples. Source data
Extended Data Fig. 9
Extended Data Fig. 9. Simulation of real-time MARLIN predictions and prospective cohort details.
a. Line plot shows simulated real-time MARLIN predictions (only scores ≥ 0.8) on the first retrospective acute leukemia cohort (n = 14). One line for the final classification is shown per sample. Bar plots on the right display the timepoint at which samples reach the final prediction and the average number of covered CpGs over time. b. Line plots show in-silico real-time prediction scores for AL_001 and AL_007 over 72 hours (4,320 minutes). Scores for all methylation classes are shown. Neither sample received a high-confidence prediction score after 72 hours, but both samples briefly reached the threshold at the beginning of sequencing (shortly after 60 minutes). This pattern was not observed in any of the other samples. c. Line plot shows real-time MARLIN prediction for re-sequencing of sample AL_016. Scores for all methylation classes are shown. d. Gating strategy for RTC_001. Raw flow cytometry data were obtained from diagnostic assessment. Total events (368,077 events) were gated using SSC-A and FSC-A to remove debris and doublets. Singlets (236,786 events) were further gated based on SSC-A and the leukocyte common antigen CD45 to identify mature monocytes (SSC-Alow, CD45high), mature lymphocytes (SSC-Ahigh, CD45high) and blasts (SSC-Ahigh, CD45low; 146,427 events). Chart below summarizes immunophenotype results from flow cytometry assessment. e. Protein paint of TP53 mutation detected in RTC_001 by panel sequencing (top) and IGV visualization of TP53 mutation detected using deep nanopore sequencing (bottom). f. Karyotyping results indicate complex copy-number changes and rearrangements. g. Gating strategy for RTC_002. Raw flow cytometry data were obtained from diagnostic assessment. Total events (265,736 events) were gated using SSC-A and FSC-A to remove debris and doublets. Singlets (241,023 events) were further gated based on the myeloid-lineage markers CD14 and CD13 to identify mature lymphocytes (CD14low, CD13low), mature monocytes (CD14high, CD13high) and blasts (CD14low, CD13dim; 219,887 events). Chart below summarizes immunophenotype results from flow cytometry assessment. h. IGV visualization of nanopore reads supporting mutations in TET2 and NPM1, and protein paint of a 51-bp internal tandem duplication affecting FLT3 detected by conventional panel sequencing (bottom left). i. Copy-number profile showing no discernible alterations (top), supporting results obtained by karyotyping (bottom).
Extended Data Fig. 10
Extended Data Fig. 10. Additional real-time classification patients.
a. Timeline for RTC_003 from sample collection to diagnosis using rapid epigenomic classification and conventional diagnostics (top panel). Line graph shows real-time MARLIN prediction scores for the different methylation classes. Dashed horizontal line indicates classification threshold at 0.8 (middle). Copy-number profile generated from nanopore sequencing (bottom). Flow cytometry and aspirate evaluation on day one and day four established an AML diagnosis. Cytogenetic analysis on day two indicated a gain of chromosomes 11 and 13, while gene panel sequencing revealed mutations in ASXL1, ETNK1, IDH1, NRAS, RUNX1, SETBP1 and SRSF2 on day twelve, resulting in a conventional diagnosis of AML with myelodysplasia-related changes. MARLIN briefly reached scores above the confidence threshold for the IDH-enriched AML methylation class, before changing towards the related HOXA/B-activated Group 3 (NPM1, IDH-enriched) methylation class upon deeper sequencing (passing the confidence threshold after 590 minutes). We therefore recommend monitoring real-time MARLIN scores until predictions stabilize. Both classifications were compatible with pathology findings showing AML with myelodysplasia-related mutations, an IDH1 hotspot mutation, and gain of chromosome 11 (harbouring KMT2A), although canonical HOX-associated alterations were not identified. b. Timeline, real-time MARLIN prediction, and copy-number profile for RTC_004. Flow cytometry results on day two showed a mixed phenotype, while aspirate evaluation on day three indicated an ETP-ALL immunophenotype. Gene panel sequencing on day 4 revealed mutations in JAK3 (x2), NOTCH1 (x5) and NRAS. Results from cytogenetics on day 22 revealed a complex karyotype. The final clinical diagnosis was Early T-cell precursor (ETP) lymphoblastic leukemia. In alignment with these results, MARLIN resulted in a high-confidence prediction for HOXA9-activated T-ALL, an ETP-like methylation class, after 50 minutes of sequencing and 96 minutes in total. c. Timeline, real-time MARLIN prediction, and copy-number profile for RTC_005. Flow cytometry on day one and aspirate evaluation on day five established a diagnosis of AML. Gene panel sequencing results on day four revealed mutations in ASXL1, EZH2, NRAS, RUNX1, and ZRSR2. Cytogenetics on day four showed a trisomy 8. The final clinical diagnosis was AML with myelodysplasia-related changes. MARLIN yielded a concordant classification of Chromatin/spliceosome-enriched AML, after 90 minutes of sequencing, and 135 minutes in total.

References

    1. Alaggio, R. et al. The 5th edition of the World Health Organization Classification of Haematolymphoid Tumours: Lymphoid Neoplasms. Leukemia36, 1720–1748 (2022). - PMC - PubMed
    1. Arber, D. A. et al. International Consensus Classification of myeloid neoplasms and acute leukemias: integrating morphologic, clinical, and genomic data. Blood140, 1200–1228 (2022). - PMC - PubMed
    1. Khoury, J. et al. The 5th edition of the World Health Organization Classification of Haematolymphoid Tumours: Myeloid and Histiocytic/Dendritic Neoplasms. Leukemia36, 1703–1719 (2022). - PMC - PubMed
    1. Weinberg, O. K. et al. The International Consensus Classification of acute leukemias of ambiguous lineage. Blood141, 2275–2277 (2023). - PubMed
    1. Chang, T.-C. et al. Genomic determinants of outcome in acute lymphoblastic leukemia. J. Clin. Oncol.42, 3491–3503 (2024). - PMC - PubMed

LinkOut - more resources