. 2025 Sep 22;23(1):518.
doi: 10.1186/s12916-025-04359-6.

Inhibition of GCKIII kinases STK25 and MST3 mitigates organ lipotoxicity and enhances metabolic resilience under nutritional stress

Affiliations

Inhibition of GCKIII kinases STK25 and MST3 mitigates organ lipotoxicity and enhances metabolic resilience under nutritional stress

Emma Andersson et al. BMC Med. .

Abstract

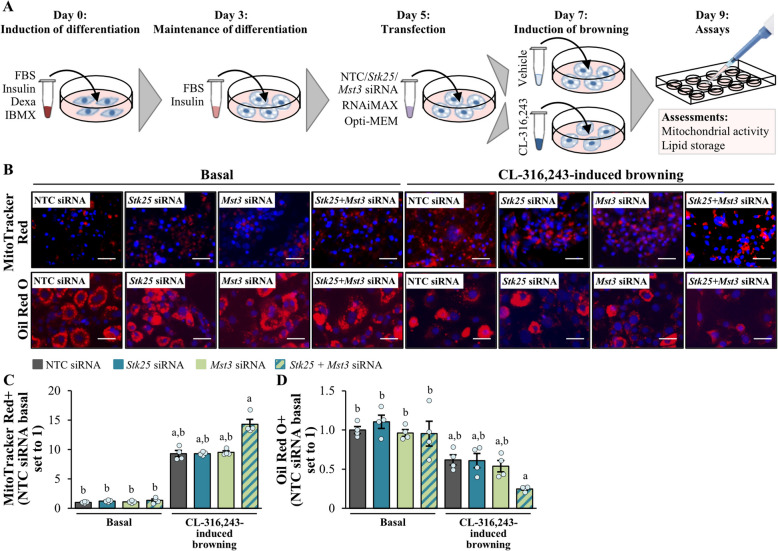
Background: Obesity has reached pandemic proportions, highlighting the urgent need for continued research to uncover the molecular mechanisms governing lipid homeostasis and ectopic fat deposition in overnutrition. Our recent translational studies demonstrated that STE20-type kinases STK25 and MST3 associate with intracellular lipid droplets and play a pivotal role in regulating the dynamic balance between fat storage and utilization. This study aimed to assess the in vivo effects of the combined inhibition of STK25 and MST3 in obese mice.

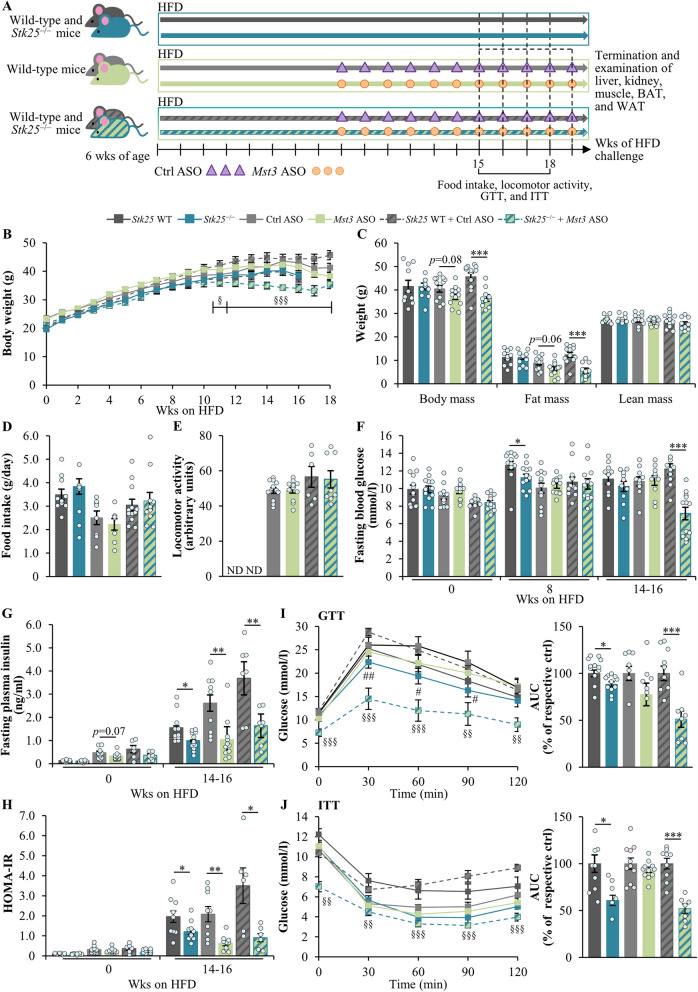
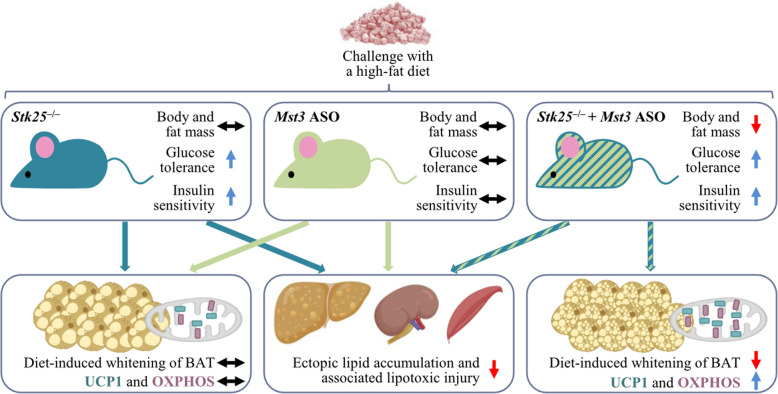
Methods: We performed phenotypic characterization in three cohorts of mice fed a high-fat diet: (1) mice with genetic ablation of Stk25, (2) mice treated with Mst3-targeting antisense oligonucleotide (ASO), and (3) mice depleted of both STK25 and MST3 by injecting Stk25-/- mice with Mst3 ASO. Whole-body metabolic physiology and organ lipotoxicity were examined in the STK25- and/or MST3-deficient mice compared with their respective controls by using histological assessments, immunofluorescence microscopy, molecular profiling, and biochemical assays.

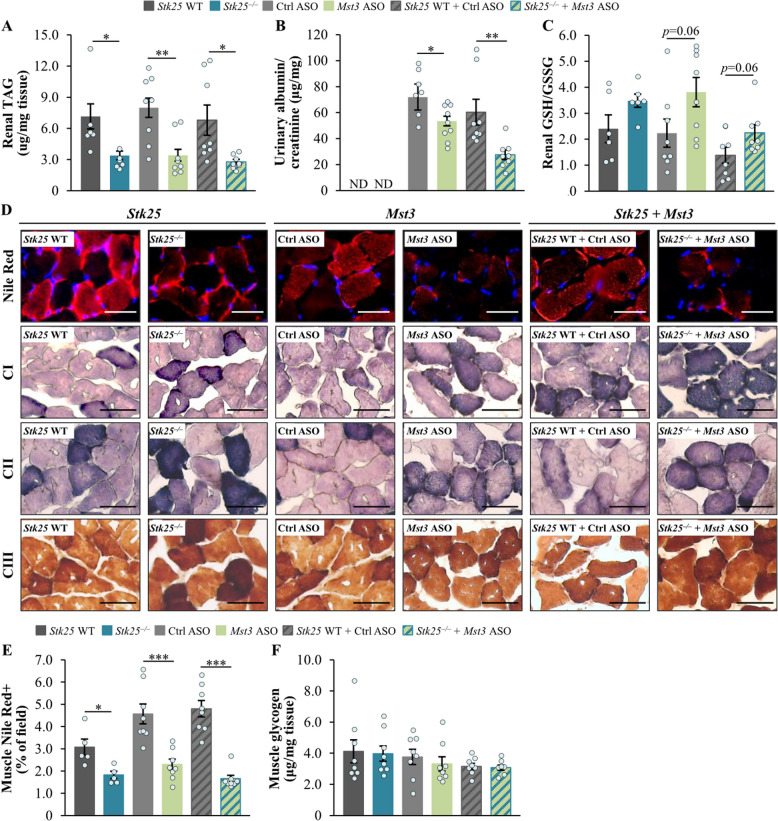
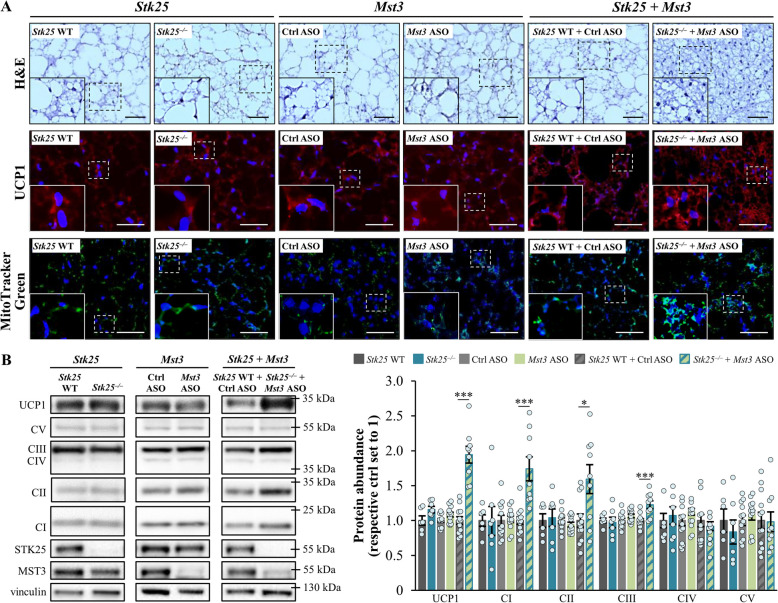
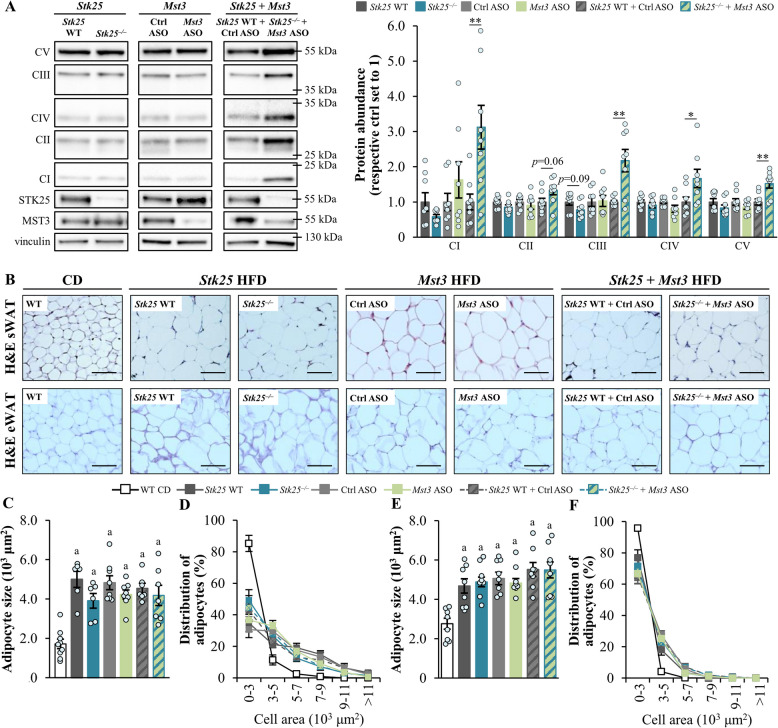
Results: We found that the inactivation of STK25 and MST3, either individually or in combination, provided equal protection against ectopic fat accumulation and associated lipotoxic damage in the liver, kidney, and skeletal muscle of obese mice. Strikingly, high-fat diet-fed STK25/MST3-deficient mice, but not mice lacking only one kinase, displayed reduced body and fat mass gain, which was accompanied by markedly increased abundance of thermogenesis markers in the brown adipose tissue (BAT).

Conclusions: Dual inhibition of STK25 and MST3 in mice mitigates obesity-triggered lipotoxic injury to metabolic tissues and elevates indicators of BAT thermogenic capacity.

Keywords: Lipotoxicity; Obesity; Oxidative phosphorylation; Thermogenic capacity.


Conflict of interest statement

Declarations. Ethics approval and consent to participate: The mice in this study were cared for in accordance with the National Institutes of Health (NIH; Bethesda, MD) guidelines as outlined in the Guide for the Care and Use of Laboratory Animals. All in vivo experiments adhered to protocols approved by the local Ethics Committee for Animal Studies at the Administrative Court of Appeals in Gothenburg, Sweden (approval numbers 5.8.18–382/2011, 5.8.18–17285/2018, and 5.8.18–20691/2023). Consent for publication: Not applicable. Competing interests: The authors declare no competing interests.

Figures

Fig. 1
Fig. 1
Dual inactivation of STK25 and MST3 decreases body weight and fat mass, and improves glucose and insulin homeostasis in obese mice. A Schematic overview of the experimental design. B Body weight curves. C Total, fat, and lean body mass measured by BCA. D Accumulated food consumption monitored per day. E Locomotor activity assessed by the open-field test. F–G Fasting circulating levels of glucose (F) and insulin (G). H HOMA-IR was calculated using the equation [fasting glucose (mg/dl) × fasting insulin (µU/ml)]/405. IJ Intraperitoneal GTT (I) and ITT (J); the area under the glucose curve in both tests is shown. Data are mean ± SEM from 6 to 13 mice per group. Values for Stk25 knockout mice and their wild-type littermates were extracted from the previous study [21]. AUC, area under the curve; Ctrl, control; HFD, high-fat diet; ND, not determined; Wks, weeks; WT, wild-type. *p < 0.05, **p < 0.01, ***p < 0.001 vs. respective controls; §p < 0.05, §§p < 0.01, §§§p < 0.001 for Stk25–/– + Mst3 ASO mice vs. respective controls; #p < 0.05, ##p < 0.01 for Stk25–/– mice vs. respective controls
Fig. 2
Fig. 2
Inhibition of STK25 and/or MST3 in high-fat diet-fed mice suppresses hepatic steatotoxicity. A Representative images of liver sections stained with H&E, Picrosirius Red, or DHE (red), or processed for immunofluorescence with anti-F4/80 (red), anti-fibronectin (green), or anti-KDEL (green) antibodies; nuclei stained with DAPI (blue; fluorescence images). Scale bar: 50 µm. B Quantification of hepatic TAG content. C–F Quantification of the fluorescence staining for F4/80 (C), fibronectin (D), DHE (E), and KDEL (F). G Assessment of MAS in H&E-stained liver sections (the values for the individual histological features of MAS are presented in Additional File 2: Supplementary Fig. S5). Data are mean ± SEM from 7 to 12 mice per group. CD, chow diet; Ctrl, control; HFD, high-fat diet; WT, wild-type. ap < 0.05 vs. chow-fed control mice, bp < 0.05 vs. respective controls
Fig. 3
Fig. 3
Depletion of STK25 and/or MST3 protects mice against high-fat diet-induced damage to the kidney or skeletal muscle. A Quantification of renal TAG content. B Measurement of urinary albumin to creatinine ratio (the values for each of the two parameters are presented in Additional File 2: Supplementary Fig. S7). C Assessment of the ratio of reduced to oxidized glutathione (GSH/GSSG) in kidney lysates. D Representative images of gastrocnemius skeletal muscle sections stained with Nile Red (red) or processed in enzymatic activity assays for OXPHOS complexes I, II, or III; nuclei stained with DAPI (blue; fluorescence images). Scale bars: 25 µm. E Quantification of Nile Red staining in skeletal muscle sections. F Measurement of glycogen content in skeletal muscle lysates. Data are mean ± SEM from 5 to 8 mice per group. CI-III, OXPHOS complexes I–III; Ctrl, control; ND, not determined; WT, wild-type. *p < 0.05, **p < 0.01, ***p < 0.001 vs. respective controls
Fig. 4
Fig. 4
Combined silencing of STK25 and MST3 in obese mice increases the indicators of thermogenic capacity in BAT. A Representative images of BAT sections stained with H&E or MitoTracker Green (green), or processed for immunofluorescence with anti-UCP1 antibodies (red); nuclei stained with DAPI (blue; fluorescence images). Scale bar: 50 µm. B BAT lysates were analyzed by Western blot using anti‑total OXPHOS antibody cocktail or antibodies specific for UCP1, STK25, or MST3. Protein levels were quantified by densitometry; representative Western blots are shown with vinculin used as a loading control. Data are mean ± SEM from 6 to 12 mice per group. CI-V, OXPHOS complexes I–V; Ctrl, control; WT, wild-type. *p < 0.05, ***p < 0.001 vs. respective controls
Fig. 5
Fig. 5
Dual inhibition of STK25 and MST3 in high-fat diet-fed mice augments oxidative phosphorylation in WAT. A eWAT lysates were analyzed by Western blot using anti‑total OXPHOS antibody cocktail or antibodies specific for STK25 or MST3. Protein levels were quantified by densitometry; representative Western blots are shown with vinculin used as a loading control. B Representative images of sWAT and eWAT sections stained with H&E. Scale bar: 100 µm. CF The average adipocyte size and adipocyte size distribution (values representing the relative proportion of adipocytes in the given diameter class) in the sWAT (C, D) and eWAT (EF). Data are mean ± SEM from 6 to 9 mice per group. CI-V, OXPHOS complexes I–V; CD, chow diet; Ctrl, control; HFD, high-fat diet; WT, wild-type. *p < 0.05, **p < 0.01 vs. respective controls; ap < 0.05 vs. chow-fed control mice
Fig. 6
Fig. 6
Combined silencing of STK25 and MST3 enhances mitochondrial membrane potential and reduces lipid storage in activated 3T3-L1 adipocytes. A Schematic overview of the experimental design. Differentiated 3T3-L1 adipocytes were transfected with Stk25 and/or Mst3 siRNA, or nontargeting control siRNA, and studied both under basal conditions and after browning was induced through β3-adrenergic receptor activation by CL-316,243 supplementation. B Representative images of cells stained with MitoTracker Red (red) or Oil Red O (red); nuclei stained with DAPI (blue). Scale bar: 25 µm. CD Quantification of the fluorescence staining of MitoTracker Red (C) and Oil Red O (D). Data are mean ± SEM from 4 wells per group. Dexa, dexamethasone; FBS, fetal bovine serum; IBMX, 3-isobutyl-1-methylxanthine; NTC, nontargeting control. ap < 0.05 vs. respective basal counterparts, bp < 0.05 vs. CL-316,243-treated cells transfected with Stk25/Mst3 siRNA
Fig. 7
Fig. 7
Schematic presentation illustrating the whole-body and organ-specific responses in obese mice following the inhibition of GCKIII kinases STK25 and MST3, either individually or in combination. The figure integrates findings from the current study with previous reports [14, 21, 22, 24]

References

    1. Loos RJF, Yeo GSH. The genetics of obesity: from discovery to biology. Nat Rev Genet. 2022;23(2):120–33. - PMC - PubMed
    1. Hagberg CE, Spalding KL. White adipocyte dysfunction and obesity-associated pathologies in humans. Nat Rev Mol Cell Biol. 2024;25(4):270–89. - PubMed
    1. Yoon H, Shaw JL, Haigis MC, Greka A. Lipid metabolism in sickness and in health: emerging regulators of lipotoxicity. Mol Cell. 2021;81(18):3708–30. - PMC - PubMed
    1. James DE, Stockli J, Birnbaum MJ. The aetiology and molecular landscape of insulin resistance. Nat Rev Mol Cell Biol. 2021;22(11):751–71. - PubMed
    1. Zadoorian A, Du X, Yang H. Lipid droplet biogenesis and functions in health and disease. Nat Rev Endocrinol. 2023;19(8):443–59. - PMC - PubMed

MeSH terms

Substances

LinkOut - more resources