

Cortical Morphology and Morphometric Similarity Network Topology Alterations in Preterm Neonates: Insights From an East Asian Cohort
- PMID: 40984776
- PMCID: PMC12454920
- DOI: 10.1002/hbm.70361
Cortical Morphology and Morphometric Similarity Network Topology Alterations in Preterm Neonates: Insights From an East Asian Cohort
Abstract
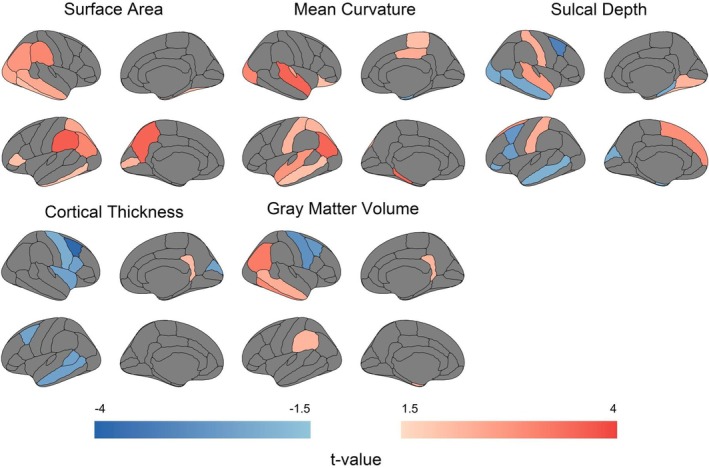
The early postnatal period is critical for cortical development, with prematurity disrupting neurodevelopmental trajectories and increasing long-term vulnerability. However, cortical morphological and morphometric similarity network (MSN) research in East Asian preterm neonates is limited. Using structural MRI in 159 Chinese neonates (109 preterm [median GA at birth: 34.6 weeks], 50 term [median GA at birth: 38.8 weeks]) scanned at near-term equivalent PMA (36-42 weeks), we analyzed cortical morphometry and constructed individualized MSNs. Compared to term neonates, preterm neonates exhibited significant region-specific morphological alterations: reduced surface area in the left precuneus and supramarginal gyrus, decreased mean curvature in the left inferior parietal, parahippocampal, and right superior temporal cortices, and increased cortical thickness in the right caudal middle frontal gyrus (FDR-corrected p < 0.05). Within preterm neonates, surface area and gray matter volume showed widespread positive correlations with PMA at scan (FDR-corrected p < 0.05 in multiple regions). Regional MSN analysis revealed significantly increased morphometric similarity in the right medial orbitofrontal cortex (FDR-corrected p = 0.026). Although global MSN topology showed no statistically significant group differences, preterm neonates displayed trends suggesting reduced MSN-based integration and segregation, reflecting less coordinated cortical morphological patterns across distant and local regions. Within the preterm group, developmental analysis indicated progressive trends toward enhanced global MSN integration and segregation with increasing PMA, alongside a significant decrease in betweenness centrality within the right precuneus (Spearman's ρ = -0.337). This study comprehensively characterizes cortical morphology and MSN development in East Asian preterm neonates, identifying region-specific disruptions and dynamic postnatal cortical morphological and network maturation trajectories.
Keywords: brain development; cortical morphology; graph theory; morphometric similarity network; preterm neonates.
© 2025 The Author(s). Human Brain Mapping published by Wiley Periodicals LLC.
Conflict of interest statement
The authors declare no conflicts of interest.
Figures


References
-
- Ajayi‐Obe, M. , Saeed N., Cowan F. M., Rutherford M. A., and Edwards A. D.. 2000. “Reduced Development of Cerebral Cortex in Extremely Preterm Infants.” Lancet 356, no. 9236: 1162–1163. - PubMed
-
- Carmon, J. , Heege J., Necus J. H., et al. 2020. “Reliability and Comparability of Human Brain Structural Covariance Networks.” NeuroImage 220: 117104. - PubMed
-
- Dadario, N. B. , and Sughrue M. E.. 2023. “The Functional Role of the Precuneus.” Brain 146, no. 9: 3598–3607. - PubMed
MeSH terms
Grants and funding
LinkOut - more resources
Full Text Sources
Medical
Research Materials
Miscellaneous
