. 2025 Sep 30;39(18):e71076.
doi: 10.1096/fj.202501800R.

Investigation of the Impact of Tryptophan-Metabolizing Enzymes and Kynurenic Acid on Antibody-Mediated Glomerulonephritis

Affiliations

Investigation of the Impact of Tryptophan-Metabolizing Enzymes and Kynurenic Acid on Antibody-Mediated Glomerulonephritis

Ryosuke Umeda et al. FASEB J. .

Abstract

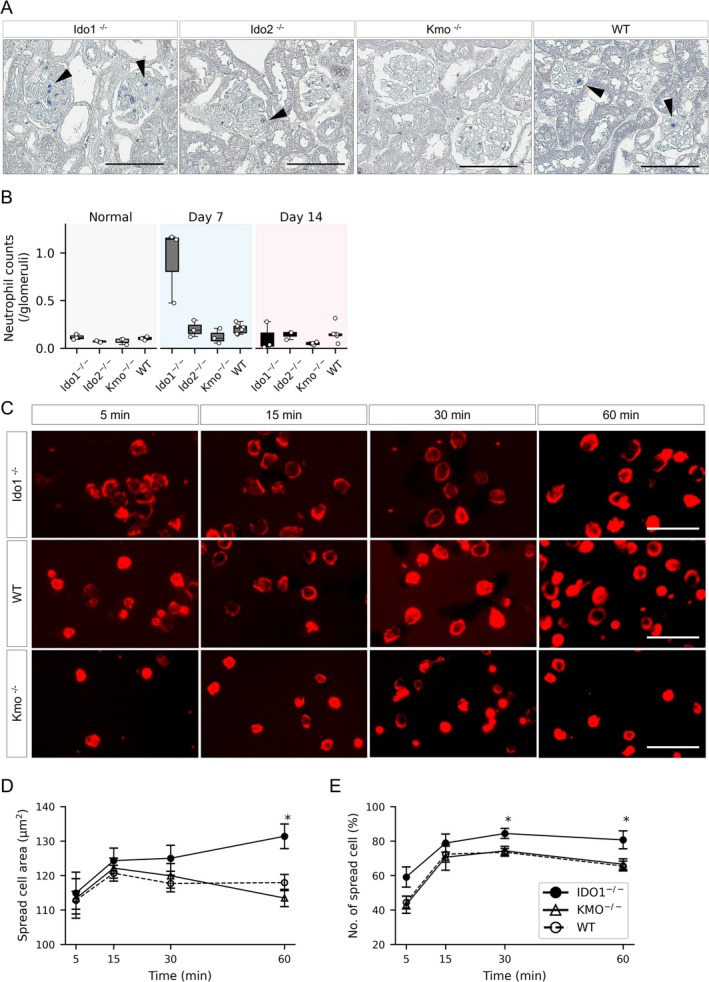
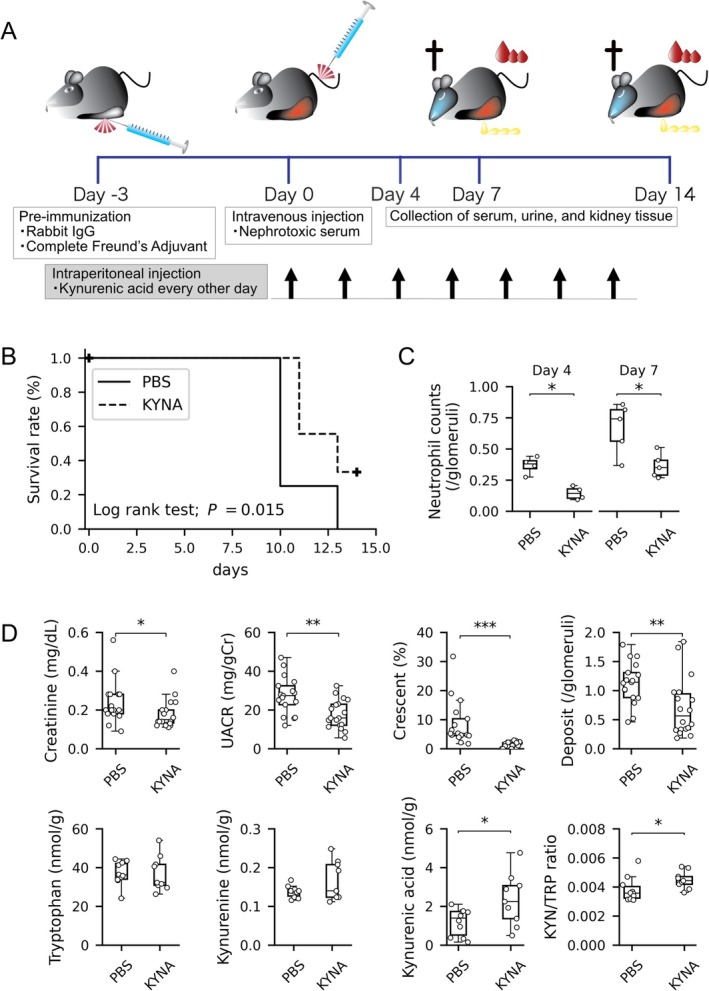
Tryptophan (TRP) metabolism through the kynurenine pathway generates multiple biologically active metabolites with diverse immunomodulatory effects, but their roles in glomerulonephritis (GN), particularly in innate immunity, remain poorly understood. Using a nephrotoxic serum-induced GN (NTS-GN) model, we first analyzed mice deficient in key TRP-metabolizing enzymes of the kynurenine pathway: Indoleamine 2,3-dioxygenase 1 and 2 (IDO1 and IDO2), and kynurenine 3-monooxygenase (KMO), and found that Ido1-deficient mice exhibited exacerbated kidney injury and glomerular neutrophil infiltration, whereas Ido2 deficiency had no significant impact. In contrast, Kmo-deficient mice showed reduced crescent formation. Unexpectedly, the concentration of kynurenic acid (KYNA), a downstream metabolite of IDO1, was elevated in the kidney cortex of Ido1-deficient mice. Exogenous KYNA administration improved survival, ameliorated renal injury, and reduced neutrophil infiltration in Ido1-deficient mice, indicating its protective effect against antibody-mediated injury. Moreover, KYNA suppressed immune complex-mediated neutrophil spreading, attenuated FcγR-dependent Syk phosphorylation, and reduced VEGF secretion in vitro. Our results position KYNA as a key modulator of neutrophil-driven inflammation in antibody-mediated GN. This study uncovers distinct roles for kynurenine pathway enzymes and highlights the TRP-KYNA pathway as a promising immunometabolic target for controlling innate immune responses in GN.

Keywords: Indoleamine 2,3‐dioxygenase; RRID:AB_2337118; RRID:IMSR_JAX:005867; RRID:MGI:2159965; RRID:MGI:3028467; RRID:MGI:5759308; glomerulonephritis; kynurenic acid; neutrophils; tryptophan.


Conflict of interest statement

The authors declare no conflicts of interest.

Figures

FIGURE 1
FIGURE 1
Kynurenine pathway.
FIGURE 2
FIGURE 2
Tryptophan metabolism and renal injury in enzyme‐deficient mice with NTS‐GN. (A) Experimental timeline and protocol for NTS‐GN induction. Mice were pre‐immunized with rabbit IgG and Complete Freund's Adjuvant on day −3, followed by intravenous injection of nephrotoxic serum on day 0, and were sacrificed on days 7 and 14 for sample collection. (B) Representative PAS‐stained kidney sections on day 14 after NTS‐GN induction in Ido1‐deficient, Ido2‐deficient, Kmo‐deficient, and WT mice. Red arrowheads indicate glomerular crescent formation, and yellow arrows indicate PAS‐positive deposits. Scale bars, 100 μm. (C–F) Kidney function and histological parameters on days 0, 7, and 14 after NTS‐GN induction: (C) serum creatinine, (D) urinary albumin‐to‐creatinine ratio (UACR), (E) crescent formation rate, (F) PAS‐positive glomerular deposit scores. On day 14, Ido1‐deficient mice showed significantly elevated serum creatinine (p = 0.0048), UACR (p = 0.0057), crescent formation (p = 0.0022), and glomerular deposit scores (p = 0.0045) compared with WT mice (n = 8–17 per group). Group comparisons were performed using the Mann–Whitney U test with Benjamini–Hochberg correction. See also Table S1 for complete statistical results. KAT2, kynurenine aminotransferase 2; KMO, kynurenine 3‐monooxygenase; KYNU, kynureninase; TDO, tryptophan 2,3‐dioxygenase; QPRT, quinolinic acid phosphoribosyl transferase; 3‐HAO, 3‐hydroxyanthranilate 3,4‐dioxygenase.
FIGURE 3
FIGURE 3
Glomerular neutrophil infiltration and time‐dependent morphological changes in enzyme‐deficient mice with NTS‐GN. (A) Representative esterase‐stained kidney sections on day 7 after NTS‐GN induction in Ido1‐deficient, Ido2‐deficient, Kmo‐deficient, and WT mice. Blue‐stained cells indicate neutrophil infiltration within glomeruli. Scale bars: 100 μm. (B) Quantification of glomerular neutrophil infiltration on days 0, 7, and 14. Neutrophil counts were significantly increased in Ido1‐deficient mice on day 7 compared with WT (p = 0.024, Mann–Whitney U test). No significant differences were observed in Ido2‐ or Kmo‐deficient mice at either time point. n = 3 per knockout group (Ido1, Ido2, Kmo); n = 6 for WT at days 7 and 14. n = 3 in each group at day 0. (C) Time‐course images of neutrophil morphological changes following immune complex stimulation. Bone marrow‐derived neutrophils from Ido1‐deficient (top row), WT (middle row), and Kmo‐deficient (bottom row) mice were seeded onto plates coated with BSA/anti‐BSA immune complexes and stained with rhodamine phalloidin to visualize F‐actin. Images were captured at 5, 15, 30, and 60 min after stimulation (left to right). (D,E) Quantification of neutrophil morphological changes over time in Ido1‐deficient (n = 6), Kmo‐deficient (n = 5), and WT (n = 10) mice. The percentage of spread‐form cells was significantly higher in Ido1‐deficient mice than in WT at 30 and 60 min (p = 0.018 and 0.021, respectively). At 60 min, the spread area was significantly larger in Ido1‐deficient neutrophils than in both WT and Kmo‐deficient neutrophils (p = 0.0070 and 0.0025, respectively). Left: Spread area (μm2); right: Percentage of spread‐form neutrophils (%). Asterisks (*) indicate statistically significant differences (p < 0.05, respectively).
FIGURE 4
FIGURE 4
Concentrations of tryptophan and its metabolites in the kidney cortex. (A–F) Box plots showing (A) tryptophan (TRP), (B) kynurenic acid (KYNA), (C) kynurenine (KYN), (D) the kynurenine‐to‐tryptophan ratio (KYN/TRP), (E) KYNA to KYN ratio (KYNA/KYN), and (F) 3‐hydroxyanthranilic acid (3HAA) to KYN ratio in Ido1‐deficient, Kmo‐deficient, and WT mice under normal conditions and on days 0, 7, and 14 after NTS‐GN induction. TRP levels increased after disease induction in all groups, with no significant differences between genotypes. Ido1‐deficient mice exhibited reduced KYN and KYN/TRP at baseline, and a significant elevation of KYNA on day 7 despite lacking functional IDO1. KYNA levels in Ido1‐deficient mice remained higher than WT on day 14, although the difference was not statistically significant. The KYNA/KYN ratio (E) progressively increased in Ido1‐deficient mice, whereas the 3HAA/KYN ratio (F) did not show a corresponding rise. Kmo‐deficient mice consistently showed markedly elevated KYN, KYNA, and KYN/TRP levels. Statistical comparisons were performed using the Mann–Whitney U test with Benjamini–Hochberg correction (n = 6–20 per group). See also Table S2 for full results.
FIGURE 5
FIGURE 5
Effect of KYNA administration in Ido1‐deficient mice with NTS‐GN. (A) Experimental timeline for KYNA administration in the NTS‐GN model. KYNA or PBS was administered intraperitoneally every other day into Ido1‐deficient mice. (B) Kaplan–Meier survival curves for KYNA‐treated (dashed line, n = 9) and phosphate‐buffered saline (PBS)‐treated (solid line, n = 8) Ido1‐deficient mice. KYNA treatment significantly improved survival (log‐rank test, p = 0.015). (C) Quantification of glomerular neutrophil infiltration on days 4 and 7. Neutrophil counts were significantly decreased in Ido1‐deficient mice with KYNA injection on days 4 and 7 compared with PBS‐treated control (p = 0.029 and p = 0.032, respectively, Mann–Whitney U test). n = 4 for each group at day 4 and n = 5 at day 7. (D) Box plots showing therapeutic effects of KYNA on kidney injury (top row: Serum creatinine, UACR, crescent formation rate, PAS‐positive deposit scores; n = 16–18 per group) and on tryptophan metabolism in the kidney cortex (bottom row: TRP, KYN, KYNA, and KYN/TRP ratio; n = 9–10 per group) at day 7. KYNA‐treated mice showed significantly improved renal parameters and increased KYNA and KYN/TRP ratio (p = 0.046 and p = 0.031, respectively; Mann–Whitney U test; p < 0.05 for all significant comparisons). Asterisks (*, **, ***) indicate statistically significant differences (p < 0.05, p < 0.01, p < 0.001, respectively).
FIGURE 6
FIGURE 6
Time‐dependent morphological activation of neutrophils stimulated with immune complexes. (A, B) Effect of KYNA on neutrophil spreading in Ido1‐deficient mice. At 60 min, KYNA‐treated Ido1‐deficient neutrophils (n = 5) showed a significantly reduced spread area compared to untreated Ido1‐deficient neutrophils (n = 6) (p = 0.041) and remained significantly larger than WT (n = 10) (p = 0.017). For each mouse, five random sections were analyzed per time point; the average of these was used as a single data point. The same set of mice was used across all time points, with independent measurements conducted at each time. Data are presented as mean ± SEM. Statistical analysis was performed using one‐way ANOVA followed by Tukey's post hoc test. (C) Western blot analysis of FcγR–Syk signaling. In Ido1‐deficient neutrophils, phosphorylation of Syk was rapidly and strongly induced at 30–60 s after IC cross‐linking, whereas this response was attenuated by KYNA treatment. Representative blots and total Syk controls are shown. Band intensities from four independent experiments were quantified; at 60 s, phospho‐Syk levels were significantly lower in KYNA‐treated Ido1‐deficient neutrophils compared with untreated Ido1‐deficient neutrophils (p = 0.001). (D) Cytokine secretion from IC‐stimulated neutrophils. Supernatants were collected at 0, 6, and 12 h and analyzed using a cytokine array. (D) VEGF secretion was significantly increased in Ido1‐deficient neutrophils at 6 h compared with WT, and was significantly reduced by KYNA treatment. (E) TNFα secretion was detectable but did not differ significantly among groups at any time point. Asterisks (*, **) indicate statistically significant differences (p < 0.05, p < 0.01, p < 0.001, respectively).

References

    1. Badawy A. A., “Kynurenine Pathway of Tryptophan Metabolism: Regulatory and Functional Aspects,” International Journal of Tryptophan Research: IJTR 10 (2017): 1178646917691938. - PMC - PubMed
    1. Shimizu T., Nomiyama S., Hirata F., and Hayaishi O., “Indoleamine 2,3‐Dioxygenase. Purification and Some Properties,” Journal of Biological Chemistry 253, no. 13 (1978): 4700–4706. - PubMed
    1. Ball H. J., Sanchez‐Perez A., Weiser S., et al., “Characterization of an Indoleamine 2,3‐Dioxygenase‐Like Protein Found in Humans and Mice,” Gene 396, no. 1 (2007): 203–213. - PubMed
    1. Munn D. H., Zhou M., Attwood J. T., et al., “Prevention of Allogeneic Fetal Rejection by Tryptophan Catabolism,” Science 281, no. 5380 (1998): 1191–1193. - PubMed
    1. Munn D. H., Shafizadeh E., Attwood J. T., Bondarev I., Pashine A., and Mellor A. L., “Inhibition of T Cell Proliferation by Macrophage Tryptophan Catabolism,” Journal of Experimental Medicine 189, no. 9 (1999): 1363–1372. - PMC - PubMed

MeSH terms

LinkOut - more resources