. 2025 Sep 30;122(39):e2507194122.
doi: 10.1073/pnas.2507194122. Epub 2025 Sep 23.

Targeting endothelial ERG to mitigate vascular regression in retinopathies

Affiliations

Targeting endothelial ERG to mitigate vascular regression in retinopathies

Eric Ma et al. Proc Natl Acad Sci U S A. .

Abstract

Retinopathy of prematurity (ROP) and diabetic retinopathy (DR) are ocular disorders in which an initial loss of retinal capillaries leads to damaging tissue ischemia followed by a compensatory neovascularization response that generates pathological capillaries in the eye. Using a mouse model of ROP and samples from DR patients, we found that the highly homologous and homeostatic erythroblast transformation-specific (ETS) family transcription factors ETS-related gene (ERG) and Friend leukemia integration 1 (FLI1) are downregulated in endothelial cells (ECs) of retinal capillaries prior to their regression in early stages of these diseases. We developed a mouse model of inducible EC-specific overexpression of Erg and found it mitigates capillary regression, retinal neuron death, neovascularization, and visual defects in the ROP model. Erg overexpression also reduces capillary regression in early stages of a murine DR model. We next found that simultaneous deletion of endothelial Erg and Fli1 is sufficient to promote regression of the pathological retinal capillaries that arise in late stages of the ROP model. Altogether, our data demonstrate that deletion of homeostatic endothelial ETS factors promotes capillary regression, while maintenance of even one of these factors prevents regression. These findings offer insights into approaches for preventing and treating retinopathies at different stages of these diseases.

Keywords: diabetic retinopathy; microvascular rarefaction; retina; retinopathy of prematurity; transcriptional regulator ERG.


Conflict of interest statement

Competing interests statement:E.M., C.M.S., and C.T.G. filed a provisional patent (#63/666,397) related to this work.

Figures

Fig. 1.
Fig. 1.
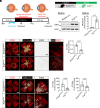
Hyperoxia downregulates ERG in retinal ECs. (A) Representative images of CD31-stained retinal flat mounts from wild type C57BL/6J pups exposed to 75% O2 for the indicated times. Yellow layer indicates avascular (AV) area. (Scale bar: 500 µm.) (B) Quantification of AV areas in (A) (n = 6 mice). (C) Representative immunoblots from whole retinas of P7 littermate wild type pups exposed to room air (RA) or to 75% O2 for 12 h. (D) Densitometry quantification of ERG normalized to EMCN, as in (C) (n = 6 mice). (E) Representative immunoblots from whole retinas of P7 littermate wild type pups exposed to RA or to 75% O2 for 12 h. (F) Densitometry quantification of FLI1 normalized to EMCN, as in (E) (n = 6 mice). (G) Representative immunostaining of ERG, CD31, and DAPI in retinas from P8 wild type C57BL/6J pups after exposure to 75% O2 for 24 h. Yellow arrows indicate EC nuclei with low ERG signal at the capillary regression front. Scale bar: 100 μm in the merged image and 20 μm in the Inset. Data are presented as mean ± SD. AV: Avascular Area, EMCN: Endomucin, RA: Room air, VE-Cad: Vascular endothelial cadherin.
Fig. 2.
Fig. 2.
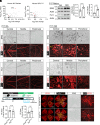
EC-specific Erg overexpression (ErgiECoe) reduces hyperoxia-induced regression and OIR-induced neovascularization. (A) Schematic of testing the effects of inducible endothelial Erg overexpression (ErgiECoe) in the OIR model. Pups were housed in room air (21% O2) from birth to P7 and were then exposed to hyperoxia (75% O2) for 5 d from P7 to P12, when pathological retinal vascular regression occurs. Pups were returned to room air from P12, and P17 was the time of peak neovascular (NV) tuft formation. Tamoxifen was administered orally to ErgiECoe and CreERT2-negative littermate control pups from P5 to P7. Vascular regression was measured at P8, and NV tufts were measured at P17. (B) Representative immunoblots from whole retinas of P8 littermate controls and ErgiECoe pups after tamoxifen administration from P5 to P7. (C) Densitometry quantification of ERG normalized to actin, as in (B) (n = 6 to 7 mice). (D) Representative immunostaining of CD31 (red) and ERG (black/white; insets) on retinal flat mounts at P8 after 24 h of hyperoxia exposure. Avascular (AV) areas are labeled with beige layers. The Inset magnified images correspond to the yellow squares in the images at the far left. Scale bar: 500 µm in the whole flat mount images and 150 µm in the magnified inset images. (E) Quantification of the central AV area in (D) (n = 6 mice). (F) Representative images of CD31-stained retinas from ErgiECoe pups and littermate controls at P17 after OIR challenge. SWIFT_NV (18) was used to mark AV (beige) and NV tuft (white) areas. Scale bar: 500 µm in the whole flat mount images and 250 µm in the magnified Insets. (G and H) Quantification of the NV areas (G) and AV areas (H) shown in (F) (n = 6 to 8 mice). Data are presented as mean ± SD. AV: Avascular, ErgiECoe: ROSAErg/Erg;Cdh5(PAC)-CreERT2, NV: Neovascular.
Fig. 3.
Fig. 3.
ERG expression is robust in angiogenic retinal vessels of P17 OIR-challenged mice, but pathological angiogenesis is not exacerbated in ErgiECoe mice. (A and B) Erg and Fli1 are among 94 conserved genes upregulated in both human neovascularized (NV) and mouse OIR retinas [gleaned from published datasets (19)]. (A) In humans, NV retinas from diabetic patients were compared to epiretinal membranes from nondiabetic controls (ERG: Log2FC = 7.37, P < 0.001; FLI1: Log2FC = 2.45, P < 0.001). (B) In mice, P17 OIR retinas were compared to RA controls (Erg: Log2FC = 2.44, P < 0.001; Fli1: Log2FC = 2.01, P < 0.001). (C) Representative immunoblots from retinas of P17 wild type pups raised at RA or in the OIR model. (D and E) Quantification of densitometry of ERG (D) and FLI1 (E) normalized to actin, as in (C) (n = 6 mice). (F) Representative images of ERG, FLI1, and CD31 immunostaining in the central, middle, and peripheral retinal regions of P17 pups raised in RA or OIR conditions. (Scale bar: 50 µm.) (G) Schematic figure showing tamoxifen administration from P12 to P14 (20 mg/mL, 5 µL/d, orally) in both ErgiECoe pups and Cre-negative littermate controls. (H) Representative images of ERG- and CD31-stained retinal flat mounts from P17 OIR-challenged ErgiECoe and Cre-negative pups. (Scale bar: 500 µm.) Using the ImageJ SWIFT_NV plugin (18), NV tufts (white) and avascular (AV) areas (beige) were labeled. The yellow square in the Left panel indicates the inset area magnified in the two Right panels. (I and J) Quantification of NV area (I) and AV area (J) in (H) (n = 6 mice). Data are presented as Mean ± SD. AV: Avascular, ErgiECoe: ROSAErg/Erg;Cdh5(PAC)-CreERT2, FC: Fold change, NV: Neovascular, OIR: oxygen-induced retinopathy, RA: Room air.
Fig. 4.
Fig. 4.
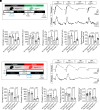
EC-specific deletion of both Erg and Fli1 (Erg/Fli1iECko) promotes NV tuft regression. (A) Schematic of subjecting single knockout (KO) and littermate flox control mice (ErgiECko vs. Ergfl/fl or Fli1iECko vs. Fli1fl/fl) and double KO and littermate flox control mice (Erg/Fli1iECko vs. Erg/Fli1fl/fl) to the OIR model. To induce Cdh5(PAC)-CreERT2 activation, tamoxifen was administered orally at P16 and P17. Retinas were harvested at P18 for flat mount staining of CD31+ retinal vessels. (B and C) Quantification of NV areas from ErgiECko mice and controls (n = 6 to 9 mice) and from Fli1iECko mice and controls (n = 6 to 7 mice). (D) Representative images of CD31-stained retinal flat mounts from P18 Erg/Fli1iECko and littermate control mice. The ImageJ plugin SWIFT_NV (18) was used to label and quantify NV tuft areas (white in whole flat mounts). The inset monochrome images correspond to the white squares in the images at the far left; tufts are pseudocolored in pink. Scale bar: 500 µm in whole flat mounts and 50 µm in the magnified Inset images. (E) Quantification of NV areas from Erg/Fli1iECko and control mice (n = 6 to 10 mice). (F) Quantification of average tuft sizes from Erg/Fli1iECko and control mice (n = 6 to 10 mice). Data are presented as mean ± SD. ErgiECko: Ergflox/flox;Cdh5(PAC)-CreERT2, Fli1iECko: Fli1flox/flox;Cdh5(PAC)-CreERT2, NV: Neovascular, OIR: Oxygen-induced retinopathy.
Fig. 5.
Fig. 5.
Visual defects are improved in OIR-challenged ErgiECoe mice but not in Erg/Fli1iECko mice. (A) Schematic of testing the effects of inducible endothelial Erg overexpression (ErgiECoe) on visual function of the OIR model. Tamoxifen was administered by eye drops to ErgiECoe and CreERT2-negative littermate control pups from P5 to P7. Neuronal damage was measured at P13 by TUNEL staining, and visual function was measured at P21 by electroretinograms and OKT. (B) Representative curves of scotopic and photopic amplitudes from both genotypes exposed to the OIR model or to RA. Scale bar labels are shown at the Bottom Right. (CF) Quantification of scotopic a-wave (C), scotopic b-wave (D), photopic a-wave (E), and photopic b-wave (F) readings as in (B) (n = 6 to 12 mice). (G) Quantification of spatial frequency threshold (c/d) by OKT (n = 8 to 9 mice). (H) Schematic of testing the effects of inducible EC-specific Erg and Fli1 deletion (Erg/Fli1iECko) on visual function in the OIR model. Note that age-matched mice of both genotypes that were raised in RA served as negative controls for the OIR model. Tamoxifen was administered orally to mice of both genotypes at P16 and P17 to induce Cre activation. Visual function was measured by electroretinogram and OKT at P21. (I) Representative curves of scotopic and photopic amplitudes from the four different groups. Scale bar labels are shown at the Bottom Right. (JM) Quantification of scotopic a-wave (J), scotopic b-wave (K), photopic a-wave (L), and photopic b-wave (M) readings from the four different groups (n = 6 mice). (N) Quantification of spatial frequency threshold (c/d) measured by OKT (n = 8 to 16 mice). Data are presented as mean ± SD. OIR: Oxygen-induced retinopathy, OKT: Optokinetic tracking, RA: Room air.
Fig. 6.
Fig. 6.
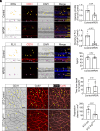
OIR-induced neuronal cell death is reduced in ErgiECoe mice. (A) Following the OIR challenge schematic shown in Fig. 5A, TUNEL staining was performed on ocular cryosections of P13 ErgiECoe and littermate CreERT2-negative pups. DAPI was used as a counterstain. Scale bar: 250 µm in whole retinal sections and 25 µm in the magnified Insets. (B) Quantification of TUNEL+ cells per whole retinal section (n = 6 to 8 mice). Data are presented as mean ± SD. C: Central, GCL: Ganglion cell layer, INL: Inner nuclear layer, OIR: Oxygen-induced retinopathy, ONL: Outer nuclear layer, P: Peripheral, RA: Room air.
Fig. 7.
Fig. 7.
ERG and FLI1 are downregulated in retinal capillaries of NPDR patients, and STZ-induced retinal capillary regression is reduced in ErgiECoe mice. (AE) Paraffin sections of postmortem human eyes were acquired from NPDR patients and age-matched individuals without DR (control). (A) Representative immunostaining of ERG, FLI1, CD31, and DAPI in human eye sections. Scale bar: 25 µm. Yellow arrows indicate retinal capillaries; Purple arrows indicate choroidal capillaries (CD31+DAPI+). (B) Quantification of ERG intensity in (A) ERG+ EC nuclear areas (n = 5 individuals per group). (C) Quantification of FLI1 intensity in (A) in FLI1+ EC nuclear areas (n = 5 individuals per group). (D) Ages of NPDR patients and age-matched controls. (E) The time from death to harvest of eyes from NPDR patients and age-matched controls. (F) At 8 wk of age, male ErgiECoe and littermate ROSAErg/Erg control mice were induced with STZ (50 mg/kg). At 10 wk of age, tamoxifen was administered by eye drops to all mice. At 16 wk of age, retinas were harvested for immunostaining. Representative immunostaining of CD31 and collagen IV (ColIV) is shown in retinas from STZ-challenged ErgiECoe and control mice. Yellow arrows indicate CD31ColIV+ basement membrane sleeves left behind by regressed capillaries. (Scale bar: 25 μm.) (G) Quantification of CD31ColIV+ regression sleeves in (F) (n = 6 mice). Data are presented as mean ± SD. GCL: Ganglion cell layer, INL: Inner nuclear layer, NPDR: Nonproliferative diabetic retinopathy, ONL: Outer nuclear layer, RPE: Retinal pigmented epithelium, STZ: Streptozotocin.

Update of

References

    1. Hartnett M. E., Penn J. S., Mechanisms and management of retinopathy of prematurity. N. Engl. J. Med. 367, 2515–2526 (2012). - PMC - PubMed
    1. Duh E. J., Sun J. K., Stitt A. W., Diabetic retinopathy: Current understanding, mechanisms, and treatment strategies. JCI Insight 2, e93751 (2017). - PMC - PubMed
    1. Jampol L. M., Glassman A. R., Sun J., Evaluation and care of patients with diabetic retinopathy. N. Engl. J. Med. 382, 1629–1637 (2020). - PubMed
    1. Hartnett M. E., Pathophysiology of retinopathy of prematurity. Annu. Rev. Vis. Sci. 9, 39–70 (2023). - PubMed
    1. Wong T. Y., Cheung C. M., Larsen M., Sharma S., Simo R., Diabetic retinopathy. Nat. Rev. Dis. Primers 2, 16012 (2016). - PubMed

MeSH terms

LinkOut - more resources