. 2025 Sep 22;35(18):4537-4552.e6.
doi: 10.1016/j.cub.2025.08.019.

Crossover designation recruits condensin to reorganize the meiotic chromosome axis

Affiliations

Crossover designation recruits condensin to reorganize the meiotic chromosome axis

Victor A Leon et al. Curr Biol. .

Abstract

Crossover recombination supports meiotic chromosome inheritance and fertility by establishing chiasmata between homologous chromosomes prior to the first meiotic division. In addition to the physical exchange of DNA mediated by meiotic recombination, chiasma formation also involves restructuring of the underlying chromosome axis, possibly to help with chiasma maturation or to resolve chromosomal interlocks. Here, we identify condensin as an important regulator of axis remodeling in S. cerevisiae. Condensin is recruited near sites of meiotic crossover designation by pro-crossover factors but is largely dispensable for DNA exchange. Instead, condensin helps to create discontinuities in the meiotic chromosome axis by promoting removal of cohesin. In addition, chromosomes of condensin mutants exhibit unusually common parallel chromatin clouds and experience a chromosomal buildup of the conserved axis remodeler Pch2. Consistent with an important role of axis restructuring at crossover sites, the canonical anaphase-bridge phenotype of condensin mutants is partly rescued by redirecting meiotic DNA repair to sister chromatids instead of homologous chromosomes, suggesting that crossover-associated axis reorganization is important for faithful meiotic chromosome segregation.

Keywords: Pch2; Rec8; Red1; ZMM factors; axial element; synapsis.


Conflict of interest statement

Declaration of interests The authors declare no competing interests.

Figures

Figure 1.
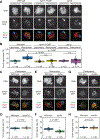
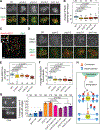
Figure 1.. Condensin distribution on prophase chromosomes depends on SPO11 and REC8.
(A) Representative images of Nop1 (red), Smc4-GFP (green), and Zip1 (orange) binding patterns on surface-spread nuclei, categorized as “No GFP”, “Foci”, “Foci & Cluster”, or “Cluster” of GFP patterns. Bar = 1 μm. (B) Incidence of GFP patterns shown in (A) in wild-type [H9443], rec8Δ [H9442], spo11-YF [H9441], or in the absence of a GFP tag (“no tag”) [H7797], n=100. (C) Quantifications of GFP levels on nuclei from wild-type, rec8Δ, spo11-YF, and untagged control samples 3h after meiotic induction. Only nuclei with visible Zip1 staining were analyzed, n=25, 24, 27, 16 respectively. Total GFP intensity for each nucleus was normalized to background. Bars indicate mean and standard deviation (S.D). Wilcox test (alternative hypothesis: greater). (D) Red1 (blue) [H119/6408] and Smc4-PK9 (pink) [H6408] binding patterns along chromosome II and a representative region (inset) in wild-type cells. Horizontal blue and pink lines represent genome averages. (E) Heatmap of Smc4-PK9 enrichment around axis sites in wild type [H6408] and rec8Δ mutants [H7660]. Axis sites were defined as Red1 summits in wild-type cells with -log10 q-value greater than or equal to 20, as determined by MACS2. ChIP-seq values were averaged over 50-bp windows around axis sites across a 3-kb window. Rows are sorted by amount of Red1 binding at these sites. Heatmap colors represent enrichment (blue) or depletion (gold). Mean and 95% confidence intervals are shown in line graphs directly above heatmap. Gray line indicates mean and standard error of the mean (S.E.M.) from the no-tag controls [H7797, H8428] and provides a measure of the non-specific enrichment by the PK9 antibody. (F) Spo11-oligo signal (purple) and Smc4-PK9 (pink) [H6408] binding pattern in wild-type cells in the same representative region on chromosome II shown in (D). Horizontal lines represent genome averages. (G) Heatmap of Smc4-PK9 enrichment around DSB hotspots in wild-type cells [H6408] and spo11-YF mutants [H8630]. Hotspots were placed into three quantiles grouped by strength (from hottest to weakest: maroon, pink, light blue). ChIP-seq values were averaged over 50-bp windows around the midpoints of hotspots across a 3-kb window. Rows in each quantile were sorted by Smc4-PK9 enrichment with pink indicating high enrichment and light blue indicating depletion. Mean and 95% confidence intervals are shown in the line graph directly above the heatmap. Gray lines indicate mean and 95% confidence intervals of the no-tag controls [H7797, H8643]. The signal seen at hotspots in no-tag controls is because hotspots coincide with nucleosome-free regions, which fragment more frequently during sonication and thus create non-specific background signals. See also Figure S1.
Figure 2.
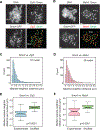
Figure 2.. Increased condensin binding to meiotic chromosomes requires crossover designation.
(A) Representative images of Smc4-GFP (green) distribution on surface-spread nuclei from wild-type [H11471], spo11-YF [H9441], and zip1Δ mutants [H11499]. Chromosomes were also stained for DNA (DAPI), Red1 (red), and the nucleolar marker Nop1 (blue). Nuclei were staged based on Red1 staining. Punctate Red1 staining was classified as leptonema and individualized Red1 axes were classified as pachynema (note that pachynema is defined by complete synapsis, which does not occur in spo11-YF and zip1Δ mutants; however, individualized Red1 axes are typically associated with pachynema in wild-type cells). Bar = 1 μm. (B) Smc4-GFP signal overlapping with Nop1 (nucleolar) or not overlapping with Nop1 (axial) was quantified. The percent of axial signal out of total signal is shown. Statistical significance was determined using Welch two-sample t-tests with Benjamini-Hochberg correction. (C-G) Representative images of Smc4-GFP on spread wild-type [H11471] and mutant chromosomes as well as quantification of relative Smc4 distribution in pachynema. (C-D) ecm11Δ [H12818], (E-F) zip3Δ [H12925], (G-H) msh4Δ [H13168]. See also Figure S2.
Figure 3.
Figure 3.. Condensin is enriched near sites of crossover designation.
Representative images showing the relative distribution of Smc4-GFP (green) compared to (A) Zip3–13myc [H12926] or (B) Msh4–13myc [H11735] on surface-spread pachytene nuclei. DNA was stained with DAPI. nuc. = nucleolus, as apparent from the unsynapsed chromatin. (C-D) Distance analysis (DiAna) of Smc4-GFP and Zip3–13myc (C) and Msh4–13myc (D), respectively. The distances between nearest-neighbor foci were measured using focus centers. Bar graphs show the combined nearest-neighbor focus distances collected from the indicated number of nuclei. (E-F) Distribution of median focus distances per nucleus for Smc4/Zip3 focus pairs (E) and Smc4/Msh4 focus pairs (F). Input data is the same as for (C) and (D) and compared to matched randomized controls (see Methods). Wilcoxon rank sum exact test.
Figure 4.
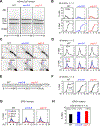
Figure 4.. Largely normal joint-molecule and crossover levels in condensin mutants.
Analysis of meiotic recombination at the engineered HIS4-LEU2 hotspot (A-F) and the natural ERG1 hotspot (G-H) in a synchronous meiotic time course. Cultures were shifted to 34°C after 2.5 hours (see Methods and Figure S4 for details). (A) Representative 1D gel images of wild-type [KKY4278], smc2–8 [KKY6547], and ycg1–2 mutant strains [KKY6544]. Double-strand break, DSB; joint molecules, JMs; crossovers, COs. (B) Quantification of DSB and CO species observed in (A). (C) Representative 2D gel images of wild-type, smc2–8, and ycg1–2 mutant strains. (D) Quantification of single-end invasion (SEI), interhomolog double Holliday junction (IH-dHJ), and intersister double Holliday junction (IS-dHJ) species from (C). (E) Representative 1D gel images showing interhomolog crossovers (IH-CO) and interhomolog non-crossovers (IH-NCO) in wild-type, smc2–8, and ycg1–2 mutant strains. (F) Quantification of IH-COs and IH-NCOs from (E). (G) Quantification of IH-dHJ and IS-dHJ species at ERG1 in wild-type, smc2–8, and ycg1–2 mutant strains. (H) Quantification of CO levels at ERG1 in wild-type, smc2–8, and ycg1–2 mutant strains 10 hours after meiotic induction. See also Figures S3–S4.
Figure 5.
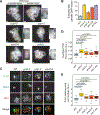
Figure 5.. Zip3 foci are larger and meiotic chromosome axes are more continuous in condensin mutants.
(A-C) Analysis of Zip3-GFP foci at pachynema in wild type [H13116], and ycg1–2 [H13117], smc2–8 [H13118], and brn1-mn [H13141] mutants at 34°C. (A) Representative images of Zip3-GFP in the indicated strains. (B) Quantification of the average size of individual Zip3-GFP foci per nucleus in the indicated strains. The number of analyzed nuclei is indicated. (C) Quantification of the average signal intensity of individual Zip3-GFP foci in the same nuclei as in (B). Wilcoxon rank sum test with continuity correction. (D-H) Analysis of chromosome synapsis (Zip1) and chromosome axes (Red1) at pachynema in wild-type [H7797], ycs4–2 [H8601], ycg1–2 [H11281], smc2–8 [H11364], and brn1-mn [H12022] mutants at 34°C. (D) Representative images showing the binding of Zip1 (red) and Red1 (green) in the indicated strains. DNA is stained with DAPI. Bar = 1 μm. (E) Quantification of total synapsis (Zip1 area) in the indicated strains. The number of analyzed nuclei is indicated. Wilcoxon rank sum test with continuity correction. (F) Incidence of Zip1 aggregates (polycomplexes) in the same nuclei as in (E). (G) Quantification of the average signal of individual Red1 stretches as a measure of axis fragment length. The number of analyzed nuclei is indicated. (H) Quantification of the total number of Red1 stretches per nucleus for the same nuclei as in (G). (I) Quantification of the total number of Red1 stretches at pachynema in wild-type [H11471] and zip3Δ mutants [H12925]. G-I: Wilcoxon rank sum test with continuity correction. See also Figure S5.
Figure 6.
Figure 6.. Abnormal chromatin morphology and Pch2 accumulation in condensin mutants.
(A) Representative images of chromatin morphology of spread pachytene chromosomes strained with DAPI in wild type [H7797], ycs4–2 [H8601], ycg1–2 [H11281], and smc2–8 [H11364] mutants at 34°C. Wild-type examples of nuclei with or without parallel DAPI tracks and pch2Δ mutants [H11758], which have strong parallel-track phenotype , are included for comparison (at 34°C). Bar = 1 μm. Insets highlight examples of parallel DAPI tracks. (B) Quantification of nuclei with predominantly parallel DAPI tracks in the indicated strains. (C) Representative images showing the relative binding of Pch2 (green) in the nucleolus (marked by staining with Nop1 in blue) and along the SC (marked by Zip1 in green) of spread pachytene chromosomes in wild-type [H7797], ycs4–2 [H8601], ycg1–2 [H11281], and smc2–8 [H11364] and brn1-mn [H12022] mutants at 34°C. (D) Quantification of average Pch2 focus intensity in the indicated strains. (E) Quantification of the average Pch2 staining area per nucleus in the strains analyzed in (D). Wilcoxon rank sum test with continuity correction. See Figure S6.
Figure 7.
Figure 7.. Continuous cohesin axes and interhomolog recombination-dependent meiotic missegregation in condensin mutants.
(A-B) Analysis of Rec8 binding on spread pachytene chromosomes in wild-type [H7797], ycs4–2 [H8601], ycg1–2 [H11281], smc2–8 [H11364], and brn1-mn [H12022] mutants at 34°C. (A) Representative images showing the binding of Zip1 (red) and Red1 (green) in the indicated strains. DNA is stained with DAPI. Bar = 1 μm. (B) Quantification of the total number of Rec8 stretches per nucleus. The number of analyzed nuclei is indicated. (C) Representative image of a wild-type spread nucleus [H13116] showing adjacent foci of Zip3-GFP and phospho-Rec8-S521 (Rec8-pS521). Arrowheads in zoomed-in detail indicate examples of close apposition of foci. (D) Representative images of spreads stained for DNA (DAPI), Zip1 (red) and Rec8-pS521 (green) in wild type [H7797], ycs4–2 [H8601], ycg1–2 [H11281], smc2–8 [H11364], and brn1-mn [H12022] mutants at 34°C. (E) Quantification of the total number of Rec8-pS521 foci per nucleus in the indicated strains. The number of analyzed nuclei is indicated. (F) Average focus intensity of the data shown in (D). Wilcoxon rank sum test with continuity correction. (G) Quantification of chromosome bridging in anaphase I and II nuclei in wild type [H7797], ycg1–2 [H11281], smc2–8 [H11364], spo11-YF [H12173], ycg1–2 spo11-YF [H12227], smc2–8 spo11-YF [H12245], mek1Δ [H12137], ycg1–2 mek1Δ [H12194], smc2–8 mek1Δ [H12205]. The panels on the left show examples of spread nuclei with normal meiosis I chromosome separation or anaphase I chromosome bridging. DNA is stained with DAPI. The number of analyzed nuclei is indicated. Welch two-sample t-tests. (H) Schematic summarizing the proposed regulation of the meiotic chromosome axis by condensin. Upon crossover designation, condensin relocalizes from the nucleolus to the vicinity of crossover repairs sites. There, it promotes the phosphorylation of Rec8 on S521 (red circles) and local removal of cohesin. See also Figure S7.

Update of

References

    1. Hildebrand EM, and Dekker J (2020). Mechanisms and Functions of Chromosome Compartmentalization. Trends Biochem Sci 45, 385–396. - PMC - PubMed
    1. Bickmore WA, and van Steensel B (2013). Genome architecture: domain organization of interphase chromosomes. Cell 152, 1270–1284. - PubMed
    1. Zickler D, and Kleckner N (2015). Recombination, Pairing, and Synapsis of Homologs during Meiosis. Cold Spring Harb Perspect Biol 7, a016626. - PMC - PubMed
    1. Borner GV, Hochwagen A, and MacQueen AJ (2023). Meiosis in budding yeast. Genetics 225, iyad125. - PMC - PubMed
    1. Ito M, and Shinohara A (2022). Chromosome architecture and homologous recombination in meiosis. Front Cell Dev Biol 10, 1097446. - PMC - PubMed

MeSH terms

LinkOut - more resources