. 2025 Sep;292(2055):20251453.
doi: 10.1098/rspb.2025.1453. Epub 2025 Sep 24.

Co-circulating pathogens of humans: a systematic review of mechanistic transmission models

Affiliations

Co-circulating pathogens of humans: a systematic review of mechanistic transmission models

Kelsey E Shaw et al. Proc Biol Sci. 2025 Sep.

Abstract

Historically, most mathematical models of infectious disease dynamics have focused on a single pathogen, despite the ubiquity of co-circulating pathogens in the real world. We conducted a systematic review of 326 published papers that included a mechanistic, population-level model of co-circulating human pathogens. We identified the types of pathogens represented in this literature, techniques used and motivations for conducting these studies. We also created an interaction index to quantify the degree to which co-circulating pathogen models include across scale and/or pathogen-pathogen interactions. We found that the emergence of new pathogens, such as HIV and SARS-CoV-2, precipitated modelling activity of the emerging pathogen with established pathogens. Pathogen characteristics also tended to drive modelling activity; for example, HIV suppresses the immune response, eliciting interesting dynamics when it is modelled with other pathogens. The motivations driving these studies were varied but could be divided into two major categories: exploration of dynamics and evaluation of interventions. Future potential avenues of research we identified include investigating the effects of misdiagnosis of clinically similar co-circulating pathogens and characterizing the impacts of one pathogen on public health resources available to curtail the spread of other pathogens.

Keywords: co-circulating pathogens; disease transmission; mechanistic modelling.


Conflict of interest statement

We declare we have no competing interests.

Figures

PRISMA flow chart for the literature search, screening and inclusion process.
Figure 1.
PRISMA (Preferred Reporting Items for Systematic reviews and Meta-Analyses) flow chart for the literature search, screening and inclusion process.
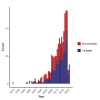
Temporal trends in the publication of co-circulating pathogen models.
Figure 2.
Temporal trends in the publication of co-circulating pathogen models. Papers that met our inclusion criteria gradually increased over time. The year of 2024 was only partially sampled up to papers published by the month of October.
Pathogen characteristics.
Figure 3.
Pathogen characteristics. (A) The frequency of how many pathogens were included in models. The vast majority of models included two pathogens. (B) Frequency of transmission modes represented across all pathogens modelled. Vertically transmitted pathogens, blood-borne pathogens and sexually transmitted pathogens were common in our dataset due to the large number of models focused on HIV. (C) Change in transmission modes represented in our dataset over time, represented as a percentage of the total models we analysed for that publication year.
Frequency of modelling pathogens within and between taxonomic groups.
Figure 4.
Frequency of modelling pathogens within and between taxonomic groups (A) and transmission modes (B).(A) Viruses and bacteria were modelled together most frequently. (B) Sexually transmitted pathogens were modelled together most frequently with vertically transmitted pathogens and with respiratory pathogens. Light yellow indicates zero models that paired two pathogens with a transmission mode of ‘Other’.
Frequency of citations.
Figure 5.
Frequency of citations. Most papers in our dataset were cited fewer than 30 times, however there were several outliers with over 100 citations.
Measures of model interaction.
Figure 6.
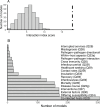
Measures of model interaction. We calculated an interaction index, in which a model received one point for each interaction either across scale and/or between pathogens. (A) The frequency of interaction scores in our dataset; black line represents the maximum possible score of 18. Mid-range scores between 3 and 7 were most common. (B) The frequency of each interaction component in our dataset.
The co-occurrence of different interactions within the same model.
Figure 7.
The co-occurrence of different interactions within the same model. The inclusion of co-infected hosts and external interventions, in particular interventions, was very common in our dataset. Combinations that did not occur in our dataset are in yellow.

References

    1. Ferguson NM, Cummings DAT, Fraser C, Cajka JC, Cooley PC, Burke DS. 2006. Strategies for mitigating an influenza pandemic. Nature 442, 448–452. ( 10.1038/nature04795) - DOI - PMC - PubMed
    1. Heesterbeek H, et al. 2015. Modeling infectious disease dynamics in the complex landscape of global health. Science 347, aaa4339. ( 10.1126/science.aaa4339) - DOI - PMC - PubMed
    1. Pagel C, Yates CA. 2022. Role of mathematical modelling in future pandemic response policy. BMJ 378, e070615. ( 10.1136/bmj-2022-070615) - DOI - PubMed
    1. Abu-Raddad LJ, Sabatelli L, Achterberg JT, Sugimoto JD, Longini IM, Dye C, Halloran ME. 2009. Epidemiological benefits of more-effective tuberculosis vaccines, drugs, and diagnostics. Proc. Natl Acad. Sci. USA 106, 13980–13985. ( 10.1073/pnas.0901720106) - DOI - PMC - PubMed
    1. Cowger TL, Murray EJ, Clarke J, Bassett MT, Ojikutu BO, Sánchez SM, Linos N, Hall KT. 2022. Lifting universal masking in schools — Covid-19 incidence among students and staff. N. Engl. J. Med. 387, 1935–1946. ( 10.1056/nejmoa2211029) - DOI - PMC - PubMed

Publication types

LinkOut - more resources