. 2025 Sep;57(9):2067-2082.
doi: 10.1038/s12276-025-01539-5. Epub 2025 Sep 24.

Prolonged immune activation in post-acute sequelae of SARS-CoV-2: neutrophil dynamics and therapeutic insights

Affiliations

Prolonged immune activation in post-acute sequelae of SARS-CoV-2: neutrophil dynamics and therapeutic insights

Mina Yu et al. Exp Mol Med. 2025 Sep.

Abstract

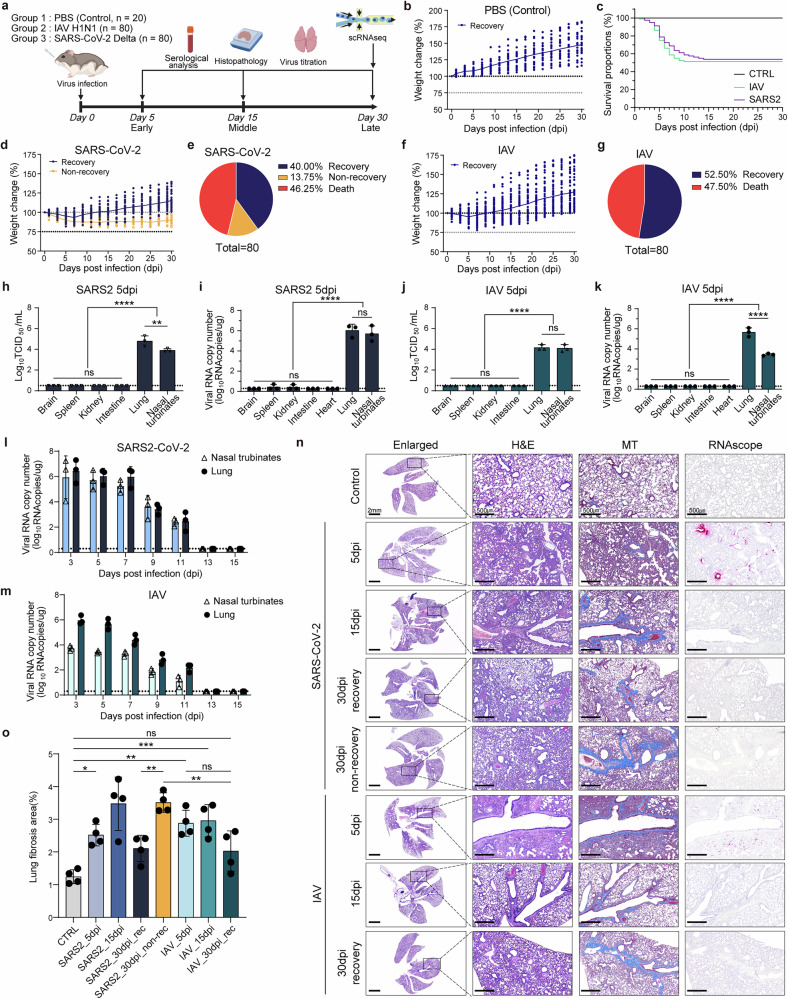
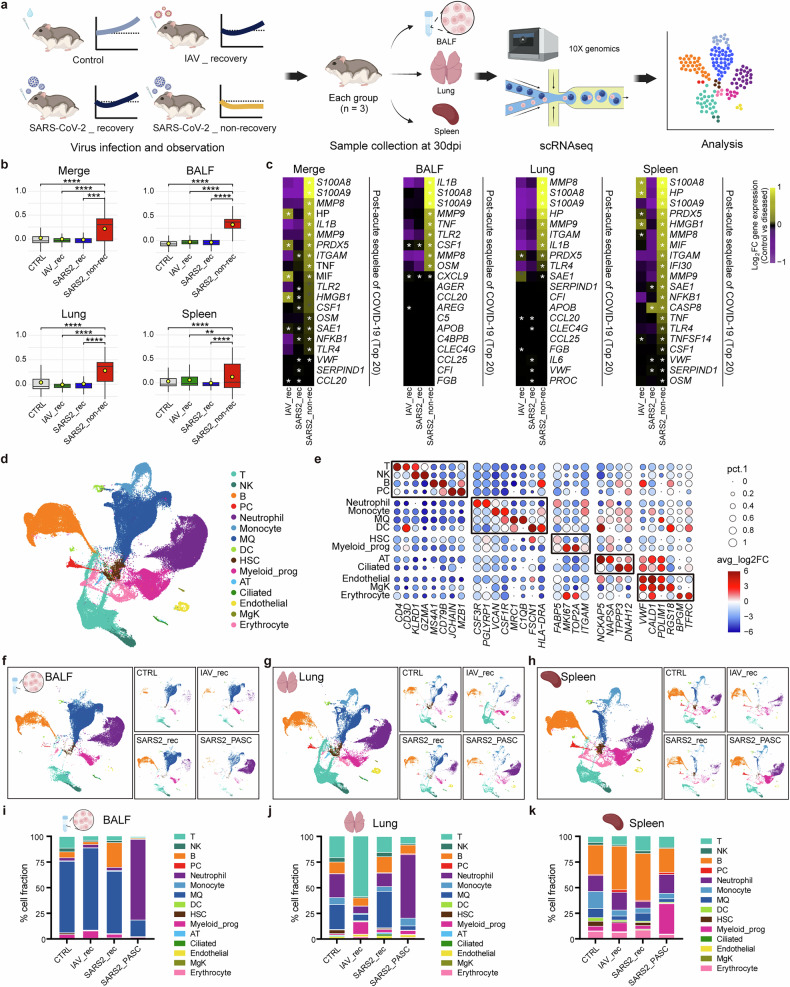
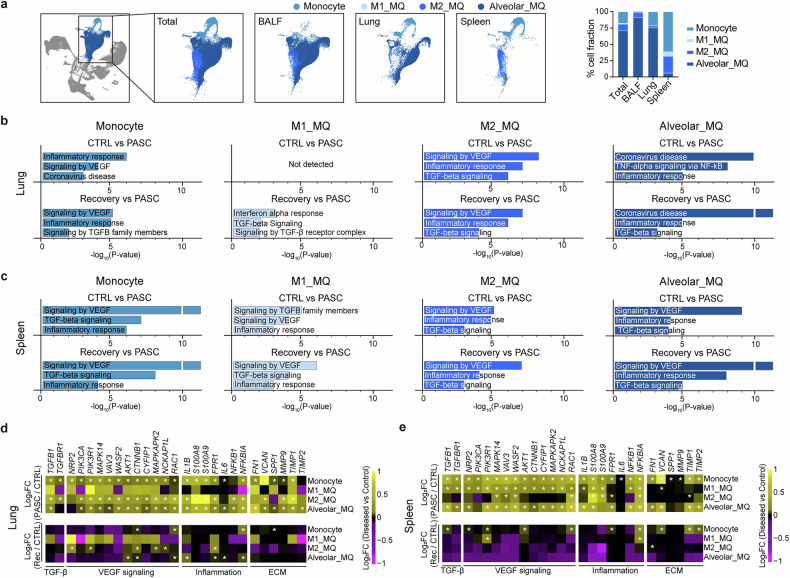
Post-acute sequelae of SARS-CoV-2 (PASC) is characterized by persistent symptoms such as fatigue, respiratory complications and cognitive dysfunction, affecting approximately 13.5% of SARS-CoV-2-infected individuals. Despite its clinical significance, the mechanisms driving PASC remain poorly understood. Here, to address this, we utilized a Phodopus roborovskii hamster model to investigate the long-term effects of SARS-CoV-2 infection compared with influenza A virus. While 46.25-47.50% of hamsters survived SARS-CoV-2 or influenza A virus H1N1 infection, 13.75% of SARS-CoV-2 survivors exhibited impaired weight recovery, severe lung pathology and significant neutrophil accumulation, defining the PASC group. Single-cell RNA sequencing of bronchoalveolar lavage fluid, lung and spleen at 30 days post-infection revealed hallmark PASC gene signatures uniquely upregulated in the PASC group. This was accompanied by elevated neutrophil levels and reduced macrophage populations, indicative of disrupted myeloid cell differentiation. Immunohistochemistry further detected persistent SARS-CoV-2 S1 subunit antigen in the lungs of PASC hamsters at 30 days post-infection, coinciding with marked neutrophil infiltration, which probably drove prolonged inflammatory responses. Indeed, the neutrophils in the PASC group exhibited sustained upregulation of inflammation-related genes, including FPR2, MMP9 and S100A9, which are associated with neutrophil degranulation and extracellular trap formation. Importantly, targeting neutrophil-mediated inflammation with small-molecule inhibitors substantially reduced PASC phenotypes. Among these, Sivelestat, a neutrophil elastase inhibitor, demonstrated the most pronounced efficacy, reducing PASC incidence and mortality, and markedly reducing neutrophil levels. These findings underscore the critical role of neutrophil activation in driving lung damage and chronic inflammation during PASC, offering promising therapeutic strategies for mitigating long-term COVID-19 sequelae.


Conflict of interest statement

Competing interests: The authors declare no competing interests.

Figures

Fig. 1
Fig. 1. Experimental design and analysis of body weight changes, viral load and tissue pathology in SARS-CoV-2 and IAV infection.
a A schematic of the experiment and sample collection. Samples from each group were collected at 5, 15 and 30 dpi for serological analysis, histopathology and virus titration. Notably, tissue samples at 30 dpi were prepared for scRNA-seq analysis. Created with BioRender.com. b Body weight change data of the control group (CTRL, n = 20). c Survival rate of all three groups. d Body weight change data of the SARS-CoV-2 infection group (n = 80). e Proportions of the SARS-CoV-2 infection group based on body weight changes and mortality at 30 dpi. f Body weight change data of the IAV infection group (n = 80). g Proportions of the IAV infection group based on body weight changes and mortality at 30 dpi. h, i TCID50 (h) and viral RNA copy number (i) of various tissues in the SARS-CoV-2 infection group at 5 dpi (n = 3). j, k TCID50 (j) and viral RNA copy number (k) of various tissues in the IAV infection group at 5 dpi (n = 3). l, m Viral RNA copy number in nasal turbinates and lung tissues at 2-day intervals post-infection for SARS-CoV-2 (l) and IAV (m) (n = 3). n H&E, MT staining and RNAscope images. Enlarged images (scale bars, 2 mm) show whole lung images of H&E, with high-magnification images of corresponding areas stained with H&E, MT and RNAscope (scale bars, 500 μm). Light blue in MT-stained images indicates fibrosis, and red dots in RNAscope images represent detected viral RNA. o Graph showing the percentage of fibrosis area relative to total lung area based on MT staining results for each group (n = 4). Data for all graphs are presented as means ± s.d. Statistical significance is indicated as follows: *P < 0.05, **P < 0.01, ***P < 0.001, ****P < 0.0001, ns (P > 0.05), one-way ANOVA. SARS2, SARS-CoV-2.
Fig. 2
Fig. 2. Analysis of hallmark PASC gene expressions and cell proportions based on scRNA-seq data.
a A schematic overview of the scRNA-seq workflow from sample preparation to analysis. Created with BioRender.com. b Module scores calculated from the expression value of human PASC marker genes across the merged tissue (BALF, lung and spleen combined) as well as individual BALF, lung and spleen tissues. The boxes display the interquartile range (IQR = Q3–Q1; the 25th (Q1) to the 75th percentiles (Q3)), with the centerline denoting the median and the yellow dot representing the mean. c Heatmaps depicting the expression of representative human PASC hallmark genes in the merged tissue and individual tissues. The top 20 genes are only described, based on the log2 fold-change (log2FC) of their gene expression compared to the control. d UMAP plot showing the colored visualization of 15 cell types generated from scRNA-seq analysis of BALF, lung and spleen tissues. e Dot plot annotation of the 15 distinct cell types based on 30 marker genes. Dot size and color indicate the percentage (pct.1) of cells expressing each marker and the average log2 fold-change (avg_log2FC) of marker expression, respectively. fh UMAP plots depicting the distribution of cell populations in BALF (f), lung (g) and spleen (h) tissues. Small insets illustrate group-specific distributions within each tissue. ik Proportions of each cell type in control and diseased groups, identified in BALF (i), lung (j) and spleen (k) tissues. Some significance was determined using the Wilcoxon rank-sum test, and all P < 0.05 are represented with an asterisk owing to space limitations (c). Other statistical significances are indicated as follows: *P < 0.05, **P < 0.01, ***P < 0.001, ****P < 0.0001, ns (P > 0.05). The P values were estimated using Wilcoxon rank-sum test. CTRL, control group; IAV_rec, IAV_recovery group; SARS2_rec, SARS-CoV-2_recovery group; SARS2_PASC, SARS-CoV-2_non-recovery group; T, T cells; NK, natural killer cells; B, B cells; PC, plasma cells; DC, dendritic cells; HSC, hematopoietic stem cells; Myeloid_prog, myeloid progenitor cells; AT, pulmonary alveolar type I and type II cells; Ciliated, ciliated cells; Endothelial, endothelial cells; MgK, megakaryocytes.
Fig. 3
Fig. 3. Altered myeloid differentiation and persistent neutrophil accumulation in the SARS2_PASC group, with prolonged presence of S1 antigen.
a UMAP plot showing myeloid cell populations. b Proportions of MQ, monocyte and neutrophil populations across different groups. c Multiplex immunofluorescence image of 30 dpi lung tissues. Each group of tissues was stained with DAPI (nuclei, blue), MPO (green) and CD68 (red) (scale bars, 200 μm). d Quantification of the percentage of MPO+ and CD68+ cells in 30 dpi lung tissues (n = 3). e Trajectory analysis depicting the differentiation of myeloid progenitor cells into either monocytes/MQ or neutrophils with Monocle3. The UMAP is colored by pseudotime. Arrows 1 and 2 indicate distinct differentiation paths. f, g Feature plots showing CEBPE (f) and IRF8 (g) gene expression in each group, respectively. h Representative images showing IHC results of viral antigens in lung tissue. Arrowheads indicate antigen-positive cells (scale bars, 20 μm). ik Quantification of the percentage of SARS-CoV-2 (SARS2) S1-positive (i), N-positive (j) and IAV NP-positive (k) cells in lung tissue at different dpi. l Magnified images (scale bars, 20 μm) comparing the presence of antigens and immune cells at 30 dpi. Arrowheads indicate monocytes/MQs, arrows indicate neutrophils and asterisks highlight areas of inflammation. Data are presented as means ± s.d. (d and ik). Statistical significance is indicated as follows: *P < 0.05, **P < 0.01, ***P < 0.001, ****P < 0.0001, ns (P > 0.05). The P values were estimated using one-way ANOVA. Myeloid_prog, myeloid progenitor cells; CTRL, control group; IAV_rec, IAV_recovery group; SARS2_rec, SARS-CoV-2_recovery group; SARS2_PASC, SARS-CoV-2_non-recovery group; S1, spike protein S1 subunit; N, nucleocapsid; NP, nucleoprotein.
Fig. 4
Fig. 4. Characterization of myeloid cell populations and comparative gene expression patterns.
a UMAP plot and distribution ratios of monocyte and MQ subpopulations across tissues. b, c Bar plots displaying −log10(P value) from EnrichR analysis with MSigDB Hallmark, GOBP, KEGG and Reactome databases. The analysis focuses on specifically elevated genes in the SARS2_PASC group compared with control (CTRL) or the IAV_ and SARS-CoV-2_ recovery (recovery) group in monocytes and MQ subpopulations. Data are presented for lung (b) and spleen (c) tissues. d, e Heatmap displaying the log2FC values of fibrosis-related pathway and inflammation genes in monocyte and MQ subpopulations of the lung (d) or spleen (e) tissue. log2FC values represent the average expression levels of each gene in the diseased groups compared to the control and are depicted by color intensity. Significance was determined using the Wilcoxon rank-sum test, and all P < 0.05 are represented with an asterisk owing to space limitations. M1_MQ, M1 type macrophages; M2_MQ, M2 type macrophages; Alveolar_MQ, alveolar macrophages.
Fig. 5
Fig. 5. Gene expression and functional analysis of neutrophil subclusters.
a Heat maps displaying notable upregulated or downregulated genes in neutrophils compared with the control group. log2FC values of average expression per gene are represented with colors ranging from high (yellow) to low (purple). b Dot plot of the IPA canonical pathways analysis showing the −log10(P value) (dot size) and the Z score (color), in diseased groups compared with control. c UMAP and pie chart depicting the total neutrophil subcluster population. d Multiple violin plot illustrating the expression levels of specific marker genes in the different neutrophil subclusters. e UMAPs and pie charts (left) displaying the population distribution of each neutrophil subcluster for each group. Bar plots (right) showing relative population changes are noted in all diseased groups compared with the control group. fh Heat maps of neutrophil function-related genes in BALF (f), lung (g) and spleen (h). The log2FC expression values of each gene in the diseased groups compared with the control group is represented by color. i GM-CSF and G-CSF levels measured via ELISA in hamster serum at 30 dpi across all groups (n = 6). Data are presented as means ± s.d. j Heat maps of relative gene expression levels of CSF2RA and CSF3R in lung or spleen tissues. log2FC values of gene expression are calculated for GMP, Neu_prog and neutrophil subclusters, comparing the diseased groups with control group. k Trajectory analysis of myeloid progenitors and neutrophil subclusters showing two differentiation paths from GMP to neutrophil subclusters. l Box plots displaying the pseudotime distribution of each cell in the subclusters along the two differentiation paths. m, n Box plots displaying module scores for aging and apoptosis-related gene expression (m), and leukocyte adhesion to vascular endothelial cell (n) in neutrophil subclusters; aging (de Magalhaes et al. [24]), apoptosis (M5902) and leukocyte adhesion to vascular endothelial cells (M14170, GO:0061756). o Violin plots showing the expression levels of SELL and ITGB2, key genes involved in leukocyte adhesion to vascular endothelial cells. p Box plots showing module scores of lung fibrosis (WP3624) and TNFA signaling via NFKB (M5890) in neutrophil subclusters. Some significance was determined using the Wilcoxon rank-sum test, and all P < 0.05 are represented with an asterisk owing to space limitations (fh and j). Other statistical significances are indicated as follows: *P < 0.05, **P < 0.01, ***P < 0.001, ****P < 0.0001, ns (P > 0.05). The P values were calculated using Wilcoxon rank-sum test (fh, j and mp) and one-way ANOVA (i). CTRL, control group; IAV_rec, IAV_recovery group; SARS2_rec, SARS-CoV-2_recovery group; SARS2_PASC, SARS-CoV-2_non-recovery group.
Fig. 6
Fig. 6. Sivelestat, a neutrophil elastase inhibitor, reduces fibrosis and inflammation in PASC.
a A schematic overview of the animal experiment. The diagram reflects each group of the inhibitor treatment schedule. Created with BioRender.com. bf Body weight change data of ‘Non-treat’ (SARS2, SARS-CoV-2 infection only) (b), 2% DMSO in a saline treatment (2% DMSO) (c), WRW4/2% DMSO in a saline treatment (WRW4) (d), Paquinimod/2% DMSO in a saline treatment (Paquinimod) (e) and Sivelestat/2% DMSO in a saline treatment (f) (n = 50). g Proportion of recovery (blue), non-recovery (yellow) and death (red) of each group. h, i Relative expression levels (indicated as delta–delta cycle threshold (Ct) values) of IL1B, NFKB1 and IFNG at 15 (h) and 30 (i) dpi in the lung. The gene expressions were normalized by glyceraldehyde 3-phosphate dehydrogenase (GAPDH) as a housekeeping gene. Statistical significances are indicated as follows: *P < 0.05, **P < 0.01, ***P < 0.001, ****P < 0.0001, ns (P > 0.05), one-way ANOVA. CTRL, control group; Non-treat_rec, recovery group without treatment; Non-treat_PASC, non-recovery group without treatment; 2% DMSO_rec, recovery group treated with 2% DMSO in saline; 2% DMSO_PASC, non-recovery group treated with 2% DMSO in saline.
Fig. 7
Fig. 7. Effects of neutrophil-targeted therapies on lung pathology and inflammation.
a, b H&E and MT staining image of lung tissue at 15 (a), 30 (b) dpi. Enlarged images (scale bars, 2 mm) represent total lung images of H&E, with the high-magnification section showing corresponding areas stained with H&E and MT (scale bars, 500 μm). Light-blue coloration in the MT-stained images indicates areas of fibrosis. c, d The percentage of fibrosis area relative to total lung area based on MT staining results at 15 (c) and 30 (d) dpi (n = 4). e, f Quantification of the percentage of MPO+ cells in lung tissues at 15 (e) and 30 (f) dpi (n = 4). g, h Multiplex immunofluorescence images of lung tissues at 15 (g) and 30 (h) dpi, stained for nuclei (DAPI, blue), MPO (green) and CD68 (red) (scale bars, 200 μm). Data for all graphs are presented as means ± s.d. Statistical significances are indicated as follows: *P < 0.05, **P < 0.01, ***P < 0.001, ****P < 0.0001, ns (P > 0.05), one-way ANOVA. CTRL, control group; Non-treat_rec, recovery group without treatment; Non-treat_PASC, non-recovery group without treatment; 2% DMSO_rec, recovery group treated with 2% DMSO in saline; 2% DMSO_PASC, non-recovery group treated with 2% DMSO in saline.
Fig. 8
Fig. 8. Sivelestat treatment selectively modulates innate immune cell populations in lung and spleen.
a A schematic overview of drug administration and flow cytometry analysis. Created with BioRender.com. b, c Body weight change data of ‘Non-treat’ (SARS2, SARS-CoV-2 infection only, n = 40) (b) and Sivelestat/2% DMSO in a saline treatment (n = 50) (c). d Proportion of recovery (blue), non-recovery (yellow) and death (red) of each group. e, f Percentage of B cells (CD79⁺), T cells (CD3⁺), monocytes/MQs (CD11b⁺CD14⁺) and neutrophils (CD11b⁺Ly6G⁺) in the lung (e) and spleen (f). Data for all graphs are presented as means ± s.d. Statistical significances are indicated as follows: *P < 0.05, **P < 0.01, ***P < 0.001, ****P < 0.0001, ns (P > 0.05), Mann–Whitney test. CTRL, control group.

References

    1. Zhu, N. et al. A Novel Coronavirus from Patients with Pneumonia in China, 2019. N. Engl. J. Med.382, 727–733 (2020). - PMC - PubMed
    1. Mishra, N. P. et al. Global impacts of pre- and post-COVID-19 pandemic: Focus on socio-economic consequences. Sens. Int.1, 100042 (2020). - PMC - PubMed
    1. Mongin, D. et al. Effect of SARS-CoV-2 prior infection and mRNA vaccination on contagiousness and susceptibility to infection. Nat. Commun.14, 5452 (2023). - PMC - PubMed
    1. Manirambona, E., Okesanya, O. J., Olaleke, N. O., Oso, T. A. & Lucero-Prisno, D. E. III Evolution and implications of SARS-CoV-2 variants in the post-pandemic era. Discov. Public Health21, 16 (2024).
    1. Horberg, M. A. et al. Post-acute sequelae of SARS-CoV-2 with clinical condition definitions and comparison in a matched cohort. Nat. Commun.13, 5822 (2022). - PMC - PubMed

Substances

LinkOut - more resources