. 2025 Oct;7(10):2099-2116.
doi: 10.1038/s42255-025-01379-7. Epub 2025 Sep 23.

Cholesterol metabolic reprogramming mediates microglia-induced chronic neuroinflammation and hinders neurorestoration following stroke

Affiliations

Cholesterol metabolic reprogramming mediates microglia-induced chronic neuroinflammation and hinders neurorestoration following stroke

Qiang Zhao et al. Nat Metab. 2025 Oct.

Abstract

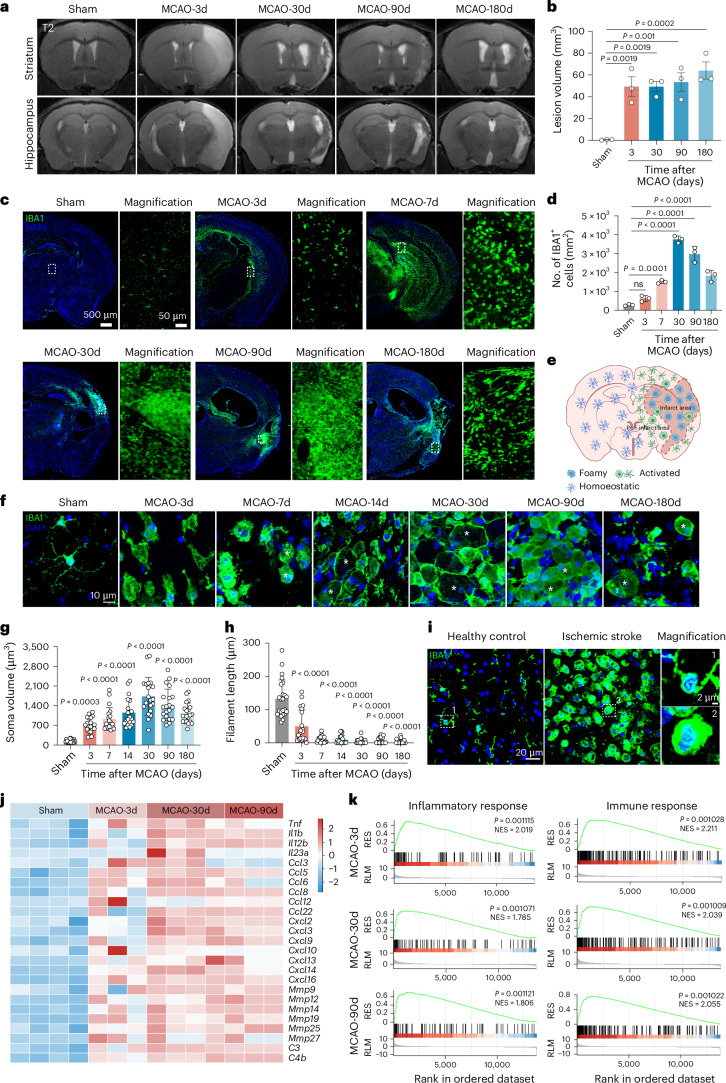
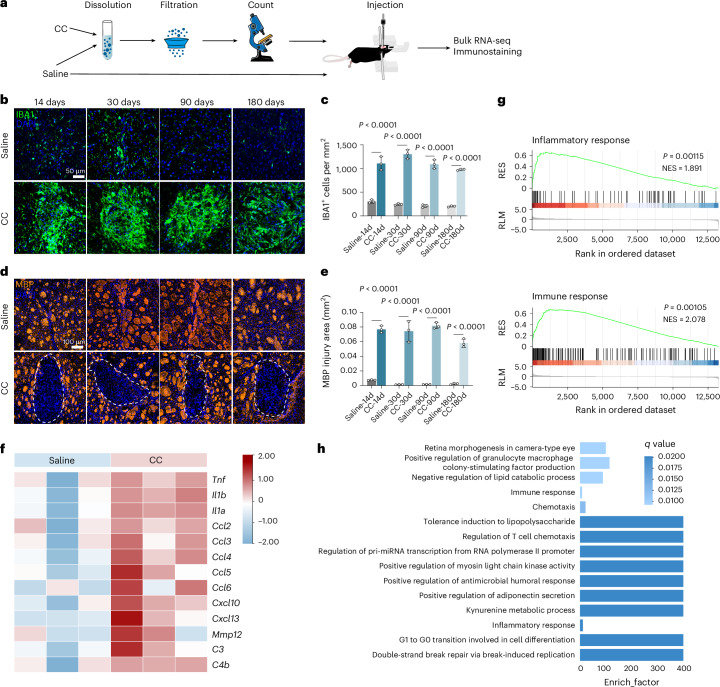
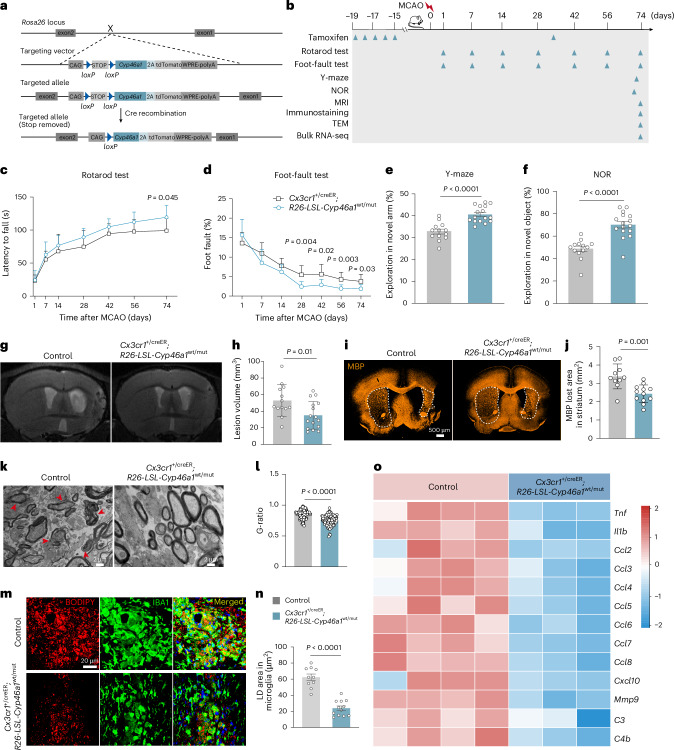
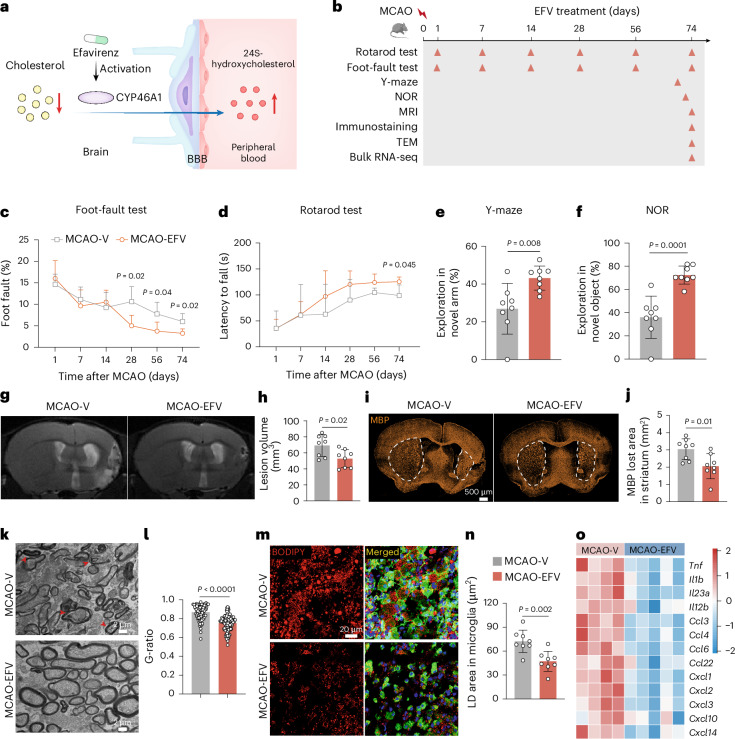
Chronic neuroinflammation is a major obstacle to post-stroke recovery, yet the underlying mechanisms, particularly the link between prolonged microglial activation and cholesterol metabolism, are not fully known. Here we show that ischaemic injury induces persistent microglial activation that perpetuates chronic inflammation, leading to microglial cholesterol accumulation and metabolic reprogramming. Using single-cell RNA sequencing, we identified distinct stroke-associated foamy microglia clusters characterized by extensive reprogramming of cholesterol metabolism. Furthermore, direct intracerebral free cholesterol or cholesterol crystal infusion recapitulated sustained microglial activation, directly linking aberrant cholesterol metabolism to prolonged neuroinflammatory responses. Therapeutically, we demonstrate that reducing microglial cholesterol overload through genetic or pharmacological activation of CYP46A1 in male mice promotes white matter repair and functional recovery. These findings highlight microglial cholesterol metabolism as a key driver of post-stroke inflammation, offering therapeutic strategies targeting cholesterol metabolism to mitigate long-term brain damage and promote neurorestoration, potentially improving stroke-related disability outcomes.


Conflict of interest statement

Competing interests: The authors declare no competing interests.

Figures

Fig. 1
Fig. 1. Microglia elicit a long-lasting brain-resident inflammatory response after MCAO.
a,b, Representative T2-weighted MRI images (a) and quantification (b) of persistent ischaemic lesion quantified across the entire brain at acute and chronic stages after MCAO; n = 3 mice per group. c,IBA1 immunostaining reveal a significant increase in resident microglia at days 3, 7, 30, 90 and 180 after MCAO. For each image, the right panel shows a higher-magnification image of the lesion core (highlighted by the dashed white rectangle. d, Quantitative data of IBA1+ cell numbers in c across acute and chronic stages of MCAO; n = 3 mice per group. e, Schematic illustration of cerebral infarction and corresponding microglial morphological changes in the lesion core and peri-lesion regions. f, IBA1 immunostaining showing microglial morphology in the lesion area at days 3, 7, 14, 30, 90 and 180 post MCAO in male mice. Asterisks indicate foamy microglia. g,h, Quantification of morphological parameters, including soma volume (g) and filament length (h), is shown for MCAO-3d, MCAO-7d, MCAO-14d, MCAO-30d, MCAO-90d and MCAO-180d (n = 20 cells from three mice each) and sham (n = 23 cells from three mice). i, IBA1 immunostaining of human brain samples from a patient with ischaemic stroke (n = 1) and a healthy control (n = 1). Dashed white squares indicate regions shown at higher magnification. j, Heatmap showing upregulation of inflammatory genes in microglia isolated at 3, 30 and 90 days post MCAO compared to sham control; n = 4 mice per group for sham and MCAO-30d groups; n = 3 mice per group for MCAO-3d and MCAO-90d groups. k, GSEA showing upregulation of inflammatory and immune response pathways in microglia at both acute and chronic stages post MCAO. Normalized enrichment scores (NES) and P values are displayed; n = 4 mice per group for sham and MCAO-30d groups; n = 3 mice per group for MCAO-3d and MCAO-90d groups. RES, running enrichment score; RLM, ranked list metric. Data are mean and s.d. Statistical significance was assessed using one-way ANOVA (b,d,g,h) followed by Dunnett’s multiple comparisons test, or a one-sided permutation test, and the resulting P values were adjusted for multiple comparisons (k). Source data
Fig. 2
Fig. 2. Continual microglial depletion during the chronic stage improves stroke-induced neurological outcomes.
a, Experimental timeline showing PLX administration to MCAO male mice during the chronic stage (from 14 days to 74 days post MCAO). NOR, novel object recognition. b,c, IBA1 immunostaining (b) and quantification (c) demonstrating PLX-induced microglial depletion in both ipsilateral and contralateral hemispheres during the chronic phase post MCAO; n = 8 mice per group. V, vehicle. d,e, Motor and balance functions were assessed using rotarod (d) and foot-fault (e) tests in MCAO mice treated with PLX or vehicle; n = 8 mice per group. f,g, Cognitive performance evaluation using the Y-maze test (day 72) (f) and NOR test (day 70) (g) in MCAO mice treated with PLX or vehicle; n = 8 mice per group. h, Representative T2-weighted MRI images showing reduced brain lesion volume in PLX-treated MCAO mice compared to vehicle controls; n = 8 mice per group. i, MBP immunostaining revealing enhanced white matter repair (reduced MBP+ area loss) in the striatum of PLX-treated MCAO mice compared to vehicle controls; n = 8 mice per group. Data are mean and s.d. Statistical significance was assessed by two-way ANOVA followed by Bonferroni’s multiple comparisons test (ce), one-way ANOVA followed by Bonferroni’s multiple comparisons test (f,g) or two-tailed unpaired Student’s t-test (h,i). NS, not significant. Source data
Fig. 3
Fig. 3. MCAO induces cholesterol metabolic reprogramming in microglia during the chronic stage.
a, BODIPY and IBA1 double immunostaining on frozen sections showing lipid droplet accumulation in microglia during acute and chronic stages post MCAO. Lipid droplets are labelled with BODIPY; IBA1 marks microglia. Colocalization highlights microglia-specific lipid droplet accumulation. Top-right insets show higher magnification of the area inside white dashed rectangles. b, Quantitative data of the BODIPY+ area within IBA1⁺ cells across time points; n = 3 mice per group. c, Principal component analysis (PCA) of lipid species in microglia shows distinct clustering of sham and MCAO groups at days 3, 30 and 90, indicating time-dependent lipidomic shifts. d, Violin plots illustrating alterations in cholesterol esters within microglia, measured by a targeted lipidomics method by liquid chromatography–tandem mass spectrometry (LC–MS/MS) with multiple reaction monitoring during the acute and chronic stages post MCAO. Sham and MCAO-3d, n = 6 mice per group; MCAO-30d and MCAO-90d, n = 5 mice per group. e, Violin plots showing free cholesterol levels in microglia, measured by a targeted lipidomics method by LC–MS/MS with multiple reaction monitoring during the acute and chronic phases post MCAO. Sham and MCAO-3d, n = 6 mice per group; MCAO-30d and MCAO-90d, n = 5 mice per group. f, PLM and IBA1 immunostaining revealing cholesterol crystal (CC) deposition within microglia during acute and chronic phases; insets show higher magnification of the area inside white dashed rectangles. g, Quantification of crystal number per mm2 within IBA1+ cells; n = 3 mice per group. h, Heatmap analysis displaying changes in cholesterol metabolism-associated gene expression in microglia during the acute and chronic stage post MCAO. Sham and MCAO-3d, n = 4 mice per group; MCAO-30d and MCAO-90d, n = 3 mice per group. i, GSEA pathway enrichment analysis showing upregulation of cholesterol metabolism-associated pathways in microglia during the acute and chronic stage post MCAO. Sham and MCAO-3d, n = 4 mice per group; MCAO-30d and MCAO-90d, n = 3 mice per group. Data are mean and s.d. Statistical significance was assessed by one-way ANOVA followed by Dunnett’s multiple comparisons test (b,g) or a one-sided permutation test, and the resulting P values were adjusted for multiple comparisons (i). Source data
Fig. 4
Fig. 4. MCAO elicits SAM-foamy microglial clusters during the chronic stage.
a, Workflow showing isolation and scRNA-seq of microglia from sham-operated and MCAO mice at 90 days post MCAO; n = 2 biological replicates per group. b, Uniform manifold approximation and projection (UMAP) of extracted microglia, coloured by inferred cluster identity from sham and MCAO male mice, showing distinct microglial subpopulations. SAM-iron, stroke-associated iron microglia. c, Violin plot illustrating gene signature expression across microglial clusters. d, Bar graphs showing cluster proportion, indicating MCAO-induced shifts in microglial composition. e, UMAP plots highlighting expression of representative genes associated with microglial activation, lipid metabolism and inflammation. f, Heatmap analysis depicting the expression of inflammation-related factors in microglia during the chronic stage post MCAO, revealing upregulated pro-inflammatory pathways. g, Trajectory reconstruction of all microglial cells, revealing four branches of microglial differentiation post MCAO, suggesting dynamic microglial transitions. h, Trajectory analysis highlighting the temporal expression patterns of key genes involved in cholesterol metabolism (for example, Abcg1, Apoe, Lpl, Trem2 and Tspo) and inflammation-related factors (for example, Ccl3, Ccl4, Ccl6, Cxcl14 and Cxcl16) across microglial differentiation states.
Fig. 5
Fig. 5. Cholesterol crystal deposition contributes to microglia-mediated chronic neuroinflammation and hinders white matter repair in mice.
a, Experimental design for cholesterol crystal (CC) injection into the brain parenchyma, investigating their long-term effects on microglial activation and myelin repair. b,c, IBA1 immunostaining (b) and quantification (c) demonstrate sustained microglial activation after cholesterol crystal injection compared to saline controls; n = 3 mice per group. d,e, Cholesterol crystal injection immunostaining (d) and quantification (e) demonstrate impaired white matter repair, evidenced by increased MBP loss compared to vehicle controls; n = 3 mice per group. f, Heatmap showing upregulation expression of inflammation-related genes in microglia 90 days after cholesterol crystal injection compared to control; n = 3 mice per group. g, GSEA identifies upregulation of inflammatory and immune-related pathways in cholesterol crystal-injected microglia. NES and P values are shown for each gene set; n = 3 mice per group. h, Gene Ontology enrichment analysis revealed significant enrichment of immune and inflammatory response pathways, further supporting cholesterol crystal-induced neuroinflammation; n = 3 mice per group. Data are mean and s.d. Statistical significance was assessed by two-way ANOVA followed by Bonferroni’s multiple comparisons test (c,e) or a one-sided permutation test, and the resulting P values were adjusted for multiple comparisons (g). Source data
Fig. 6
Fig. 6. Genetic Cyp46a1 overexpression in microglia significantly ameliorates neurological deficit post stroke.
a, Schematic diagram illustrating the strategy used to generate microglia-specific Cyp46a1 overexpression in adult male mice. b, Experimental timeline for testing the effects of microglial Cyp46a1 overexpression during the chronic stage post MCAO. TEM, transmission electron microscopy. c,d, Motor and balance functions were assessed using the rotarod test (c) and foot-fault test (d) in MCAO mice with or without Cyp46a1 overexpression. Cyp46a1-conditional knock-in (cKI), n = 16 mice; control, n = 13 mice. e,f, Cognitive function was evaluated using the Y-maze test (day 72 post MCAO) (e) and NOR test (day 70 post MCAO) (f). Cyp46a1-cKI, n = 16 mice; control, n = 13 mice. g,h, T2-weighted MRI (g) and quantification (h) showing reduced brain lesion volume in mice with Cyp46a1 overexpression. Cyp46a1-cKI, n = 16 mice; control, n = 13 mice. i,j, MBP immunostaining (i) and quantification (j) indicate improved white matter integrity in Cyp46a1-overexpressing mice. Cyp46a1-cKI, n = 12 mice; control, n = 10 mice. k, Representative transmission electron microscopy images of the basal ganglia on day 74 post MCAO. Red arrowheads indicate demyelinated axons. l, The G-ratio (ratio of the inner axon diameter to the total outer fibre diameter) was compared between Cyp46a1-cKI and control mice. Cyp46a1-cKI, n = 105 axons from three mice; control, n = 98 axons from three mice. m,n, Lipid droplet (LD) visualization (m) and quantification (n) in microglia from the lesion area of Cyp46a1-cKI or control MCAO mice. Cyp46a1-cKI, n = 12 mice; control, n = 10 mice. o, Microglia-specific Cyp46a1 overexpression suppressed pro-inflammatory gene expression in microglia post MCAO. Cyp46a1-cKI, n = 3 mice; control, n = 4 mice. Colour legend in n applies to all bar graphs. Data are presented mean and s.d. Statistical significance was assessed by two-way ANOVA (c,d) followed by Bonferroni’s multiple comparisons test or two-tailed unpaired Student’s t-test (e,f,h,j,l,n). Source data
Fig. 7
Fig. 7. EFV, a CYP46A1 activator, enhances neurorestoration after stroke.
a, Schematic illustrating the mechanism of EFV as a CYP46A1 activator that promotes cholesterol metabolism and neurorestoration post stroke. b, Experimental timeline depicting EFV or vehicle treatment in MCAO male mice during the chronic phase. c,d, Motor and balance functions were assessed using foot-fault (c) and rotarod (d) tests in MCAO mice treated with EFV or vehicle control; n = 8 mice per group. e,f, Cognitive function evaluation using the Y-maze test (day 72 post MCAO) (e) and NOR test (day 70 post MCAO) (f) in EFV and vehicle-treated MCAO mice; n = 8 mice per group. g,h, T2-weighted MRI images (g) and quantification (h) showing reduced brain lesion volume in EFV-treated mice compared to vehicle controls; n = 8 mice per group. i,j, MBP immunostaining (i) and quantification (j) showing improved white matter repair in EFV-treated mice compared to vehicle controls; n = 8 mice per group. k, Representative transmission electron microscope images of the basal ganglia at day 74 post MCAO; red arrowheads indicate demyelinated axons. l, G-ratio (ratio of the inner axon diameter to the total outer fibre diameter) was quantified and compared between EFV-treated and vehicle-treated groups; MCAO-EFV, n = 112 axons from three mice; MCAO-V, n = 78 axons from three mice. m,n, Lipid droplet accumulation (m) and quantification (n) in microglia from the lesion area was reduced by EFV treatment; n = 8 mice per group. o, Heatmap demonstrating downregulation of pro-inflammatory gene expression in microglia post MCAO following EFV treatment. MCAO-V, n = 4 mice; MCAO-EFV, n = 5 mice. Colour legend in n applies to all bar graphs. Data are mean and s.d. Statistical significance was assessed by two-way ANOVA (c,d) followed by Bonferroni’s multiple comparisons test or two-sided unpaired Student’s t-test (e,f,h,j,l,n). MCAO-V, MCAO-vehicle; MCAO-EFV, MCAO-efavirenz. Source data
Extended Data Fig. 1
Extended Data Fig. 1. Microglia induce a sustained brain-resident inflammatory response after MCAO.
a, Double immunostaining for IBA1 (microglial marker) and myelin basic protein (MBP, myelin marker) illustrates sustained myelin loss and microglial accumulation at days 3, 7, 14, 30, 90, and 180 post-MCAO. Dashed lines indicate regions of MBP disruption. Representative images from one of three independent experiments are shown. Scale bar, 500 µm. b, Co-immunostaining of MBP and IBA1 at days 30 and 90 post-MCAO shows spatial association between microglial activation and regions of myelin damage. Representative images from one of three independent experiments are shown. Scale bar, 50 µm. c, Workflow of bulk RNA-seq analysis, detailing the collection and processing of CD11b+ microglia for transcriptomic profiling post-MCAO. d, Quantification of CD11b+ cells reveals increased microglia number during the chronic stage post-MCAO. sham, n = 6 mice/group; MCAO group, n = 4 mice/group. e, Heatmap illustrating changes of toll-like receptor (TLR) signaling and NOD-, LRR-, and pyrin domain-containing protein 3 (NLRP3) inflammasome pathways in microglia during the chronic stage post-MCAO. n = 4 mice for the sham group; n = 3 mice per MCAO group. f, Gene set enrichment analysis (GSEA) identifies positive enrichment of inflammatory and immune response pathways. Normalized enrichment scores (NES) and P-value for each gene set are displayed. n = 4 mice for the sham group; n = 3 mice per MCAO group. RES: Running enrichment score; RLM: Ranked list metric. Data are presented as mean ± SD. Statistical significance was assessed by one-way ANOVA (d) followed by Dunnett’s multiple comparisons test, or a one-sided permutation test, and the resulting P-values were adjusted for multiple comparisons(f). Source data
Extended Data Fig. 2
Extended Data Fig. 2. MCAO induces chronic neuroinflammation and microglial cholesterol metabolic reprogramming in female mice.
a, IBA1 immunostaining showing altered microglial morphology in the lesion area at days 3 and 90 post-MCAO compared to sham controls in female mice. Scale bar, 20 µm; n = 3 mice/group; Representative images from one of two independent experiments are shown. b, Heatmap depicting upregulation of inflammatory genes in microglia isolated at days 3 and 90 post-MCAO compared to sham controls in female mice. n = 4 mice for the sham group; n = 3 mice per MCAO group. c, Gene set enrichment analysis (GSEA) identifying enrichment of inflammatory and immune-related pathways. Normalized enrichment scores (NES) and P-value for each gene set are displayed. sham, n = 4 mice/group; MCAO group, n = 3 mice/group. RES: Running enrichment score, RLM: Ranked list metric. d, e, Immunofluorescence detection of lipid droplets in microglia using BODIPY and IBA1 co-staining at 3 and 90 days post-MCAO in female mice, highlighting lipid accumulation over time. Scale bar, 20 µm; n = 3 mice/group; f, g, Polarized light microscopy (PLM) assessing cholesterol crystals at 3 and 90 days post-MCAO in female mice, demonstrating cholesterol crystal accumulation during the chronic phase. Crystal birefringence was confirmed by orientation-dependent interference colors under PLM with a first-order λ compensator. Main image: scale bar, 20 µm; Higher-magnification view: scale bar, 10 μm. n = 3 mice/group; ns: no significance; Representative images from one of three independent experiments are shown. h, Heatmap illustrating differential expression of cholesterol metabolism-associated genes in microglia at 3 and 90 days post-MCAO in female mice, revealing metabolic reprogramming. n = 4 mice for the sham group; n = 3 mice per MCAO group. Data are presented as mean ± SD. Statistical significance was assessed by one-way ANOVA (a, e, g) followed by Dunnett’s multiple comparisons test, or a one-sided permutation test, and the resulting P-values were adjusted for multiple comparisons©. Source data
Extended Data Fig. 3
Extended Data Fig. 3. Effect of PLX-induced microglial depletion on ipsilateral microglia during the chronic phase post-MCAO.
IBA1 immunostaining demonstrates a significant reduction in microglial presence following PLX5622 (PLX) administration during the chronic phase post-MCAO, confirming effective microglial depletion. Scale bar, 500 µm; n = 8 mice/group; Data are presented as mean ± SD. Statistical significance was assessed by two-way ANOVA followed by Bonferroni’s multiple comparisons test. Source data
Extended Data Fig. 4
Extended Data Fig. 4. MCAO evokes cholesterol metabolic reprogramming in microglia during the chronic stage.
a, b, H&E staining assessing foam cell formation in the infarct area during the chronic stage post-MCAO. Scale bar, 20 µm; n = 3 mice/group. c, Immunofluorescence detection of lipid droplets in microglia using BODIPY and IBA1 co-immunostaining during the acute and chronic stage post-MCAO. Scale bar, 500 µm. The low panel shows a higher-magnification image for detailed visualization. Scale bar, 50 µm. Representative images from one of three independent experiments are shown. d, e, Filipin III (pink pseudo‐color) staining was employed to assess free cholesterol accumulation in microglia during the chronic phase post-MCAO. Scale bar, 20 µm; n = 3 mice/group. f, IBA1 immunostaining and polarized light microscopy (PLM) detecting needle-like cholesterol crystals (CCs) in the infarct area on day 30 and day 90 post-MCAO. Scale bar, 50 µm. Representative images from one of three independent experiments are shown. g, PLM shows birefringent color changes in CCs at days 3, 30, and 90 post-MCAO. Anisotropic crystalline nature confirmed by orientation-dependent interference colors using a first-order λ compensator. Scale bar, 20 µm. Representative images from one of three independent experiments are shown. h, Gene set enrichment analysis (GSEA) revealed changes in the cholesterol metabolism pathway across pairwise comparisons between days 3 vs 30, days 3 vs 90, and days 30 vs 90 post-MCAO. Normalized enrichment scores (NES) and P value for each gene set are displayed. n = 4 mice/group for sham and MCAO-30d groups; n = 3 mice/group for MCAO-3d and MCAO-90d groups. i, KEGG analysis reveals upregulation of cholesterol metabolism-related genes at days 3, 30, and 90 post-MCAO compared to sham controls. NES and P value for each gene set are displayed. n = 4 mice/group for sham and MCAO-30d groups; n = 3 mice/group for MCAO-3d and MCAO-90d groups. Data are presented as mean ± SD. Statistical significance was assessed by one-way ANOVA (b, e) followed by Dunnett’s multiple comparisons test, a one-sided hypergeometric test, and P-values were adjusted for multiple comparisons to generate q-values (h), or a one-sided hypergeometric test, and P-values were adjusted for multiple comparisons to generate q-values (i). Source data
Extended Data Fig. 5
Extended Data Fig. 5. Effects of PLX5622 on cholesterol metabolism and brain cell populations post-MCAO.
a, Flow cytometry gating strategy used to assess cellular lipid changes in response to PLX5622 (PLX) treatment. b, PLX treatment significantly depleted the microglial population following MCAO. n = 3 mice/group. c, Lipid droplet accumulation increased in brain macrophages after PLX treatment, suggesting a compensatory response. n = 3 mice/group. d, PLX treatment led to elevated lipid burden in astrocytes post-MCAO. n = 3 mice/group. e, BODIPY staining revealed reduced overall lipid deposition in the brain following PLX-induced microglial depletion. Scale bar, 20 µm; n = 8 mice/group. f, Polarized light microscopy (PLM) showed decreased cholesterol crystal (CC) accumulation in the brain after PLX treatment. The anisotropic crystalline nature was confirmed by orientation-dependent interference colors under PLM with a first-order λ compensator. Scale bar, 20 µm; n = 8 mice/group. Data are presented as mean ± SD. Statistical significance was assessed by a two-sided unpaired Student’s t-test (b, c, d, e, f). Source data
Extended Data Fig. 6
Extended Data Fig. 6. Changes in cholesterol and other lipid species in serum and CSF during the chronic stage post-MCAO.
a, Principal coordinate analysis (PCA) of serum lipid profiles in sham-operated and 90-day post-MCAO mice reveals distinct clustering, indicating stroke-associated lipidomic alterations. b, Kyoto encyclopedia of genes and genomes (KEGG) pathway enrichment analysis identifies dysregulated lipid metabolism pathways at day 90 post-MCAO compared to the sham controls. n = 9 mice for the sham group; n = 6 mice for the MCAO-90d group. c, Class scatter analysis illustrates distinct lipid profile clustering between sham and MCAO-90d groups, indicating stroke-induced lipidomic changes. n = 9 mice for the sham group; n = 6 mice for the MCAO-90d group. d, Cluster analysis of serum lipidomics in sham-operated and MCAO-90d mice, showing differential lipid composition between groups. n = 9 mice for the sham group; n = 6 mice for the MCAO-90d group. e, Heatmap analysis depicting the abundance levels of cholesterol esters (CEs) in sham vs MCAO-90d groups, demonstrating significant changes in CEs composition. n = 9 mice for the sham group; n = 6 mice for the MCAO-90d group. f, Cluster analysis of cerebrospinal fluid (CSF) lipidomics in sham and MCAO-90d groups, highlighting stroke-induced lipidomic alterations in CSF. n = 7 mice for the sham group; n = 8 mice for the MCAO-90d group. g, Violin plots demonstrate a significant elevation of various lipid species in the MCAO-90d group compared to the sham group, indicating persistent dysregulation of lipid metabolism. The center line indicates the median, the box bounds represent the interquartile range (IQR) from the 25th to the 75th percentile, and the whiskers extend to the minimum and maximum values within 1.5 times the IQR. n = 7 mice for the sham group; n = 8 mice for the MCAO-90d group. Statistical significance was determined using a one-sided hypergeometric test, and P-values were adjusted for multiple comparisons to generate q-values(b).
Extended Data Fig. 7
Extended Data Fig. 7. ScRNA-seq analysis of CD11b+ cells during the chronic stage post-MCAO.
a, Uniform manifold approximation and projection (UMAP) of extracted CD11b⁺ cells from sham and MCAO mice, showing distinct cellular distributions between groups. b, Bar graphs depicting the proportion of each undefined cluster among CD11b⁺ cells, highlighting changes in cell populations following MCAO. c, UMAP colored by inferred cluster identity, illustrating transcriptional heterogeneity in CD11b⁺ cells from sham and MCAO mice. d, Bar graphs illustrating the distribution of defined immune and microglial clusters, revealing group-specific differences in subpopulation abundance. e, Dot plot displaying selected differentially expressed genes for each cluster. Dot size represents the percentage of expressing cells; Color represents average gene expression level, highlighting key transcriptomic alterations. f, Subclustering UMAP showing the distribution of microglial clusters in MCAO and sham groups, identifying distinct microglial subtypes. g, Bar graphs showing the proportion of each microglial cluster, demonstrating MCAO-induced shifts in microglial subpopulations.
Extended Data Fig. 8
Extended Data Fig. 8. Free cholesterol overload induces microglial activation and myelin injury.
a, b, Free cholesterol (FC) injection induced increased microglial activation (a) and myelin damage (b) during the chronic stage post-injection, compared to DMSO-treated controls. Scale bar, 100 µm; n = 3 mice for the DMSO group; n = 4 mice for the FC group. c, Changes in cholesterol metabolism-associated gene expression following cholesterol crystal (CC) injection, demonstrating molecular alterations in response to CC overload. n = 3 mice/group. Data are presented as mean ± SD. Statistical significance was assessed by a two-sided unpaired Student’s t-test (a, b). Source data
Extended Data Fig. 9
Extended Data Fig. 9. Reproductive strategies and verification of Cyp46a1 transgenic mice.
a, Breeding strategy for generating Cyp46a1 overexpression of transgenic mice, illustrating the genetic approach used for microglia-specific overexpression. b, Double immunostaining for IBA1 and CYP46A1 confirms elevated Cyp46a1 expression in microglia of Cyp46a1-cKI mice compared to controls. Scale bar, 20 µm. Cyp46a1 cKI, n = 42 cells from three mice; control, n = 35 cells from three mice. c-e, Immunofluorescence analysis demonstrating microglia-specific expression of Cyp46a1 in cKI mice, as shown by co-localization of IBA1⁺ (microglia marker) and tdTomato⁺ signals. Main image: scale bar, 500 µm; higher-magnification panel: scale bar, 50 µm (c). Scale bar, 20 µm(d); n = 3 mice/group. f, Bulk RNA-seq of CD11b⁺ cells sorted from control and Cyp46a1-cKI mice after MCAO reveals transcriptomic alterations associated with Cyp46a1 overexpression. Cyp46a1-cKI, n = 3 mice; control, n = 4 mice. Data are presented as mean ± SD. Statistical significance was assessed by a two-sided unpaired Student’s t-test (b, e, f). Source data

References

    1. Hacke, W. et al. Thrombolysis with alteplase 3 to 4.5 h after acute ischemic stroke. N. Engl. J. Med.359, 1317–1329 (2008). - PubMed
    1. Hu, X. et al. Microglial and macrophage polarization—new prospects for brain repair. Nat. Rev. Neurol.11, 56–64 (2015). - PMC - PubMed
    1. Pappata, S. et al. Thalamic microglial activation in ischemic stroke detected in vivo by PET and [11C]PK1195. Neurology55, 1052–1054 (2000). - PubMed
    1. Gerhard, A., Schwarz, J., Myers, R., Wise, R. & Banati, R. B. Evolution of microglial activation in patients after ischemic stroke: a [11C](R)-PK11195 PET study. Neuroimage24, 591–595 (2005). - PubMed
    1. Shi, K. et al. Global brain inflammation in stroke. Lancet Neurol.18, 1058–1066 (2019). - PubMed

LinkOut - more resources