. 2025 Sep;21(9):e70730.
doi: 10.1002/alz.70730.

PINK1 deficiency permits the development of Lewy body dementia with coexisting Aβ pathology

Affiliations

PINK1 deficiency permits the development of Lewy body dementia with coexisting Aβ pathology

Tong-Yao Gao et al. Alzheimers Dement. 2025 Sep.

Abstract

Introduction: Dementia with Lewy bodies (DLB), a prevalent neurodegenerative dementia, involves α-synuclein (α-syn) aggregates and frequent amyloid beta (Aβ) co-pathology, but mechanistic drivers remain unclear.

Methods: We crossed pink1 knockout with APP/PS1 mice, and assessed behavioral and pathological phenotypes of the resulting animals. We also performed biochemical and biophysical characterizations of PTEN-induced kinase 1 (PINK1) phosphorylation of α-syn.

Results: DLB brains show PINK1 deficiency alongside α-syn and Aβ co-pathology. Mirroring human DLB patients, APP/PS1::pink1-/- mice spontaneously develop Lewy pathology at endogenous α-syn levels, affecting both central and peripheral nervous systems with heterogeneous phenotypes. Mechanistically, PINK1 phosphorylates α-syn at Thr44, suppressing Aβ-induced α-syn aggregation. Moreover, pT44-α-syn levels are correlated with PINK1 expression and activity in human brains.

Discussion: PINK1 deficiency synergizes with Aβ to promote Lewy pathology via loss of protective α-syn phosphorylation. The APP/PS1::pink1-/- model recapitulates key DLB features without α-syn overexpression, offering a valuable tool for future mechanistic and therapeutic studies.

Highlights: PTEN-induced kinase 1 (PINK1) deficiency, either through reduced expression or impaired activity, is found in human dementia with Lewy bodies (DLB) patients with amyloid beta (Aβ) co-pathology. PINK1 specifically phosphorylates α-synuclein at Thr44, inhibiting Aβ-induced aggregation and preventing the development of Lewy pathology. The APP/PS1::pink1-/- mouse model recapitulates key features of human DLB, exhibiting widespread Lewy pathology and heterogeneous phenotypes. PINK1 alterations emerge as a novel genetic risk factor for DLB, opening new avenues for diagnosis and therapeutic intervention.

Keywords: APP/PS1 mouse; Alzheimer's disease; Lewy body; Lewy neurite; PTEN‐induced kinase 1; Parkinson's disease; amyloid beta; dementia with Lewy bodies; phosphorylation; α‐synuclein.


Conflict of interest statement

The authors declare no conflicts of interest. Author disclosures are available in the supporting information.

Figures

FIGURE 1
FIGURE 1
Co‐occurrence of α‐syn and Aβ pathologies were found in the brains of human DLB patients. A, Representative double immunofluorescence staining images from cingulate gyrus. B, Representative images from parietal cortex. The patients include (i) donor A and B with AD, (ii) donor C and D with AD/DLB, and (iii) donor E, G, and F with DLB at various stages. The detailed information of all donors is provided in Table S1 in supporting information. Lewy neurites are indicated with asterisks, and Lewy bodies are indicated with arrows. α‐syn, α‐synuclein; Aβ, amyloid beta; AD, Alzheimer's disease; DAPI, 4′,6‐diamidino‐2‐phenylindole; DLB, dementia with Lewy bodies.
FIGURE 2
FIGURE 2
Correlation between PINK1 deficiency with DLB pathogenesis. A, Double immunofluorescence staining of PINK1 and Aβ in human brain samples from cingulate gyrus. B, Double immunofluorescence staining of pUb and Aβ in human brain samples from cingulate gyrus. C and D, Analysis of published bulk transcriptomics data for the parietal brain region (cortex BA9), with the differentially expressed genes (DEGs) defined as |logFC| ≥ 1. PINK1 expression was quantitated in control (CTRL) and DLB brains. The DLB samples were stratified into low (pink1 L) and high (pink1 H) expression groups relative to the control (C), and the Venn diagram shows the number of DEGs between CTRL, pink1 L, and pink1 H groups (D). E and F, Analysis of published single‐nucleus transcriptomic data for the anterior cingulate gyrus. DEGs were defined as |logFC| ≥ 1. The percentage of PINK1‐positive neurons (pink1+) and average PINK1 mRNA expression in neuronal nuclei from control (CTRL) and DLB brains (E), and the Venn diagram illustrating DEGs between the pairwise comparisons of neuronal nuclei from CTRL::pink1‐, CTRL::pink1+, DLB::pink1‐, and DLB::pink1+ groups (F). Aβ, amyloid beta; DAPI, 4′,6‐diamidino‐2‐phenylindole; DLB, dementia with Lewy bodies; PINK1, PTEN‐induced kinase 1; pUb, phospho‐ubiquitin.
FIGURE 3
FIGURE 3
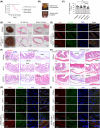
APP/PS1::pink1‐/‐ mice exhibit DLB‐like behavioral and pathological characteristics. A, Pole climbing test demonstrating locomotor dysfunction in 3–4‐month‐old mice. = 10, mean ± SD, *< 0.05, one‐way ANOVA. B, Rotarod performance (latency to fall) indicating locomotor dysfunction in 3‐ to 4‐month‐old mice. = 10, mean ± SD, one‐way ANOVA. C, Mouse #804 exhibited atonia at 1 month old. Freezing percentage in contextual (D) and cue‐dependent (E) memory tasks in the fear conditioning test in 3‐ to 4‐month‐old mice. = 10, mean ± SD, ***< 0.001 compared to training (D) or without tone (E), paired t test. ## < 0.01, ### < 0.001 compared to wild type (one‐way ANOVA). Percentage of time spent (F) and entries (G) into arms in the Y‐maze during training and testing in 3‐ to 4‐month‐old mice. = 10, mean ± SD, **< 0.01, *** < 0.001 among groups (one‐way ANOVA). H, Representative images of α‐syn and Aβ double immunofluorescence staining showing Lewy neurites (LNs) surrounding Aβ plaques. The images from APP/PS1 mice aged 5.5 and 12 months are shown in rows 3 and 4. I, Quantitative analysis of LNs with Aβ, LNs without Aβ, and Aβ without LNs for 6 APP/PS1::pink1‐/‐ mice. The total number of LNs with Aβ, LNs without Aβ, and Aβ without LNs (in parentheses) and the percentage of LNs with Aβ of each mouse were presented above each bar. J, Mapping of the distribution of LNs in brain regions using the mouse brain atlas. K, Representative images of α‐syn and Aβ double immunofluorescence staining in APP/PS1::pink1+/‐ mice at 6, 9, and 12 months old. L, Statistical analysis of the co‐localization of α‐syn puncta and Aβ plaques for the APP/PS1::pink1‐/‐ at 5 to 6 months old and the APP/PS1::pink1+/‐ mice at 6, 9, and 12 months old. N = 6 for APP/PS1::pink1‐/‐ mice and 3 for APP/PS1::pink1+/‐ mice at each age. Mean ± SD, *< 0.05, ***< 0.001, compared to APP/PS1::pink1+/‐ mice at 6‐month‐old, ## < 0.01, compared to APP/PS1::pink1‐/‐ mice, one‐way ANOVA. Detailed mouse information is available via mouse identification numbers in Table S3 in supporting information. α‐syn, α‐synuclein; Aβ, amyloid beta; ANOVA, analysis of variance; DAPI, 4′,6‐diamidino‐2‐phenylindole; DLB, dementia with Lewy bodies; LN, Lewy neurite; SD, standard deviation.
FIGURE 4
FIGURE 4
The characteristic of Lewy pathology in APP/PS1::pink1‐/‐ mouse brains. A, Double immunofluorescence staining for aggregated α‐syn and neuronal marker NeuN. B, Immunohistochemical staining of α‐syn with and without proteinase K treatment, revealing the aggregated form of α‐syn. C, TEM image of a LN with abundant lysosomes and mitochondria; the right panel shows a higher magnification of the boxed region. D, TEM image of a LN with an enlarged terminal connected to a neurite; magnified images for the boxed regions show the enlarged terminal with abnormal organelles and vesicles (left) and the neurite with abnormal mitochondria, distorted neurofilaments, and proteinaceous materials (right). E, TEM image of a LB with abnormal mitochondria, lysosomes, membrane structures, and tubulovesicular structures, with the right panel showing a higher magnification of the boxed region. F, The legend for the symbols in TEM images in (C)–(E). Brain samples for TEM were taken from the parietal cortex of two APP/PS1::pink1‐/‐ mice (mouse #K556 and #K928), with the presence of LNs and LBs confirmed by immunofluorescence staining against α‐syn and Aβ antibodies (Figure S7 in supporting information). Statistical analysis of mitochondrial length (G) and area (H) outside or inside LNs. = 50 mitochondria from two APP/PS1::pink1‐/‐ mice. **< 0.01, t test. I–N, Double (or triple) immunofluorescence staining for Ser129 phosphorylated α‐syn (pS129‐α‐Syn) and Aβ (I), α‐syn, Aβ, and neurofilament light chain, (J), α‐Syn and βIII‐tubulin (K), α‐syn and MAP2 (L), α‐syn and tau (M), and α‐syn and phosphorylated tau (p‐tau, N). Detailed mouse information is available via mouse identification numbers in Table S3 in supporting information. α‐syn, α‐synuclein; Aβ, amyloid beta; DAPI, 4′,6‐diamidino‐2‐phenylindole; LB, Lewy body; LN, Lewy neurite; TEM, transmission electronic microscopy.
FIGURE 5
FIGURE 5
Impaired peripheral nervous system in APP/PS1::pink1‐/‐ mice. A, High death rate of APP/PS1::pink1‐/‐ mice were observed within 150 days, while all other genotypes had survived. B, Images demonstrating urine retention and severe rectal prolapse in APP/PS1::pink1‐/‐ mice. C, Percentage of fecal water content in 5‐month‐old mice, = 11–15, mean ± SD, *< 0.05, **< 0.01 (one‐way analysis of variance). D, Hematoxylin and eosin (H&E) and Masson's trichrome staining of a heart with dilated cardiomyopathy (mouse #K412), with a wild‐type heart as control. E, Double immunofluorescence staining for α‐syn and β3‐tubulin (neurofilament marker), revealing Lewy pathology in the heart. F, H&E staining of ileum from wildtype, pink1‐/‐, APP/PS1, and APP/PS1::pink1‐/‐ mice. G, Double immunofluorescence staining for α‐syn and β3‐tubulin demonstrating Lewy pathology in the ileum. H, H&E staining of colon from wildtype, pink1‐/‐, APP/PS1, and APP/PS1::pink1‐/‐ mice. I, Double immunofluorescence staining for α‐syn and β3‐tubulin revealing Lewy pathology in the colon. Detailed mouse information is available via mouse identification numbers in Table S3 in supporting information. α‐syn, α‐synuclein; DAPI, 4′,6‐diamidino‐2‐phenylindole; SD, standard deviation.
FIGURE 6
FIGURE 6
PINK1 phosphorylates α‐syn and mitigates its aggregation. A, Electrospray ionization mass spectrometry (ESI‐MS) of α‐syn before and after PINK1 phosphorylation at various charge states. Deconvoluted mass spectra are displayed on the right. B, Thioflavin T (ThT) fluorescence‐based assessment of α‐syn and phosphorylated α‐syn (p‐α‐syn) aggregation kinetics, in the absence or presence of Aβ monomer, Aβ fibrils, and α‐syn fibrils. Mean ± SD, n = 3. *p < 0.05, ** p < 0.01, and ***p < 0.001 compared to time 0; # p < 0.05, ## p < 0.01, and ### p < 0.001 compared between α‐syn and p‐α‐syn, two‐way ANOVA followed by Tukey post hoc test. C, Dot blot analysis of α‐syn and p‐α‐syn aggregation after 4 days of shaking, using an antibody specific for α‐syn aggregates. mean ± SD, n = 6, *p < 0.05, **p < 0.01, and ***p < 0.001, unpaired t test. D, AlphaFold‐multimer model showing α‐syn docked into PINK1 substrate crevice, with α‐syn T44 positioned near PINK1 active‐site residue D362. Key residues for ATP interaction (PINK1 K219), known disease related mutation (PINK1 M318), and cross‐linked residues (PINK1 K380 and α‐syn K12) are also shown. E, Western blot analysis of co‐immunoprecipitation by anti‐PINK1 antibody, anti‐α‐syn antibody, or anti‐IgG antibody (as a negative control) in APP/PS1 mouse brain sample. F, Western blot analysis of pT44‐α‐syn in the cortex of mouse brains. Mean ± SD, n = 5, *< 0.05, **< 0.01, and one‐way ANOVA. G, Immunofluorescence analysis for T44‐phosphorylated α‐syn and Aβ in mouse brains, with representative images and the statistical analysis of the intensities of T44‐phosphorylated α‐syn. mean ± SD, n = 28 from 3 mice, ***< 0.001, one‐way ANOVA. H, Double immunofluorescence staining for T44‐phosphorylated α‐syn and Aβ in human brain cingulate gyrus samples. I, Correlations between the percentage of PINK1‐positive (PINK1+) neurons, pUb intensity, and pT44‐α‐Syn intensity for immunofluorescent stained human brain samples. Representative images of PINK1 and pUb staining are shown in Figure 2. The R 2 and p value are given in each panel. α‐syn, α‐synuclein; Aβ, amyloid beta; ANOVA, analysis of variance; IgG, immunoglobulin G; PINK1, PTEN‐induced kinase 1; pUb, phospho‐ubiquitin; SD, standard deviation.

References

    1. Hogan DB, Fiest KM, Roberts JI, et al. The prevalence and incidence of dementia with Lewy bodies: a systematic review. Can J Neurol Sci. 2016;43(1):S83‐S95. - PubMed
    1. Kane JPM, Surendranathan A, Bentley A, et al. Clinical prevalence of Lewy body dementia. Alzheimers Res Ther. 2018;10:19. - PMC - PubMed
    1. McKeith IG, Boeve BF, Dickson DW, et al. Diagnosis and management of dementia with Lewy bodies: fourth consensus report of the DLB consortium. Neurology. 2017;89:88‐100. - PMC - PubMed
    1. Yamada M, Komatsu J, Nakamura K, et al. Diagnostic criteria for dementia with Lewy bodies: updates and future directions. J Mov Disord. 2020;13:1‐10. - PMC - PubMed
    1. Gunawardana CW, Matar E, Lewis SJG. The clinical phenotype of psychiatric‐onset prodromal dementia with Lewy bodies: a scoping review. J Neurol. 2024;271:606‐617. - PMC - PubMed