. 2025 Sep;27(9):e70174.
doi: 10.1111/1462-2920.70174.

Phylogenomics Untangles the Metabolic Potential of Picochlorum tauri, a New Picoalgal Species Causing a Winter Bloom in the Mediterranean Thau Lagoon

Affiliations

Phylogenomics Untangles the Metabolic Potential of Picochlorum tauri, a New Picoalgal Species Causing a Winter Bloom in the Mediterranean Thau Lagoon

Béatrice Bec et al. Environ Microbiol. 2025 Sep.

Abstract

In the winter of 2018-2019, the Mediterranean Thau lagoon experienced an intense green bloom with severe ecological consequences. Here, we aimed at identifying the blooming species and deciphering its metabolic potential. The blooming alga was identified by a metabarcoding approach and later isolated in an axenic form. High-quality nuclear and organellar genome sequences were generated. Phylogenetic and phylogenomic analyses revealed that the alga is a new member of the genus Picochlorum (Trebouxiophyceae, Chlorophyta) that we named Picochlorum tauri. Comparative genomic analyses were conducted to provide insights into (i) genome reduction in the Picochlorum genus with respect to other trebouxiophycean genera and (ii) the metabolic specificities of P. tauri with respect to other eukaryotic picophytoplankton. Genome mining unveiled in P. tauri an extended gene repertoire for carbon concentrating mechanisms, a reduced number of routes for acetyl-CoA synthesis from pyruvate and citrate, and a vitamin B12-dependent carboxylation pathway for propionyl-CoA breakdown. By contrast to the surveyed photosynthetic picoeukaryotes, P. tauri has specific functional traits linked to carbon metabolism, vitamin and chlorophyll synthesis, which are expected to boost physiology. These traits might have contributed to the fast development and maintenance of P. tauri in cool waters under low solar radiance.

Keywords: carbon metabolism; marine algae; metabolic plasticity; photosynthetic picoeukaryote; propionyl‐CoA; trebouxiophyceans; vitamin.


Conflict of interest statement

The authors declare no conflicts of interest.

Figures
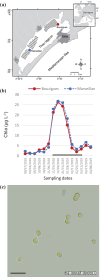
FIGURE 1
FIGURE 1
A prolonged winter bloom in the Mediterranean Thau lagoon. (a) Geographical location and sampling sites. (b) Temporal variations of Chla from August 2018 to April 2019 in samples collected in the two relevant sites. Environmental data obtained throughout the autumn and the winter (grey bar) are presented in Figure S1 and Table S1. (c) Representative light micrograph of water samples collected on 10 January 2019. Scale bar: 10 μm.
FIGURE 2
FIGURE 2
Dot plots of flow cytometry analysis of phytoplankton from water sample collected on 7 January 2019 in the Thau lagoon (site of Bouzigues). Representative plots show (a) Forward scatter vs. red fluorescence and (b) Forward scatter vs orange fluorescence. These dot plots allow discrimination of picocyanobacteria (PE‐CYAN) and autotrophic picoeukaryotes (PEUK1 < 1 μm, PEUK2: 2–3 μm).
FIGURE 3
FIGURE 3
Taxonomic diversity and distribution of eukaryotic microbial communities in the water column at the surface of the Bouzigues site from December 2018 to February 2019. (a) The six most abundant Divisions were represented and classified by Supergroup. The five most abundant genera within a Division were ordered from the most to the least abundant. (b) The 10 most abundant genera within the Chlorophyta division were ordered from the most to the least abundant. Sequences from microbial Eukaryota that were not identified as Chlorophyta_X were summed and represented as ‘Other Eukaryota’. In both panels, less abundant genera were summed and represented as ‘Least abundant taxa’. Taxonomic groups with a name ending with at least a* were not taxonomically identified to the represented taxonomic level using the PR2 database. Taxonomic groups with a name ending with at least a _X were created by PR2 taxonomic experts to homogenise the taxonomic classification.
FIGURE 4
FIGURE 4
Molecular phylogeny based on 18S rDNA sequence comparison. The phylogeny was inferred using the Maximum Likelihood method and the General Time Reversible model of nucleotide substitutions. The evolutionary rate differences among sites were modelled using a discrete Gamma distribution across five categories (+G, parameter = 0.4062), with 25.63% of sites deemed evolutionarily invariant (+I). Branch lengths represent substitutions per site. The percentage of replicate trees in which the associated taxa clustered together (100 replicates) is shown next to the branches. The analytical procedure encompassed 26 nucleotide sequences with 5666 positions in the final dataset. Mediterranean species are underlined. The Picochlorum clade is highlighted in blue.
FIGURE 5
FIGURE 5
Transmission electron micrographs of Picochlorum tauri. Cells have a round or ovoid shape. The nucleus is in the centre of the cell, covered by the chloroplast. The mitochondria often appear with an electron‐dense matrix. Starch grains are numerous and appear with no obvious pyrenoid. The thylakoid membranes appear as dark lines, as in panel (c). Ct, chloroplast; g, golgi; mt, mitochondria; N, nucleus; S, starch grain; T, thylakoids. Panel (d) shows the arrow pointing at the V‐shape invagination of the cell wall in a dividing cell. Scale bars: (a, d, e) 0.5 μm; (b, c) 0.1 μm.
FIGURE 6
FIGURE 6
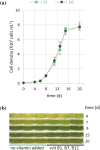
Effect of exogenous vitamins on Picochlorum tauri growth. Algae were cultivated with (+) or without (−) added vitamins B1, B7 and B12, at 22°C under a 14 h:10 h light:dark cycle (light intensity of 100 μmol photons m−2 s−1). (a) Growth curves. Error bars indicate SDs based on three independent biological replicates per condition. (b) Overview of the cultures over 20 days.
FIGURE 7
FIGURE 7
Phylogenomic tree including 43 Chlorophyta algal genomes. OrthoFinder was run on protein sequences with the following settings: MSA for the gene tree inference, diamond_ultra_sens for the sequence search and raxml‐ng as a tree inference program. A species tree was inferred from the set of unrooted orthogroup gene trees using the STAG method as implemented in OrthoFinder. STAG support values are indicated at the nodes. The Picochlorum clade is highlighted in blue. Respective genome (assemblies) and protein repertoire sizes are indicated. Protein counts refer to the entire set of protein‐coding genes available from each genome database (Table S2). Highlighted in yellow are the smallest genome sequences (< 14 Mbp); in orange are the smallest predicted proteomes (< 7000 protein counts).
FIGURE 8
FIGURE 8
Protein‐coding gene content for carbon metabolism across the Trebouxiophyceae diversity. The number of gene copies is colour‐coded, ranging from white (absence of gene) to navy blue (six copies). Picochlorum spp. are highlighted in green. Accession numbers to predicted proteins are found in Table S12.
FIGURE 9
FIGURE 9
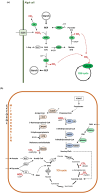
Metabolic pathway reconstruction. (a) Carbon concentrating mechanisms in Picochlorum tauri as inferred from its genome sequence. Carbonic anhydrases (CA) catalyse the reversible hydration of carbon dioxide (CO2). The carboxylation of phosphoenolpyruvate (PEP) stemming from glycolysis generates oxaloacetate (OAA), which can then be converted to malate or l‐aspartate. CO2 produced in the decarboxylation reactions (ME and PCK) is subsequently fixed by RubisCO. Enzymes involved in CCMs are indicated in light green‐filled ellipses. In higher plants, the enzymes associated with the biochemical CCMs are localised to specific cell compartments and are associated with metabolisms referred to as CAM photosynthesis and C4 photosynthesis (Yamori et al. 2014). In the picoalgae, the enzyme's exact localisation is not known. The multi‐label predictor DeepLoc (version 2.1) predicted a chloroplast localisation for PPDK, a mitochondrial localisation for the two MEs, and a cytoplasm localisation for PEPC and PCK. l‐Asp, l‐aspartate. See Figure 8 for the enzyme full names. (b) Overlap of the TCA cycle and the propionate breakdown pathways in P. tauri, as inferred from its genome sequence. Propionyl‐CoA is produced during the catabolism of Valine, Odd chain fatty acids, Methionine, Isoleucine and Threonine (VOMIT). The carboxylation pathway for propionate breakdown comprises three enzymes, depicted here in blue‐coloured ellipses. The carboxylation pathway generates succinyl‐CoA, a TCA cycle intermediate; bypassing the steps of the TCA cycle that produce CO2 and NADH, this pathway favours C‐conservation over energy conservation. The β oxidation‐like pathway for propionate breakdown leads to acetyl‐CoA (enzymes depicted in light orange), which favours energy production over C‐conservation. ACADS, short‐chain specific acyl‐CoA dehydrogenase (EC 1.3.8.1); ECH, enoyl‐CoA hydratase (EC 4.2.1.17); HADH, 3‐hydroxyisobutyryl‐CoA hydrolase (EC 3.1.2.4); HPD, 3‐hydroxypropionate dehydrogenase (EC 1.1.1.31); MCEE, methylmalonyl‐CoA epimerase; MMSA, malonate‐semialdehyde dehydrogenase (acetylating) (EC 1.2.1.18); MUT, methylmalonyl‐CoA mutase; PC, pyruvate carboxylase; PCC, propionyl‐CoA carboxylase; PDH, pyruvate dehydrogenase. Proteins required for the conversion of Cbl into AdoCbl are depicted in light green ellipses: MMAA, methylmalonic aciduria type A protein; MMAB, ATP:Cob(I)alamin adenosyltransferase. Enzyme cofactors derived from vitamins are depicted in grey. Full names and EC numbers of all other enzymes are given in Figures 8 and 10, and in Table S12.
FIGURE 10
FIGURE 10
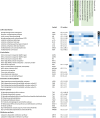
Protein‐coding gene content across picophytoeukaryotes. Gene copy number is colour‐coded, ranging from white (absence of gene) to navy blue (six copies). Mamiellophyceae are shown in light green. Picochlorum spp. are highlighted in green. Accession numbers to predicted proteins are found in Table S12.

References

    1. Almagro Armenteros, J. J. , Sønderby C. K., Sønderby S. K., Nielsen H., and Winther O.. 2017. “DeepLoc: Prediction of Protein Subcellular Localization Using Deep Learning.” Bioinformatics 33: 3387–3395. - PubMed
    1. Aminot, A. , and Kérouel R.. 2004. “Caractéristiques Physicochimiques Majeures.” In Hydrobiologie Des écosystèmes Marins: Paramètres et Analyses, 37–41. Edition Ifremer.
    1. Anderson, D. M. 1997. “Turning Back the Harmful Red Tide.” Nature 388: 513–514.
    1. Andrews, S. 2010. “FastQC: A Quality Control Tool for High Throughput Sequence Data.”
    1. Armstrong, G. A. 1998. “Greening in the Dark: Light‐Independent Chlorophyll Biosynthesis From Anoxygenic Photosynthetic Bacteria to Gymnosperms.” Journal of Photochemistry and Photobiology B: Biology 43: 87–100.

LinkOut - more resources