. 2025 Dec 1;222(12):e20250460.
doi: 10.1084/jem.20250460. Epub 2025 Sep 24.

Human CD4+ T cells recognize Mycobacterium tuberculosis-infected macrophages amid broader responses

Affiliations

Human CD4+ T cells recognize Mycobacterium tuberculosis-infected macrophages amid broader responses

Volodymyr Stetsenko et al. J Exp Med. .

Abstract

CD4+ T cell-mediated control of tuberculosis (TB) requires recognition of macrophages infected with Mycobacterium tuberculosis (Mtb). Yet, not all Mtb-specific T cells recognize infected macrophages. Using infected monocyte-derived macrophages and autologous memory CD4+ T cells from individuals with stable latent Mtb infection (LTBI), we quantify the frequency of activated T cells. T cell antigen receptor (TCR) sequencing revealed >70% of unique and >90% of total Mtb-specific TCR clonotypes in LTBI are linked to recognition of infected macrophages, while a subset required exogenous antigen exposure, suggesting incomplete recognition. Clonotypes specific for multiple Mtb antigens, and other pathogens, were identified. Remarkably, antigen screening revealed all TCRs to be specific for type VII secretion system (T7SS) substrates. Mtb-specific clonotypes expressed signature effector functions dominated by IFNγ, TNF, IL-2, and GM-CSF or chemokine production and signaling. We propose that TB vaccines, which elicit T cells specific for T7SS substrates, recognize infected macrophages, and express canonical effector functions, will offer protection against TB.


Conflict of interest statement

Disclosures: S.M. Carpenter reported a patent to 63/758,582 pending. No other disclosures were reported.

Figures

None
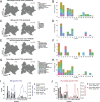
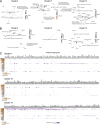
Graphical abstract
Figure 1.
Figure 1.
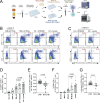
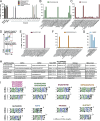
Subset of memory CD4 + T cells lack recognition for Mtb-infected macrophages. (A) Schematic of experimental workflow to coculture infected macrophages with autologous memory CD4+ T cells for flow cytometry or sorting. Created in BioRender. Carpenter, S. (2025) https://BioRender.com/v53j172. (B and C) Flow cytometry plots from a representative experiment comparing activation marker co-expression of CD69 with CD40L (top row) or IFNγ (bottom row), (B) gated on CD45RALo CD4+ T cells after 16–18 h coculture with Mtb-infected macrophages ± treatment with MTB300 or lysate, and (C) in the presence of α-MHC-II blocking antibodies. Data are representative of 10 (CD69 vs. CD40L) and 6 (CD69 vs. IFNγ) experiments and participants. (D and E) Summary bar graphs compare (D) median (and IQR) co-expression of CD69 and CD40L, and (E) the difference in activation when MTB300 is added to infected macrophages (10 LTBI and 7 non-LTBI participants). (F and G) Summary bar graphs compare (F) median (and IQR) CD69 and IFNγ co-expression, and (G) change in activation when MTB300 is added (6 LTBI and 6 non-LTBI participants). Each symbol represents the mean of one to three replicates from independent experiments. Statistical significance was determined by the Wilcoxon matched-pairs signed rank test.
Figure S1.
Figure S1.
CD69 and CD25 co-expression reveals a subset of memory CD4 + T cells that lack recognition of Mtb-infected macrophages. Related to Figs. 1 and 2. (A and B) (A) Flow cytometry plots comparing the co-expression of CD69 and CD25, gated on CD45RALo CD4+ T cells after 16–18 h coculture with Mtb-infected (MOI 4–5) macrophages either alone or with addition of exogenous antigens (MTB300 or lysate) and (B) with and without α-MHC-II blocking antibodies. Plots are concatenated from three replicates from one experiment; data are representative of 10 independent experiments each with two to three replicates per condition. (C and D) (C) Summary bar graphs compare mean (± SEM) co-expression of CD69 and CD25 (10 participants), and (D) the difference in activation when MTB300 is added to Mtb-infected macrophages for samples from 10 LTBI and 6 non-LTBI participants. (E) Representative flow plots showing the gating of memory CD4+ T cells activated in response to Mtb-infected macrophages (or controls). After gating on lymphocytes (SSC Area [SSC-A] vs. FSC Area [FSC-A]) and single cells (FSC Height (FSC-H] vs. FSC-A), live CD4+ 7-AADLo T cells were identified. Co-expression of CD69 and either CD25 or CD40L was used to identify activated T cells for sorting.
Figure 2.
Figure 2.
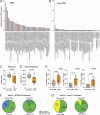
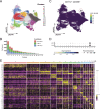
TCR sequencing identifies clonotypes linked to recognition of infected macrophages. (A and B) Bar graphs of the top 50 TCR clonotypes and their frequencies from representatives of (A) eight LTBI and (B) six non-LTBI participants. TCR clonotypes are displayed as CDR3α_CDR3β; some TCRs contained two CDR3α or CDR3β chains. Blue font highlights a CDR3β motif previously annotated as specific for EspA301-315. (C and D) Summary box plots of median (with IQR and range) (C) Shannon and (D) Inverse Simpson index scores for eight LTBI and six non-LTBI participants. Each symbol represents individual participant TCR repertoires. (E) Summary box plots of median (with IQR and range) percentage of TCR clonotypes present in ≥2, 3, or 4 copies with fold differences listed above each graph. Statistical significance was determined by unpaired Welch’s t test. (F and G) Pie charts showing percentage (and number) of unique (left) and total (right) TCRβ sequences linked to (F) responses to infected macrophages (green) or after adding MTB300 (blue), and (G) responses to infected macrophages (green) or after adding lysate (yellow), combined from seven to eight individuals.
Figure 3.
Figure 3.
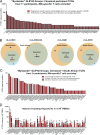
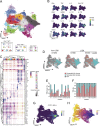
GLIPH2 refines estimates of Mtb-specific CD4 + T cell recognition of infected macrophages. (A) Venn diagram indicating the number of GLIPH2 groups containing TCRs linked to responses to infected macrophages (green, stars), MTB300 (added to infected macrophages or to PBMCs) (blue, squares), control peptide megapools added to PBMCs (red), or lysate (added to infected macrophages) (yellow, triangle). (B) Pie charts of percentage (and number) of remaining GLIPH2 groups that respond to infected macrophages (green; sum of star groups from A) or MTB300 only (blue; sum of square groups from A). (C) Pie charts of GLIPH2 groups (left) and corresponding unique TCRβs (right) after removing GLIPH2 groups containing TCRs linked to viral antigen responses. (D) Bar graph of GLIPH2 groups (x axis) estimated to be Mtb-specific, rank-ordered by the sum of the highest number of TCR copies per experimental condition (y axis). Responses to infected macrophages (green), MTB300 only (blue), or both (blue stripes) are indicated. “%” indicates any amino acid substitution. (E) Pie charts comparing responses to infected macrophages (green) or MTB300 peptides only (blue) for GLIPH2 groups (left) containing unique TCRβs (right) contributed by ≥2 participants. Data were generated from a combined list of expanded TCRs from all experimental conditions (10 experiments; 10 LTBI and 6 non-LTBI participants).
Figure S2.
Figure S2.
Distribution of GLIPH2 groups linked to viral or vaccine control responses. Related to Figs. 3 and 4. (A) Bar graph of GLIPH2 groups (x axis) from ≥1 Cleveland participant estimated to be viral or vaccine antigen–specific. (B) Venn diagrams of numbers of HLA-II alleles shared (or not) between Cleveland and South African participants and percentage of Cleveland HLA alleles expressed by South African participants. (C) Bar graph of GLIPH2 groups (x axis) from ≥3 participants from the combined list of Cleveland and South African TCRs estimated to be viral or vaccine antigen–specific, based on IEDB annotation (red), non-LTBI participants (gray), or control peptide stimulations (stripes), rank-ordered by the sum of the highest TCR copy number (y axis) per condition. (D) Bar graph of mean circulating frequency of Cleveland participants’ TCRβ clonotypes (symbols) as constituents of each GLIPH2 group from the combined list of TCRs after cross-referencing unstimulated PBMCs from Cleveland participants.
Figure 4.
Figure 4.
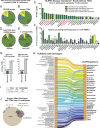
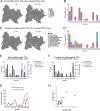
TCRs from additional LTBI cohorts enhance the ability of GLIPH2 to distinguish Mtb-specific clonotypes. (A and B) Pie charts comparing percentage (and number) of (A) GLIPH2 groups or (B) unique TCRβs linked to a response to Mtb-infected macrophages (green), MTB300 only (blue), or lysate only (yellow). (C) Bar graph of GLIPH2 groups estimated to be Mtb-specific (x axis) containing TCRs contributed by ≥3 participants, rank-ordered by the sum of the highest number of TCR copies recovered in an experiment (y axis). Responses to infected macrophages (green), MTB300 only (blue), both (blue stripes), or lysate only (yellow) are indicated. GLIPH2 groups containing TCRs previously annotated as Mtb antigen–specific in IEDB are in red font; % indicates any amino acid substitution. (D and E) Pie charts comparing (D) total or (E) percentage of total CD4+ T cell TCRβs sequenced from 10 × 106 unstimulated PBMCs after cross-referencing GLIPH2 groups from Cleveland participants’ responses to infected macrophages (± MTB300 or lysate) to determine natural circulating frequency. (F) Bar graph of the mean number of each TCRβ clonotypes (different symbols) sequenced from unstimulated PBMCs (for Cleveland participants only), corresponding to each GLIPH2 group. (G) Bar graphs of the number (and percentage) of unique TCRs within GLIPH2 groups estimated to be Mtb-specific or non–Mtb-specific bystander GLIPH2 groups that contain either 100% (left) or 97–99% (right) CDR3α homology with MAIT cells. (H) Comparison of TCRdist3 meta-clonotypes generated from all TCRs in respective GLIPH2 groups estimated to be Mtb-specific in C. Thickness of each line corresponds to the number of TCR sequences across all samples. For meta-clonotypes, “.” indicates any amino acid substitution (analogous to % in GLIPH2), “?” indicates an optional amino acid, and brackets indicate an either–or substitution. (I) Chi-square statistics comparing membership for all TCRs (All) or only the GLIPH2 groups in C (GLIPH2 [Mtb]). (J) Proportional Venn diagram showing the number of unique TCRs clustered by GLIPH2 or TCRdist3 within groups (or meta-clonotypes) with TCRs from ≥2 participants. The green circle represents TCRs in GLIPH2 groups estimated to be Mtb-specific from C. TCRs grouped by GLIPH2 and TCRdist3 were compared using a chi-square analysis and Cramer’s V post hoc test.
Figure 5.
Figure 5.
TCRs from GLIPH2 groups are specific for Mtb antigens. (A–C) (A) Bar graphs of CD69 expression by flow cytometry (gated on CD4+ TCRβ+ Live-DeadLo) for SKW-3 cells transduced with a TCR from indicated GLIPH2 groups 18 h after coculture with autologous B cells loaded with MTB300 megapool, 20-peptide subpools, or (B) with individual peptides, DMSO, or after treatment with αCD3/CD28 mAb-coated beads for R%SGGEAKNI and (C) RKQG%E TCR-transduced SKW-3 cells. (D) Representative flow plots of CD69 and TCRβ expression gated on total CD4+ SKW-3 cells after transduction with a TCR expressing the S%SGTKYNE motif in response to cognate peptide (top) or irrelevant peptide (bottom). (E–G) Bar graphs of CD69 expression (of CD4+ TCRβ+) for (E) the S%SGTKYNE TCR, (F) the SSPGQGG%NYG TCR, and (G) the %MPE TCR in response to individual peptides. (H) Single values for each condition are plotted, representing two to three independent experiments for (H) each cloned TCR and respective GLIPH2 group. Cognate peptides and GLIPH2-predicted HLA restrictions are listed. (I) Sequence logo plots show the probability of each amino acid for CDR3β (top) and CDR3α (bottom) motifs for each GLIPH2 group containing TCRs where Mtb antigen specificity was established. Created using WebLogo3. Numbers of CDR3 sequences used for each plot are indicated (top-right). * indicates two, and ** indicates three different CDR3α lengths and a lack of CDR3α consensus within the GLIPH2 group.
Figure 6.
Figure 6.
TCRs from Mtb-specific GLIPH2 groups vary in their capacity to recognize infected macrophages. (A–E) Bar graphs of mean (±SD) %CD69+ cells by flow cytometry (gated on CD4+ TCRβ+ Live-DeadLo) for SKW-3 cells transduced with representative TCRs from each of the indicated GLIPH2 groups 18 h after coculture with macrophages infected at MOI 1 or 4 (± α-HLA-DR/DP/DQ blockade), or left uninfected ± treatment with lysate or anti-CD3/CD28 bead stimulation. (F and G) Representative flow cytometry plots of CD69 and TCRβ expression of CD4+ SKW-3 cells transduced with the (F) R%SGGEAKNI or (G) RKQG%E TCRs in response to Mtb-infected or lysate-treated macrophages in separate experiments. (H and I) Bar graphs of mean (±SD) CD69 expression (of CD4+ TCRβ+) for the (H) RKQG%E and (I) SLRT%ET TCRs in response to infected macrophages. Data are representative of two to three independent experiments containing two to five replicates per condition. Statistical significance was determined using a Welch one-way ANOVA and Dunnett’s T3 post hoc test corrected for multiple comparisons; *P < 0.05, **P < 0.01, ***P < 0.001, n.s., not significant.
Figure S3.
Figure S3.
Cellularity and monocytic contamination as quality control metrics after integration. Related to Fig. 7. (A) UMAP plot showing unbiased clustering of the CD4+ populations of 6 non-LTBI (6 donors) and 12 LTBI samples (7 donors) after quality control and integration, and prior to monocytic contamination removal. (B) Bar plot depicting cell numbers in each cluster per experimental condition. (C) UMAP plot showing joint density estimation for plot for CD11c and CD206 transcripts in the integrated dataset. (D) Dot plot showing the average expression and percentage of cells expressing CD11c and CD206 transcripts in each cluster. (E) Heatmap showing top five DEGs in the integrated dataset for each cluster prior to removal of low-quality clusters, e.g., clusters 16, 17, and 18.
Figure 7.
Figure 7.
Single-cell transcriptomics reveals distinct phenotypes of memory CD4 + T cell responses to infected macrophages. (A) UMAP visualization plot including the Louvain clustering of 157,462 cells after integration and quality control from 7 LTBI participants (12 samples, AIM+ memory CD4+ T cells in response to infected macrophages ± lysate) and 6 non-LTBI participants (6 samples, AIM+ memory CD4+ T cells in response to infected macrophages). Top DEGs for each cluster are listed below plot, grouped by IFNγ and TNF expression. (B) Kernel density estimation of selected T helper subset genes projected onto the UMAP plot. Density values were reduced to max/min scale. (C) Heatmap with hierarchical clustering (left) showing top five DEGs for each cluster, conserved across treatment groups. (D) Split UMAP plots for experimental groups showing mapping of all TCRs. Expanded (≥2 copies) and nonexpanded (single) TCR clonotypes are shown in red and blue, respectively. (E and F) Representative stacked bar plots showing (E) percent clonally expanded versus nonexpanded TCRs of total TCRs sequenced from LTBI participant samples, and (F) ratio of expanded and nonexpanded TCRs normalized to each cluster’s total cell number. (G and H) Joint density estimation plot for (G) CCR7 and SELL transcripts and (H) pseudotime trajectory (rooted in cells with the highest expression of CCR7 and SELL), projected onto the UMAP plot. Cell fates (gray circles), transition states (black circles), and proximity to (purple) and remoteness from (yellow) the root are indicated.
Figure S4.
Figure S4.
TCRs with inconsistent CDR3α chains map to clusters with nonspecific CD4 + T cell responses. Related to Fig. 8. (A and B) (A) UMAP plot with split view (based on the participant’s LTBI status) with mapping of estimated Mtb-specific TCRs from listed GLIPH2 groups containing inconsistent CDR3α homology in response to Mtb-infected macrophages, and (B) stacked bar plots showing their numbers per cluster. (C and D) (C) UMAP plots with mapping of TCRs annotated as viral antigen–specific but with inconsistent CDR3α homology from listed GLIPH2 groups and (D) stacked bar plots showing their numbers per cluster. (E and F) (E) Total copy numbers (left axis) and percentage (right axis) ([clone count/total cells per cluster] × 100) of cells per cluster mapping TCRs linked to a response to infected macrophages from listed GLIPH2 groups containing inconsistent CDR3α homology from known or estimated Mtb-specific GLIPH2 groups, and (F) for annotated viral antigen–specific TCRs. (G and H) (G) Overlaid line graph and (H) correlation plot of percent T cells per cluster that mapped TCRs from all 37 GLIPH2 groups estimated to be Mtb-specific (blue) and viral antigen–specific (red).
Figure 8.
Figure 8.
CDR3 mapping distinguishes the effector functions of Mtb-specific TCR clonotypes. (A and B) (A) UMAP plot with split view (based on cells from LTBI vs. non-LTBI participants) with mapping of TCRs from listed GLIPH2 groups (motifs) established as Mtb antigen–specific, and (B) stacked bar plot showing numbers of αβTCRs from each GLIPH2 group (color) per cluster. (C and D) (C) UMAP plots mapping αβTCRs from GLIPH2 groups estimated to be Mtb-specific, and (D) stacked bar plots showing numbers of TCRs per cluster. (E and F) (E) UMAP plots mapping TCRs from listed GLIPH2 groups responsive to MTB300 and/or lysate stimulation, but not infected macrophages, and (F) stacked bar plots showing numbers of TCRs per cluster. (G and H) (G) UMAP plots mapping annotated viral antigen–specific TCRs (in IEDB) from listed GLIPH2 groups, and (H) stacked bar plots showing numbers of TCRs per cluster. (I and J) (I) Total copy numbers (left axis) and percentage (right axis) of cells per cluster mapping TCRs ([clone count/total cells per cluster] × 100) from established or estimated Mtb-specific GLIPH2 groups that recognized infected macrophages and (J) for annotated viral antigen–specific TCRs.
Figure 9.
Figure 9.
Mtb-specific CD4 + T cells express signature effector genes in response to infected macrophages. (A and B) (A) Overlaid line graph and (B) correlation plot of percent T cells per cluster that mapped Mtb-specific (blue) and viral pathogen-specific (red) TCRs. Linear regression (black dashed line) and Pearson’s correlation coefficient squared (r2) are shown. Red and blue dashed circles identify UMAP clusters with highest enrichment of Mtb-specific and viral pathogen-specific TCRs, respectively. (C) Heatmap showing top 10 DEGs normalized to the individual maximum expression for listed clusters. Gene expression patterns common to cluster enriched for Mtb-specific TCRs are outlined. (D) Dot plot showing Reactome pathway overrepresentation analysis using the lists of genes with Log2FC > 1 for UMAP clusters 4, 6, and 11–15. The list of top seven most significant pathways is arranged based on the GeneRatio (number of input genes associated with a Reactome term/total number of input genes). (E) Summary of receptor–ligand pairs identified by NicheNet analysis, estimating the cell–cell communication (prior interaction potential) between “sender” clusters 4, 11, 13, or 15 (combined) and “receiver” cluster 6 (left), cluster 12 (middle), and cluster 14 (right).
Figure S5.
Figure S5.
Mtb-specific TCR clonotypes communicate with other memory T cells to control infection. Related to Fig. 9. (A and B) Network plots illustrating Reactome pathways with top DEGs labeled (A) for clusters 4, 11, 13, and 15, and (B) for clusters 6, 12, 14. (C) Heatmaps showing downstream signaling genes estimated to be linked to cell–cell communication between ligands expressed by clusters 4, 11, 13, or 15 (combined) and T cells in clusters 6 (top), 12 (middle), and 14 (bottom). The AUPRC was used to rank the ligand activity of senders on responders (left). AUPRC, area under the precision–recall curve.

Update of

References

    1. van Aalst, S., Ludwig I.S., van der Zee R., van Eden W., and Broere F.. 2017. Bystander activation of irrelevant CD4+ T cells following antigen-specific vaccination occurs in the presence and absence of adjuvant. PLoS One. 12:e0177365. 10.1371/journal.pone.0177365 - DOI - PMC - PubMed
    1. Allan, E.R.O., Tailor P., Balce D.R., Pirzadeh P., McKenna N.T., Renaux B., Warren A.L., Jirik F.R., and Yates R.M.. 2014. NADPH oxidase modifies patterns of MHC class II–restricted epitopic repertoires through redox control of antigen processing. J. Immunol. 192:4989–5001. 10.4049/jimmunol.1302896 - DOI - PubMed
    1. Alquicira-Hernandez, J., and Powell J.E.. 2021. Nebulosa recovers single-cell gene expression signals by kernel density estimation. Bioinformatics. 37:2485–2487. 10.1093/bioinformatics/btab003 - DOI - PubMed
    1. Andrews, J.R., Noubary F., Walensky R.P., Cerda R., Losina E., and Horsburgh C.R.. 2012. Risk of progression to active tuberculosis following reinfection with mycobacterium tuberculosis. Clin. Infect. Dis. 54:784–791. 10.1093/cid/cir951 - DOI - PMC - PubMed
    1. Arstila, T.P., Casrouge A., Baron V., Even J., Kanellopoulos J., and Kourilsky P.. 1999. A direct estimate of the human alphabeta T cell receptor diversity. Science. 286:958–961. 10.1126/science.286.5441.958 - DOI - PubMed

MeSH terms

LinkOut - more resources