. 2025 Sep 26;11(39):eadw1270.
doi: 10.1126/sciadv.adw1270. Epub 2025 Sep 24.

Gut epithelium modifies enteric behaviors during nutritional adversity via distinct peptidergic signaling axes

Affiliations

Gut epithelium modifies enteric behaviors during nutritional adversity via distinct peptidergic signaling axes

Surojit Sural et al. Sci Adv. .

Abstract

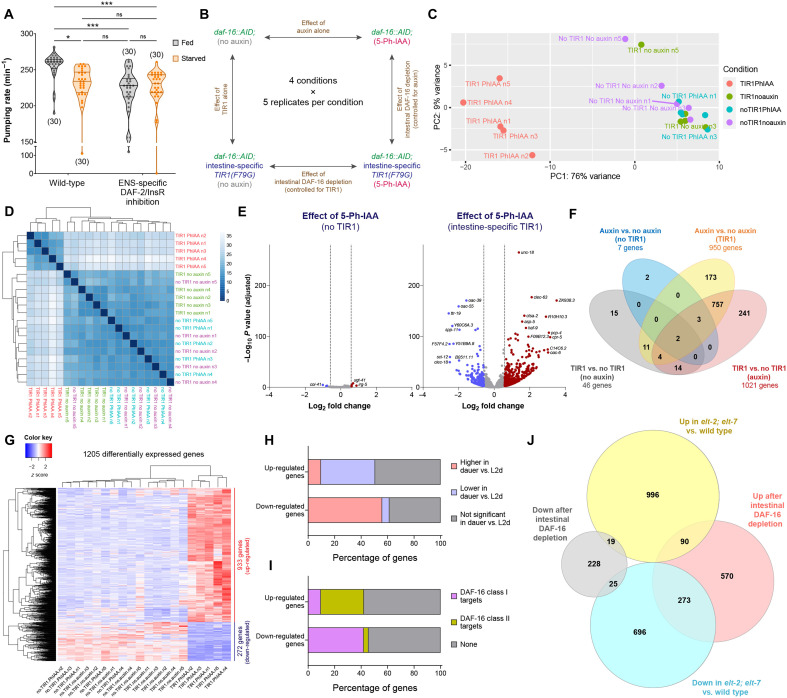
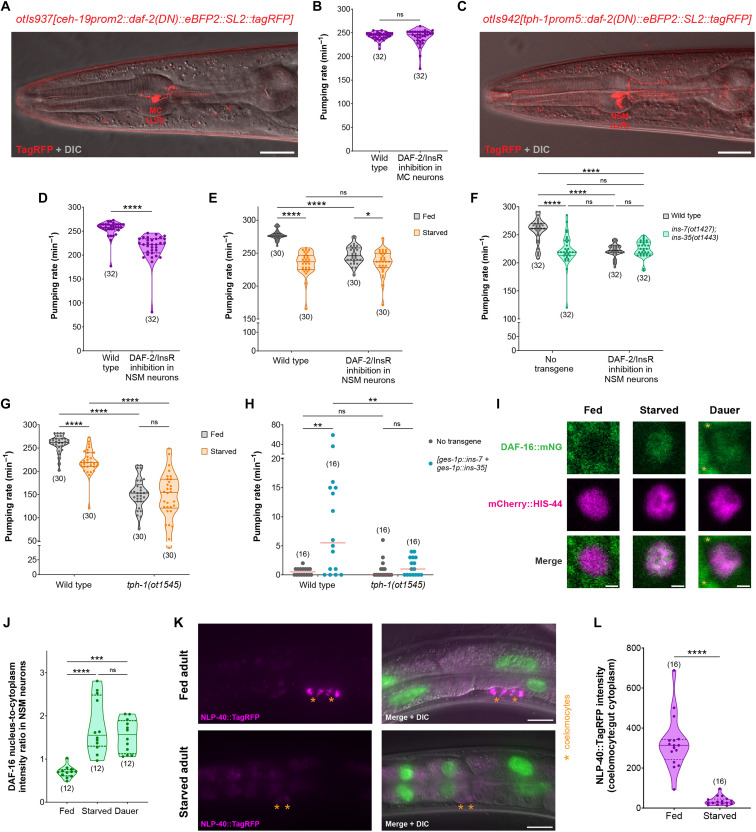
Interorgan signaling events are emerging as key regulators of behavioral plasticity. The foregut and hindgut circuits of the C. elegans enteric nervous system (ENS) control feeding and defecation behavior, respectively. Here, we show that epithelial cells in the midgut integrate feeding state information to control these behavioral outputs by releasing distinct neuropeptidergic signals. In favorable conditions, insulin and noninsulin peptides released from midgut epithelia activate foregut and hindgut enteric neurons, respectively, to sustain normal feeding and defecation behavior. During food scarcity, altered insulin signaling from sensory neurons activates the transcription factor DAF-16/FoxO in midgut epithelia, which blocks both peptidergic signaling axes to the ENS by transcriptionally shutting down the intestinal neuropeptide secretion machinery. Our findings demonstrate that midgut epithelial cells act as integrators relaying internal state information to distinct parts of the ENS to control animal behavior.


Figures

Fig. 1.
Fig. 1.. Starvation inhibits ENS function via cell nonautonomous activity of DAF-16/FoxO in the intestine.
(A) Schematic showing the anatomical locations of PENs and HENs in the alimentary tract of C. elegans; adapted from WormBook (117). (B and C) Pharyngeal pumping rate and frequncy of expulsion on food in fed versus starved (4 hours) wild-type adults and in starvation-induced dauer stage animals. (D and E) Timing of pBoc and Exp events, and expulsion:pBoc ratio on food in fed vs starved (4 hours) wild-type adults. (F) Pharyngeal pumping rate on food in fed versus starved (4 hours) wild-type and daf-16(mu86) adults. (G) Intestine-specific DAF-16 depletion in daf-16(ot853); otSi2[ges-1p::TIR1(F79G)]; daf-2(e1370) dauer stage animals. Animals were treated with either solvent (ethanol) or 100 μM 5-Ph-IAA. DAF-16 was not detected in the midgut epithelial cells after 5-Ph-IAA treatment in 15 of 15 animals. Scale bars, 20 μm. (H) Pharyngeal pumping rate on food after intestine-specific DAF-16 depletion in fed versus starved (4 hours) daf-16(ot853); otSi2[ges-1p::TIR1(F79G)] adults. Animals were treated with either solvent (ethanol) or 100 μM 5-Ph-IAA. (I and J) Frequency of expulsion and expulsion:pBoc ratio on food after intestine-specific DAF-16 depletion in fed versus starved (4 hours) daf-16(ot853); otSi2[ges-1p::TIR1(F79G)] adults treated with 100 μM 5-Ph-IAA. Horizontal line in the middle of data points represents median value of biological replicates in (B), (C), (E), (F), and (H) to (J). Additional horizontal lines represent 25th and 75th percentiles in (B), (F), and (H). *P < 0.05, ***P < 0.001, ****P < 0.0001; ns, not significant. (B and C) Dunn’s multiple comparison test after Kruskal-Wallis test. (E, I and J) Mann-Whitney test. (F and H) Sidak’s multiple comparisons test after two-way analysis of variance (ANOVA).
Fig. 2.
Fig. 2.. DAF-16/FoxO silences transcription of several metabolic pathway genes in the gut upon acute starvation.
(A) Pharyngeal pumping rate on food in fed versus starved (4 hours) wild-type and otIs913[pha-4prom2::daf-2(DN)] adults. Horizontal line in the middle of data points and additional horizontal lines represent median of biological replicates, and 25th and 75th percentiles, respectively. *P < 0.05, ***P < 0.001; ns, not significant. Sidak’s multiple comparisons test after two-way ANOVA. (B) Schematic of RNA-seq strategy to determine gene expression changes mediated by intestinal DAF-16 in dauer stage animals. (C and D) Principal components analysis (PCA) plot and heatmap of sample-to-sample distance matrix for all samples used in RNA-seq analysis. (E) Volcano plots for expression changes due to auxin alone or auxin in the presence of intestinal TIR1(F79G). Dashed vertical lines indicate the fold change cutoff of 1.5-fold. (F) Venn diagram for the number of differentially expressed genes for each of the four comparisons. (G) Heatmap of 1205 genes that are differentially expressed after depletion of intestinal DAF-16 in dauers. (H) Overlap of genes regulated by intestinal DAF-16 in dauers (this study) with all genes that undergo transcriptional changes during dauer formation as previously reported (50). (I) Overlap of genes regulated by intestinal DAF-16 in dauers (this study) with known class I and class II transcriptional targets of DAF-16 as previously reported (52). (J) Venn diagram showing overlap of genes regulated by intestinal DAF-16 in dauers (this study) with all genes that are differentially expressed in elt-2; elt-7 double mutant animals as previously reported (53).
Fig. 3.
Fig. 3.. Reversing the intestinal DAF-16/FoxO–induced changes in the expression of insulin peptide genes mildly reverses the silenced state of the dauer pharynx.
(A) Change in expression levels of insulin family genes that are differentially expressed after intestine-specific DAF-16 depletion in dauers. (B) Change in expression levels of insulin family genes shown in (A) from the previously reported dauer versus L2d dataset (50). (C) Expression of the endogenously tagged ins-1 reporter allele syb5452[ins-1::SL2::gfp::his-44] in fed adult and starvation-induced dauer stage animals. (D) Pharyngeal pumping rate on food in starvation-induced dauer stage animals with single or combination of null mutations in ins-1, ins-18, and ins-24 genes. (E) Pharyngeal pumping rate on food in starvation-induced dauer stage animals with defective neuropeptide secretion from the intestine, i.e., aex-1(sa9) and aex-5(sa23) mutants. (F) Expression of the endogenously tagged ins-7 reporter allele syb5424[ins-7::SL2::gfp::his-44] in fed adult and starvation-induced dauer stage animals. (G) Pharyngeal pumping rate on food in starvation-induced dauer stage animals that constitutively express ins-7 in the intestine (otEx8240 and otEx8241 lines). Horizontal line in the middle of data points represents median value of biological replicates in (D), (E), and (G). ***P < 0.001, ****P < 0.0001; ns, not significant. (D, E, and G) Dunn’s multiple comparison test after Kruskal-Wallis test. Scale bars, 20 μm (C and F).
Fig. 4.
Fig. 4.. DAF-16/FoxO shuts down the intestinal neuropeptide secretion machinery genes during prolonged starvation.
(A) Change in expression levels of aex-1, aex-4, and aex-5 genes after intestine-specific DAF-16 depletion in dauers. (B) Change in expression levels of aex-1, aex-4, and aex-5 genes from the previously reported dauer versus L2d dataset (50). (C and D) Expression of the endogenously tagged aex-1 reporter allele aex-1(ot1543[aex-1::SL2::gfp::his-44]) in fed adult and L3 larva and in starvation-induced dauer stage animals. Quantification of aex-1 expression in midgut epithelial cells is shown in (D). (E and F) Expression of the endogenously tagged aex-4 reporter allele aex-4(ot1530[aex-4::SL2::gfp::his-44]) in fed adult and L3 larva and in starvation-induced dauer stage animals. Quantification of aex-4 expression in midgut epithelial cells is shown in (F). (G) Expression of the endogenously tagged aex-1 reporter allele aex-1(ot1543[aex-1::SL2::gfp::his-44]) in the midgut epithelial cells of fed versus starved (24 hours) adults. (H) Expression of the endogenously tagged aex-4 reporter allele aex-4(ot1530[aex-4::SL2::gfp::his-44]) in the midgut epithelial cells of fed versus starved (24 hours) adults. Horizontal line in the middle of data points and additional horizontal lines represent median of biological replicates and 25th and 75th percentiles, respectively, in (D) and (F) to (H). *P < 0.05, ****P < 0.0001; ns, not significant. (D and F) Dunn’s multiple comparison test after Kruskal-Wallis test. (G and H) Sidak’s multiple comparisons test after two-way ANOVA. Scale bars, 20 μm (C and E) and 5 μm (G and H).
Fig. 5.
Fig. 5.. DAF-16/FoxO shuts down the release of insulin peptides from the midgut epithelium during prolonged starvation.
(A and B) Secretion of INS-1::TagRFP from the intestine into coelomocytes in fed adult and L3 larva and in starvation-induced dauer stage animals expressing otEx8059[ges-1p::ins-1::tagRFP::SL2::gfp::his-44]. Quantification of INS-1::TagRFP intensity in gut lumen and gut cytoplasm and the ratio of INS-1::TagRFP intensity in coelomocytes: Gut cytoplasm is shown in (B). (C and D) Secretion of INS-1::TagRFP from the intestine into coelomocytes in daf-16(ot853); otSi2[ges-1p::TIR1(F79G)]; daf-2(e1370); otEx8220[ges-1p::ins-1::tagRFP] dauer stage animals after intestine-specific DAF-16 depletion. Animals were treated with either solvent (ethanol) or 100 μM 5-Ph-IAA. Ratio of INS-1::TagRFP intensity in coelomocytes: Gut lumen is shown in (D). (E and F) Secretion of INS-1::TagRFP from the intestine into coelomocytes in fed versus starved (24 hours) adults expressing otIs904[ges-1p::ins-1::tagRFP::SL2::gfp::his-44]. Ratio of INS-1::TagRFP intensity in coelomocytes: Gut cytoplasm is shown in (F). (G and H) Secretion of INS-1::TagRFP from the intestine into coelomocytes in fed wild-type or aex-1(ot1357) adults expressing otIs904[ges-1p::ins-1::tagRFP::SL2::gfp::his-44]. Ratio of INS-1::TagRFP intensity in coelomocytes: Gut cytoplasm is shown in (H). Horizontal line in the middle of data points and additional horizontal lines represent median of biological replicates and 25th and 75th percentiles, respectively in (B), (D), (F), and (H). *P < 0.05, ***P < 0.001, ****P < 0.0001; ns, not significant. (B) Dunn’s multiple comparison test after Kruskal-Wallis test. (D, F, and H) Mann-Whitney test. Scale bars, 20 μm (A, C, E, and G).
Fig. 6.
Fig. 6.. Active intestinal secretion of INS-7 and INS-35 is essential for normal pharyngeal pumping behavior in favorable conditions.
(A) Pharyngeal pumping rate on food in fed wild-type, aex-1(sa9), and aex-5(sa23) adults. (B) Pharyngeal pumping rate on food in fed wild-type and aex-1(ot1357) adults. (C) DAF-16 depletion from enteric neurons of the foregut in daf-16(ot853); otIs908[pha-4prom2::TIR1(F79G)] adults. Animals were treated with either solvent (ethanol) or 100 μM 5-Ph-IAA. The anterior and posterior bulbs of the pharynx are shown. Nonpharyngeal neurons where otIs908 is expressed are labeled. (D) Pharyngeal pumping rate on food after DAF-16 depletion from enteric neurons of the foregut in fed daf-16(ot853); otIs908[pha-4prom2::TIR1(F79G)] adults in wild-type or aex-1(ot1464) background. Animals were treated with either solvent (ethanol) or 100 μM 5-Ph-IAA. (E) Expression of the endogenously tagged ins-35 reporter allele syb6236[ins-35::SL2::gfp::his-44] in fed adult and starvation-induced dauer stage animals. (F) Pharyngeal pumping rate on food in fed wild-type, ins-7(ot1427), ins-35(ot1443), and ins-7(ot1427); ins-35(ot1443) adults. (G) Pharyngeal pumping rate on food in starvation-induced dauer stage animals that constitutively coexpress ins-7 and ins-35 in the intestine (otEx8222, otEx8223, and otEx8224). Horizontal line in the middle of data points and additional horizontal lines represent median of biological replicates and 25th and 75th percentiles, respectively in (A), (B), (D), (F), and (G). *P < 0.05, **P < 0.01, ***P < 0.001, and ****P < 0.0001; ns, not significant. (A, F and G) Dunn’s multiple comparison test after Kruskal-Wallis test. (B) Mann-Whitney test. (D) Sidak’s multiple comparisons test after two-way ANOVA. Scale bars, 20 μm (C and E).
Fig. 7.
Fig. 7.. NSM senses INS-7 and INS-35 from the gut to enhance pharyngeal nervous system output during the fed state.
(A) Expression of otIs937[ceh-19prom2::daf-2(DN)::eBFP2::SL2::tagRFP] in MC(L/R) neurons. (B) Pharyngeal pumping rate on food in fed wild-type and otIs937[ceh-19prom2::daf-2(DN)::eBFP2::SL2::tagRFP] adults. (C) Expression of otIs942[tph-1prom5::daf-2(DN)::eBFP2::SL2::tagRFP] in NSM(L/R) neurons. (D) Pharyngeal pumping rate on food in fed wild-type and otIs942[tph-1prom5::daf-2(DN)::eBFP2::SL2::tagRFP] adults. (E) Pharyngeal pumping rate on food in fed versus starved (4 hours) wild-type and otIs942[tph-1prom5::daf-2(DN)::eBFP2::SL2::tagRFP] adults. (F) Pharyngeal pumping rate on food in fed otIs942[tph-1prom5::daf-2(DN)::eBFP2::SL2::tagRFP] expressing adults in wild-type or ins-7(ot1427); ins-35(ot1443) background. (G) Pharyngeal pumping rate on food in fed versus starved (4 hours) wild-type and tph-1(ot1545) adults. (H) Pharyngeal pumping rate on food in starvation-induced dauer animals that constitutively coexpress ins-7 and ins-35 in the intestine (otEx8222) in wild-type or tph-1(ot1545) background. (I and J) DAF-16 protein in NSM neuron of fed versus starved (4 hours) adults and in starvation-induced dauer daf-16(ot853); otIs625[cat-1::SL2::mCherry::his-44] animals. Yellow asterisks show the nuclei of neighboring cells in (I). Nucleus-to-cytoplasm ratio of DAF-16 protein is shown in (J). (K and L) Secretion of NLP-40::TagRFP from the intestine into coelomocytes in fed versus starved (8 hours) adults expressing otIs927[ges-1p::nlp-40::tagRFP::SL2::gfp::his-44]. Horizontal line in the middle of data points represents median value of biological replicates in (B), (D to H), (J), and (L). Additional horizontal lines represent 25th and 75th percentiles in (B), (D to G), (J), and (L). *P < 0.05, **P < 0.01, ***P < 0.001, ****P < 0.0001; ns, not significant. (B, D and L) Mann-Whitney test. (E to H) Sidak’s multiple comparisons test after two-way ANOVA. (J) Dunn’s multiple comparison test after Kruskal-Wallis test. Scale bar, 20 μm (A, C, and K) and 1 μm (I).
Fig. 8.
Fig. 8.. Model for regulation of both feeding and defecation behavior by neuropeptides released from midgut epithelial cells in favorable or starved conditions.

References

    1. M. D. Gershon, The Second Brain (HarperCollins, 1998).
    1. Wood J. D., Enteric nervous system: Reflexes, pattern generators and motility. Curr. Opin. Gastroenterol. 24, 149–158 (2008). - PubMed
    1. Schneider S., Wright C. M., Heuckeroth R. O., Unexpected roles for the second brain: Enteric nervous system as master regulator of bowel function. Annu. Rev. Physiol. 81, 235–259 (2019). - PubMed
    1. Sharkey K. A., Mawe G. M., The enteric nervous system. Physio.l Rev. 103, 1487–1564 (2023).
    1. Drokhlyansky E., Smillie C. S., Van Wittenberghe N., Ericsson M., Griffin G. K., Eraslan G., Dionne D., Cuoco M. S., Goder-Reiser M. N., Sharova T., Kuksenko O., Aguirre A. J., Boland G. M., Graham D., Rozenblatt-Rosen O., Xavier R. J., Regev A., The human and mouse enteric nervous system at single-cell resolution. Cell 182, 1606–1622.e23 (2020). - PMC - PubMed

MeSH terms

LinkOut - more resources