. 2025 Sep 23;13(9):e012224.
doi: 10.1136/jitc-2025-012224.

Tertiary lymphoid structures in Merkel cell carcinoma facilitate naïve and central memory T-cell infiltration linked to immunotherapy response

Affiliations

Tertiary lymphoid structures in Merkel cell carcinoma facilitate naïve and central memory T-cell infiltration linked to immunotherapy response

Nalini Srinivas et al. J Immunother Cancer. .

Abstract

Background: The presence of tertiary lymphoid structures (TLS) in solid tumors, including Merkel cell carcinoma (MCC), is associated with a better prognosis and a better response to immunotherapy with immune checkpoint inhibition (ICI). The detailed mechanisms by which TLS influence antitumor immune responses are only partially understood.

Methods: Clinically annotated tumor tissues of 27 patients with MCC were obtained prior to ICI therapy. Tumor samples were subjected to transcriptomic and multiplex immuno-visual profiling, T-cell receptor (TCR) clonotype mapping, as well as-in selected cases-spatial transcriptomics to comprehensively characterize the tumor immune microenvironment.

Results: Weighted gene co-expression network analysis (WGCNA) of transcriptomic data in combination with topological overlap measures indicated a higher abundance of TLS in tumors of patients with MCC responding to ICI therapy. This concept was substantiated through immunomorphological analyses, revealing mature B-cell follicle-like structures characterized by high endothelial venules (HEVs). Further supporting HEVs as critical entry points for naïve T cells, the presence of TLS was correlated with a pronounced infiltration of CD4+ and CD8+ T cells, exhibiting both naïve and central memory phenotypes. The TCR repertoire of these infiltrates exhibited enhanced richness and diversity with a pronounced reactivity toward Merkel cell polyomavirus-derived T-cell epitopes. Spatially resolved RNA and V(D)J sequencing revealed the expression of genes associated with T-cell recruitment within TLS, alongside the presence of naïve and central memory T-cell markers. Notably, individual clonally expanded TCR transcripts were detected both within TLS and among tumor-infiltrating lymphocytes. The latter were associated with low expression of memory cell markers and high expression of effector cell markers. Additionally, a spatial gradient in the expression of genes linked to immune stress in MCC cells-such as those involved in the interferon-γ response and antigen processing and presentation machinery-originated in proximity to the TLS.

Conclusion: Our findings are consistent with a key role of TLS in shaping immune interactions within the MCC microenvironment, driving the recruitment of diverse tumor-reactive T cells. These insights hold promise for advancing immunotherapeutic strategies.

Keywords: T cell receptor - TCR; Tumor microenvironment - TME; biomarker; immune checkpoint inhibitor; skin cancer.


Conflict of interest statement

Competing interests: JCB is receiving speaker’s bureau honoraria from Amgen, MerckSerono, Pfizer, Sanofi, and Sun Pharma and is a paid consultant/advisory board member/DSMB member for Almirall, Boehringer Ingelheim, ICON, Pfizer, and Sanofi/Regeneron. JCB’s group receives research grants from Merck Serono/IQVIA, Regeneron, and Alcedis. SU declares research support from Bristol Myers Squibb and Merck Serono; speakers and advisory board honoraria from Bristol Myers Squibb, Merck Sharp & Dohme, Merck Serono, and Novartis; and meeting and travel support from Almirall, Bristol Myers Squibb, IGEA Clinical Biophysics, Merck Sharp & Dohme, Novartis, Pierre Fabre, and Sun Pharma; outside the submitted work. EL received honoraria from Novartis, Medac, Bristol Myers Squibb, Regeneron, Sanofi, Sun Pharma, and Pierre Fabre, reports consulting/advisory roles with Bristol Myers Squibb, Pierre Fabre, and Novartis; and received travel/accommodations/expenses from Pierre Fabre and Sun Pharma. PM received payment or honoraria for lectures, presentations, speakers’ bureaus, manuscript writing, or educational events from MSD, Novartis, BMS, Pierre Fabre, Sanofi Genzyme, Immunocore, Regeneron, Delcath, and Sun Pharma. Participation on Data Safety Monitoring Board or Advisory Board: MSD, Novartis, BMS, Pierre Fabre, Sanofi Genzyme, Immunocore, Regeneron, Delcath, Sun Pharma, Biotech. Support for attending meetings and/or travel: MSD, BMS, Sun Pharma, Novartis. CE does scientific consulting for 10x Genomics.

Figures
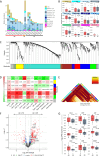
Figure 1
Figure 1. Gene expression signatures suggest presence of tertiary lymphoid structures in patients with MCC benefiting from immune checkpoint inhibition. (A) Cellular deconvolution using bulk EdgeSeq Precision Immuno-Oncology Panel gene expression data. The relative composition of immune cell types was inferred using counts per million (CPM) normalization for the objective response (OR, red), stable disease (SD, orange), and progressive disease (PD, gray) groups. The stacked bar plot represents the relative abundance of immune cell types per patient. (B) Box plots comparing the relative abundance of each immune cell type between OR (red) and PD (gray) patients. (C) Unsupervised cluster dendrogram of 1392 immune-oncology-related genes using Weighted Gene Co-expression Network Analysis (WGCNA). The dendrogram, based on the topological overlap measure (TOM), groups genes with highly correlated expression patterns into six distinct co-expression modules (blue, turquoise, red, yellow, dark red, and green), while the gray module contains genes that did not cluster into any specific module. (D) Heatmap representing the correlation between gene WGCNA topological overlap matrix modules and immune cell types from deconvolution analysis. Each row represents a gene module, and each column an immune cell type. The heatmap is color-coded by correlation strength (red, positive correlation and green, negative correlation). (E) Heatmap of the WGCNA topological overlap matrix showing relationships between genes based on their network connectivity. Rows and columns correspond to the individual genes, with light colors indicating high topological overlap, and progressively darker orange and red colors indicating lower topological overlap. The corresponding gene dendrograms and module assignments are shown on the left and right side of the heatmap. Highly overlapping genes from two modules (dark red and green) are highlighted and inferred to belong to the same functional gene class. (F) Differential gene expression analysis showing upregulation of tertiary lymphoid structure-associated genes in the objective response (OR) group. Nominal (unadjusted) p values are presented. (G) Expression of TLS-associated genes in comparison between OR (red) and PD (gray) groups. Statistically significant differences are indicated by p values.
Figure 2
Figure 2. Tertiary lymphoid structures correlate with a diverse central memory T-cell infiltrate. (A) Multiplex immunofluorescence of a representative MCC tumor tissue for CD20 (green), CD3 (magenta), Ki67 (orange), and SYP (tumor marker, blue) (scale bar: 100 µm). (B) Quantification of the total number of CD4+ T cells within a radius of 5–10 µm (total distance: 0–55 µm) of CD20+ B cells, determined by cell segmentation and cell type identification using high-plex spatial proteomics (online supplemental figure 3) with HALO software. (C) Proportion of memory CD4+/CD8+CD45RO+ cells and activated CD4+/CD8+ IFNγ+ cells, expressed as percentage of total cells in both TLS and dispersed region, quantified using high-plex spatial proteomics (online supplemental figure 3) with HALO software. (D) Immunohistochemistry for CD20 (brown), Ki67 (red), and peripheral node addressin (PNAd, green) for identifying HEVs (indicated by arrowheads) in close proximity to TLS. (E) Stacked bar graph representing proportion of patients with and without TLS in the three response groups—OR, SD, and PD; Fischer’s test p<0.001. (F) Heatmap of EdgeSeq Precision Immuno-Oncology Panel gene expression data representing TLS-signature genes (CCL2, CCL3, CCL4, CCL5, CCL8, CCL18, CCL19, CCL21, CXCL9, CXCL10, CXCL11, CXCL13, CD79B, CD1D, CCR6, LAT, CCR7, SELL, and MS4A1), HEV-associated genes (MADCAM1, VCAM1, ICAM1, and CCL21), naïve/central memory T cells (SELL, ITAG4, ITGB2, and CCR7), and mature/GC B cells markers (BCL6, AICDA, IGKC, IGHG1, CXCL13, LTA, and LTB) across individual patients in OR (red), SD (orange), and PD (gray) groups. TLS score is based on the number of TLS identified in each patient, ranging from 0 to 35. (G) TLS-associated gene signature validated in an independent MCC cohort (Reinstein et al36) treated with ICI, stratified by OR (red), SD (orange), and PD (gray). (H) Correlation between TCR diversity metrices (iChao, Simpson’s diversity, richness, Pielou’s evenness, Simpson’s clonality) and the number of detected TLS. (I) Plotting MCPyV-LTA-reactive TCR clones (left panel, dot size corresponds to the total number of T cells within the respective clone) and GIANA clusters that contain at least one MCPyV-antigen-recognizing TCR clone per repertoire (right panel) across TCRβ repertoires against TLS-signature gene score for MCC lesions of the indicated patients (OR, red, SD, orange, and PD, gray). CM, central memory T cells; CPM, counts per million; GC, germinal center; HEV, high endothelial venules; ICI, immune checkpoint inhibition; IFN, interferon; MCC, Merkel cell carcinoma; MCPyV, Merkel cell polyoma virus; OR, objective response; PD, progressive disease; SD, stable disease; sTLS, structured TLS; TCR, T-cell receptor; unTLS, unstructured TLS.
Figure 3
Figure 3. Spatial transcriptomics reveals tertiary lymphoid structures-associated T-cell recruitment, activation, and their functional impact on Merkel cell carcinoma (MCC) cells. (A) The optimal number of clusters for spatial clustering was determined using BayesSpace in conjunction with an elbow plot. Based on the analysis, q=7 was selected as the most appropriate number of clusters. (B) The spatial neighborhood network (SNN) clustering results were visualized using Uniform Manifold Approximation and Projection (UMAP), displaying the 9090 spots at an enhanced resolution. The inferred gene expression patterns were grouped according to the spatial clusters identified by BayesSpace. (C) Spatial clusters mapped onto tissue architecture, with spots projected back onto their spatial coordinates in enhanced resolution. (D) Classification of spatial clusters as tertiary lymphoid structures (TLS) based on spatial features and gene expression was validated by immunofluorescence. Clusters 1, 2, and 6 were classified as TLS, and the remaining clusters as tumor. Spots with higher CHGA expression, located within or adjacent to TLS were, classified as tumor-TLS. (E) Inferred gene expressions of markers for MCC cells (CHGA), B lymphocytes (MS4A1), lymphocyte recruitment (CCL21), naïve/memory T cells (IL7R and SELL), and effector T cells (GZMB), visualized on enhanced spatial coordinates. (F) Expression of apoptosis-associated genes (PARP14, PARP9, and IRF9), interferon (IFN)-stimulated genes (OAS2, IFI27, and MX1), and antigen presentation and processing machinery associated genes (HLA-DRB1, TAP1, and STAT1) in TLS, tumor-TLS, and tumor regions. (G) Number of unique molecular identifiers (UMIs) and number of spots per clone visualized in bar plots, and the scaled spot counts by region per clone visualized in heat map, of the top 20 TRB clones. (H) Visualization of the top three TRB clones in spatial coordinates. Color indicates log (UMI counts) per spot. (I) Heatmap showing the scaled average expressions of T-cell-naïve, effector, and exhaustion marker genes per region (TLS, tumor-TLS, and tumor) for 108 clonal subspots containing TRB clone CASSLSVRTEAFF.

References

    1. Becker JC, Stang A, Schrama D, et al. Merkel Cell Carcinoma: Integrating Epidemiology, Immunology, and Therapeutic Updates. Am J Clin Dermatol. 2024;25:541–57. doi: 10.1007/s40257-024-00858-z. - DOI - PMC - PubMed
    1. Feng H, Shuda M, Chang Y, et al. Clonal integration of a polyomavirus in human Merkel cell carcinoma. Science. 2008;319:1096–100. doi: 10.1126/science.1152586. - DOI - PMC - PubMed
    1. Houben R, Shuda M, Weinkam R, et al. Merkel cell polyomavirus-infected Merkel cell carcinoma cells require expression of viral T antigens. J Virol. 2010;84:7064–72. doi: 10.1128/JVI.02400-09. - DOI - PMC - PubMed
    1. Ohnezeit D, Huang J, Westerkamp U, et al. Merkel cell polyomavirus small tumor antigen contributes to immune evasion by interfering with type I interferon signaling. PLoS Pathog. 2024;20:e1012426. doi: 10.1371/journal.ppat.1012426. - DOI - PMC - PubMed
    1. Jani S, Church CD, Nghiem P. Insights into anti-tumor immunity via the polyomavirus shared across human Merkel cell carcinomas. Front Immunol. 2023;14:1172913. doi: 10.3389/fimmu.2023.1172913. - DOI - PMC - PubMed