. 2025 Sep 24;16(1):8368.
doi: 10.1038/s41467-025-62419-0.

Shared genetic architecture contributes to risk of major cardiovascular diseases

Affiliations

Shared genetic architecture contributes to risk of major cardiovascular diseases

Jun Qiao et al. Nat Commun. .

Abstract

The extensive co-occurrence of cardiovascular diseases (CVDs), as evidenced by epidemiological studies, is supported by positive genetic correlations identified in comprehensive genetic investigations, suggesting a shared genetic basis. However, the precise genetic mechanisms underlying these associations remain elusive. By assessing genetic correlations, genetic overlap, and causal connections, we aim to shed light on common genetic underpinnings among major CVDs. Employing multi-trait analysis, we pursue diverse strategies to unveil shared genetic elements, encompassing SNPs, genes, gene sets, and functional categories with pleiotropic implications. Our study systematically quantifies genetic overlap beyond genome-wide genetic correlations across CVDs, while identifying a putative causal relationship between coronary artery disease (CAD) and heart failure (HF). We then pinpointed 38 genomic loci with pleiotropic influence across CVDs, of which the most influential pleiotropic locus is located at the LPA gene. Notably, 12 loci present high evidence of multi-trait colocalization and display congruent directional effects. Examination of genes and gene sets linked to these loci unveiled robust associations with circulatory system development processes. Intriguingly, distinct patterns predominantly driven by atrial fibrillation, coronary artery disease, and venous thromboembolism underscore the significant disparities between clinically defined CVD classifications and underlying shared biological mechanisms, according to functional annotation findings.


Conflict of interest statement

Competing interests: The authors declare no competing interests.

Figures

Fig. 1
Fig. 1. Schematic representation of analyses performed for all 6 major cardiovascular diseases in the current study.
This figure illustrates the comprehensive analytical approach used for all six major cardiovascular diseases within this study. The initial GWAS findings were obtained from various repositories. Before integrating cardiovascular diseases into a multi-trait analysis, genetic characteristics, such as genome-wide and local genetic correlations, and genetic overlap were individually estimated to identify genetic overlap across the six CVDs beyond genetic correlations. The shared genetic basis was interpreted as genetic variants influencing multiple complex phenotypic traits through vertical and horizontal pleiotropy. Mendelian randomization was used to elucidate the important role of vertical pleiotropy in CVDs. Subsequently, the results of SNP and genomic loci analyses from the multi-trait assessment, along with cross-trait analysis for replication, were compared with the results from individual cardiovascular diseases, uncovering many novel pleiotropic loci. Various methods were employed to comprehensively characterize the shared genetic mechanisms for each of the six cardiovascular diseases. First, we examined the convergence of SNPs, genomic loci, and mapped genes. Subsequent stages involved biological pathway and functional category analyses, evaluating the enrichment of genetic signals across 9398 distinct gene sets and 49 tissue types for each disease. The enrichment assessments were further extended using LDSC-SEG and GARFIELD, covering 489 and 1005 functional genomic categories, respectively. The diagram was created using BioRender and included with permission for publication (Created in BioRender. Feng, Y. (2025) https://BioRender.com/mp87c7d). AF atrial fibrillation, CAD coronary artery disease, VTE venous thromboembolism, HF heart failure, PAD peripheral artery disease.
Fig. 2
Fig. 2. Genome-wide and local genetic correlations, and genetic overlap of the six cardiovascular diseases.
a Error-bar plot of the SNP-based heritability (h2SNP) point estimates for the six cardiovascular diseases, calculated using univariate LDSC. The magnitude and precision of the estimates varied substantially across the CVDs (h2SNP range from 0.0059 to 0.0324; standard error (SE) range from 0.0005 to 0.0033). Error bars represented one standard deviation (SD) (1.96 × SE). b Network visualization of the Bonferroni-corrected significant global rg among the cardiovascular diseases, calculated using bivariate LDSC. Connections represented significant rg, with the correlation value along connections, thicker lines indicating stronger correlations, and dark gray denoting more significant correlations. The size of the nodes is weighted by the sample size and h2SNP of the given cardiovascular disease (size = h2SNP × sqrt(n)) (AF, n = 1,030,836; CAD, n = 1,165,690; VTE, n = 1,500,861; HF, n = 977,323; PAD, n = 511,634; Stroke, n = 1,308,460). c Along the diagonal, univariate MiXeR estimates are provided for each CVD. h2SNP = SNP-based heritability estimate; polygenicity90 = number (in thousands) of causal variants with the strongest effects required to explain 90% of SNP-based heritability. Mixer-modeled genome-wide genetic overlap and genetic correlations (top-right) and LAVA local correlations (bottom-left) across the six CVDs are shown. Top-right: MiXeR Venn diagrams showing the number of shared and disorder-specific “causal” variants for each pair of diseases. Genome-wide genetic correlation (rg) and genetic correlation of shared variants (rgs) are represented by the color of the disease-specific (rg) and shared regions (rgs), respectively, in the Venn diagrams. For AF-HF, CAD-PAD, and HF-PAD, both AICs (best_vs_min_AIC and best_vs_max_AIC) were negative, indicating that the analysis lacked sufficient power to provide precise estimates of genetic overlap. Bottom-left: Volcano plots of LAVA local genetic correlation coefficients (rho, y-axis) against -log10 (P values) for each pairwise analysis at each locus. P values of the local rg were corrected for the total number of bivariate tests conducted (P  =  0.05/ the number of bivariate tests = 0.05/1672  =  2.9 × 10−5). All statistical tests were two-sided. Larger dots with black circles represent loci significantly correlated after the Bonferroni correction. MiXeR-estimated rg and rgs, and LAVA estimated rho were represented on the same blue to red color scale. Note that the Volcano plots were plotted at P values truncated by 1 × 10−10 for better visualization. AF atrial fibrillation, CAD coronary artery disease, VTE venous thromboembolism, HF heart failure, PAD peripheral artery disease.
Fig. 3
Fig. 3. Results of multi-traits meta-analysis by MTAG based on over 1.2 million individuals.
af Manhattan plots for MTAG results of each cardiovascular disease. The X-axis represented the chromosomal position, and the Y-axis showed the negative log10-transformed P values for each SNP. Cytoband annotations for the newly identified genomic loci are shown in gray. Genome-wide significance was indicated by the multiple comparisons-corrected threshold of P = 1.67 × 10−8 (red dotted line). Colored dots indicated an independent genome-wide significant association with the smallest P value (Top lead SNP). Only SNPs common to all summary statistics were included. All statistical tests are two-sided. MTAG multi-trait analysis of GWAS, AF atrial fibrillation, CAD: coronary artery disease, VTE venous thromboembolism, HF heart failure, PAD peripheral artery disease.
Fig. 4
Fig. 4. The three most pleiotropic loci associated with all six cardiovascular diseases.
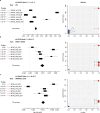
ac Forest plots with PM-plots show disease-specific effects of the index SNP in each locus, including rs10455872 on 6q25.3, rs2107595 on 7p21.1, and rs112898275 on 19p13.2. For each locus, the disease-specific effects of the causal SNP were illustrated using ForestPMPlot, based on Metasoft analysis. The first panel was a forest plot displaying the disease-specific association P value, log odds ratios (ORs), and standard errors (SE) for the SNP. Each black square represents the point estimate of the effect size (log OR) for an individual study, with the size of the square proportional to the weight assigned to that study in the meta-analysis. The width of the line in each study represents the confidence interval (CI) for the effect size estimate. The diamond at the bottom indicates the overall effect estimate from the fixed-effects (FE) model, with its width corresponding to the 95% CI of the pooled estimate. The meta-analysis P value and corresponding summary statistic were displayed at the top and bottom of the forest plot, respectively. The second panel was a PM-plot where the X-axis represents the m-value, the posterior probability that the effect exists in each disease, and the Y-axis represents the disease-specific association P value as −log10 (P value). Diseases were represented by dots, where the size corresponds to the sample size of the individual GWAS (AF, n = 1,076,012; CAD, n = 1,237,236; VTE, n = 1,631,058; HF, n = 1,219,100; PAD, n = 843,568; Stroke, n = 1,735,909). Diseases with estimated m-values of at least 0.9 are colored red, indicating that the SNP has an effect on the disease, while those with m values below 0.1 are marked blue, suggesting that the SNP does not have an effect. Diseases with estimated m-values between 0.1 and 0.9 are colored green, indicating that the SNP may have an uncertain effect on the disease. All statistical tests were two-sided. AF atrial fibrillation, CAD coronary artery disease, VTE venous thromboembolism, HF heart failure, PAD peripheral artery disease.

References

    1. Roth, G. A. et al. Global burden of cardiovascular diseases and risk factors, 1990-2019: update from the GBD 2019 study. J. Am. Coll. Cardiol.76, 2982–3021 (2020). - PMC - PubMed
    1. Roger, V. L. Epidemiology of heart failure: a contemporary perspective. Circ. Res.128, 1421–1434 (2021). - PubMed
    1. Vinter, N. et al. Temporal trends in lifetime risks of atrial fibrillation and its complications between 2000 and 2022: Danish, nationwide, population based cohort study. BMJ385, e77209 (2024). - PMC - PubMed
    1. Aday, A. W. & Matsushita, K. Epidemiology of peripheral artery disease and polyvascular disease. Circ. Res.128, 1818–1832 (2021). - PMC - PubMed
    1. Glynn, R. J. & Rosner, B. Comparison of risk factors for the competing risks of coronary heart disease, stroke, and venous thromboembolism. Am. J. Epidemiol.162, 975–982 (2005). - PubMed

MeSH terms

LinkOut - more resources