

A machine learning approach to identify patients at risk for long-term consequences after pulmonary embolism
- PMID: 40993195
- PMCID: PMC12460599
- DOI: 10.1038/s41598-025-14893-1
A machine learning approach to identify patients at risk for long-term consequences after pulmonary embolism
Abstract
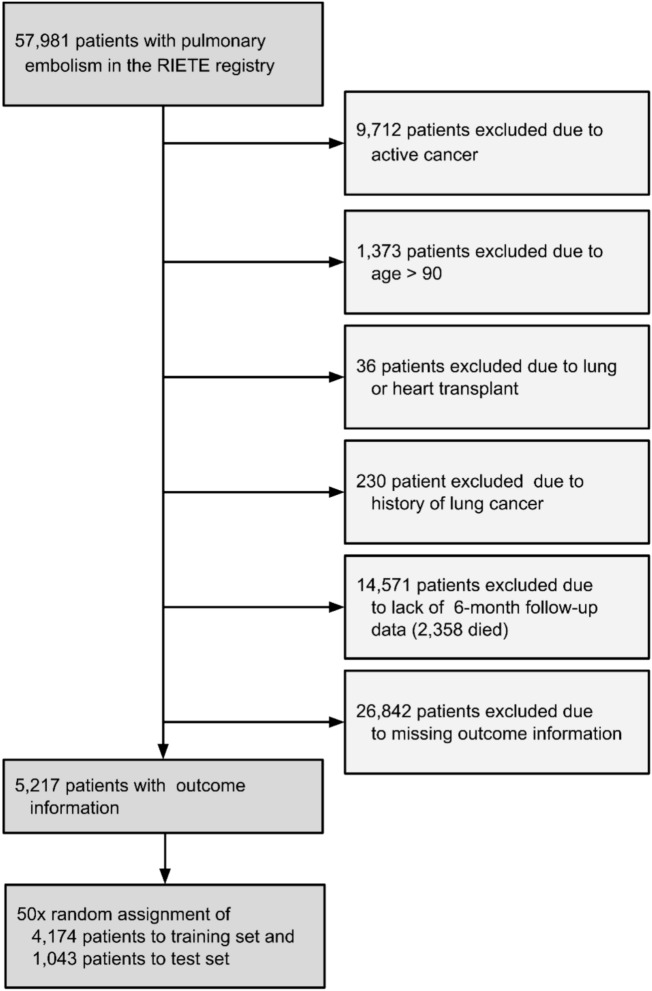
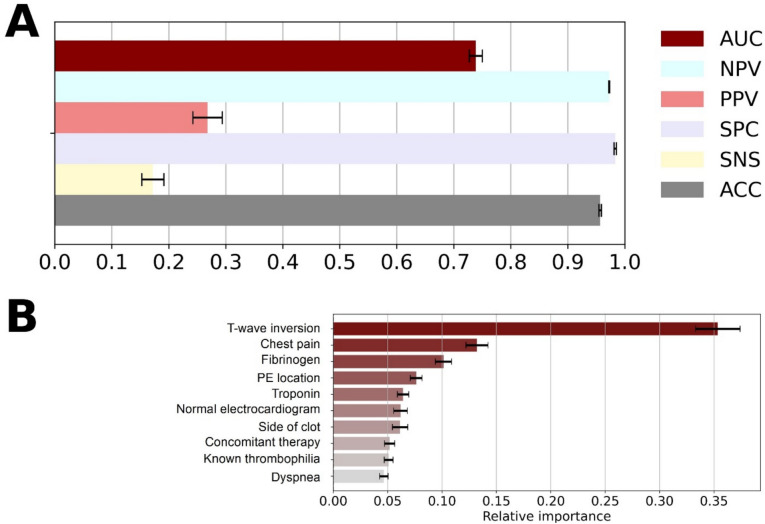
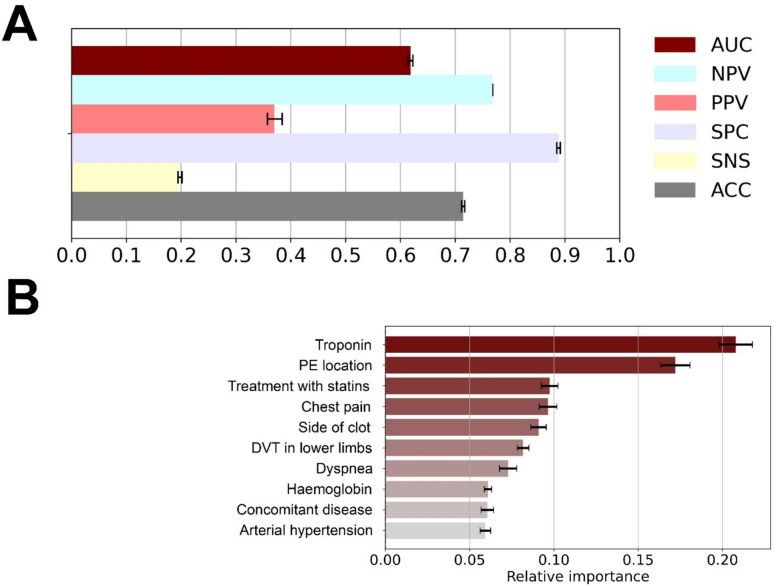
Pulmonary embolism (PE) can result in long-term sequelae, such as post-PE syndrome, including persistent dyspnea and chronic thromboembolic pulmonary hypertension (CTEPH). Existing prediction tools for severe post-PE complications lack sensitivity and specificity. This study aimed to develop a machine learning model to identify patients at risk for long-term consequences after PE. Using data from the RIETE registry, the largest prospective international PE registry, we developed supervised machine learning models to identify patients at increased risk of CTEPH and post-PE syndrome. Our approach involved data preprocessing, model training via random forest algorithm, and validation through Monte-Carlo cross-validation. The performance of the CTEPH prediction model was benchmarked against an existing score. Of the 57,981 PE patients in the RIETE registry, 5,217 were eligible for inclusion. Median age was 68 years, with 50.6% men. Machine learning was based on 111 predictor variables, with 171 patients (3.3%) developing CTEPH. The CTEPH model demonstrated good performance with an AUC of 0.74 (95%CI: 0.73-0.75), significantly outperforming the existing CTEPH prediction score (0.57; 0.54-0.61). Additionally, 1,310 (25.1%) patients were defined as having post-PE syndrome six months after index PE. The post-PE syndrome model showed poorer performance with an AUC of 0.62 (0.61-0.62). Key predictor variables across both models included chest pain at presentation, PE location, troponin, side of clot, and dyspnea at presentation. Machine learning models show promise in predicting CTEPH but are less effective for post-PE syndrome. Future refinement, including integrating imaging data, is necessary to improve predictive performance and clinical utility.
Keywords: Dyspnea; Machine learning; Prediction; Pulmonary arterial hypertension; Pulmonary embolism; Venous thromboembolism.
© 2025. The Author(s).
Conflict of interest statement
Declarations. Competing interests: The authors declare no competing interests.
Figures

References
MeSH terms
Grants and funding
LinkOut - more resources
Full Text Sources
Medical
