. 2025 Oct;646(8085):707-715.
doi: 10.1038/s41586-025-09564-0. Epub 2025 Sep 24.

Reprogramming neuroblastoma by diet-enhanced polyamine depletion

Affiliations

Reprogramming neuroblastoma by diet-enhanced polyamine depletion

Sarah Cherkaoui et al. Nature. 2025 Oct.

Abstract

Neuroblastoma is a highly lethal childhood tumour derived from differentiation-arrested neural crest cells1,2. Like all cancers, its growth is fuelled by metabolites obtained from either circulation or local biosynthesis3,4. Neuroblastomas depend on local polyamine biosynthesis, and the inhibitor difluoromethylornithine has shown clinical activity5. Here we show that such inhibition can be augmented by dietary restriction of upstream amino acid substrates, leading to disruption of oncogenic protein translation, tumour differentiation and profound survival gains in the Th-MYCN mouse model. Specifically, an arginine- and proline-free diet decreases the amount of the polyamine precursor ornithine and enhances tumour polyamine depletion by difluoromethylornithine. This polyamine depletion causes ribosome stalling, unexpectedly specifically at codons with adenosine in the third position. Such codons are selectively enriched in cell cycle genes and low in neuronal differentiation genes. Thus, impaired translation of these codons, induced by combined dietary and pharmacological intervention, favours a pro-differentiation proteome. These results suggest that the genes of specific cellular programmes have evolved hallmark codon usage preferences that enable coherent translational rewiring in response to metabolic stresses, and that this process can be targeted to activate differentiation of paediatric cancers.


Conflict of interest statement

Competing interests: J.D.R. is a member of the Rutgers Cancer Institute of New Jersey and the University of Pennsylvania Diabetes Research Center; a co-founder, director and stockholder in Raze Therapeutics and Farber Partners; a co-founder and stockholder in Fargo Biotechnologies; and an advisor and stockholder in Empress Therapeutics, Bantam Pharmaceuticals, Faeth Therapeutics, Colorado Research Partners and Rafael Pharmaceuticals. The University of Zürich has filed a provisional patent on combining difluormethylornithine with amino acid manipulations for therapeutic use.

Figures

Fig. 1
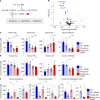
Fig. 1. MYCN-driven neuroblastoma tumours are characterized by high proline levels and a functionally disconnected proline and arginine metabolism that is dependent on uptake from circulation.
a, Primary neuroblastoma tumour tissue was analysed using liquid chromatography–mass spectrometry-based metabolomics. b, Differential abundance of 303 metabolites. Proline was the most significantly increased metabolite in MYCN-amplified primary human neuroblastoma relative to non-amplified tumours. Dotted line marks the significance threshold, with P values corrected for a false discovery rate (FDR) of 0.05 (q < 0.05; n = 10). c, In vivo stable isotope tracing identifies the circulating precursors of intratumoral metabolites. Labelling is normalized to the serum for each infused [U-13C] metabolite in Th-MYCN mice fed a chow diet. Data are mean ± s.e.m. Proline serum: n = 6; proline tumour: n = 4; glutamine serum: n = 9; glutamine tumour: n = 9; arginine serum: n = 8; arginine tumour: n = 8; ornithine serum: n = 7; ornithine tumour: n = 6. d, Direct circulating nutrient contributions to tumour tissue metabolite pools of proline, arginine and ornithine in Th-MYCN mice. The colour indicates the respective circulating nutrient source. Contributions derived from [U-13C]-labelled tracer infusions, derived from data shown in c. Data are mean ± s.e.m. e, Oral gavage of 13C-labelled nutrients shows the dietary contribution to circulating ornithine. The gavage feed introduces one-third of the daily intake of the respective amino acid in its [U-13C] form, which is used to quantify its contribution to polyamine-related downstream metabolites over time. Feeds in the Th-MYCN model are adapted to mouse weight. Data are mean ± s.e.m., n = 6. f, Schematic of tumour metabolite sources in neuroblastoma. The amino acids proline and arginine are primarily taken up from circulation. Tracing identifies the polyamine precursor ornithine to be primarily derived from circulation and not from intratumoral biosynthesis. Arginine is the primary circulatory substrate for ornithine production. In the intestine, ornithine is produced from arginine and proline through OAT activity. Panels a, c, e and f created in BioRender. Morscher, R. (2025) https://BioRender.com/ntr5665 (a); https://BioRender.com/x0bpqyh (c); https://BioRender.com/50lb1xh (e); https://BioRender.com/3h88n1g (f). Source data
Fig. 2
Fig. 2. A ProArg-free diet enhances tumour growth suppression by DFMO in MYCN-driven neuroblastoma.
a, Schematic of two-factor intervention, including the ProArg-free diet (from day 21) and DFMO treatment via the drinking water (1%, from day 0 to nursing mothers and directly to pups from day 28) in the Th-MYCN genetically modified mouse model. b, Kaplan–Meier curve of tumour-free survival with combined CD or ProArg-free diet plus DFMO. P value from log-rank test compared to CD. c, Tumour growth, defined as tumour mass at death normalized by day of life. Two-tailed t-test compared to CD. Data are mean ± s.e.m. CD: n = 13; CD + DFMO: n = 14; ProArg-free: n = 13; ProArg-free + DFMO: n = 14. *P < 0.05, **P < 0.01, ***P < 0.001, ****P < 0.0001. Panel a created in BioRender. Morscher, R. (2025) https://BioRender.com/n9dgse0. Source data
Fig. 3
Fig. 3. Dietary intervention causes substrate depletion to enhance polyamine biosynthesis inhibition by DFMO.
a, Schematic of arginine, proline and glutamine metabolism and its direct link to polyamines via ornithine. GSAL, glutamate-γ-semialdehyde; P5C, pyrroline-5-carboxylate. b, Differential serum metabolite levels comparing ProArg-free diet with CD. Blue dots highlight metabolites that are significantly depleted (FDR < 0.05) and the rose dot indicates a metabolite that was upregulated compared with CD. CD: n = 8; ProArg-free: n = 7. c, Serum arginine, proline, glutamine and ornithine across groups. Statistical comparisons to CD. Data are mean ± s.e.m. CD: n = 8; CD + DMFO: n = 10; ProArg-free: n = 7; ProArg-free + DFMO: n = 7. d, Tumour arginine, proline, glutamine and ornithine levels reveal dysregulation of arginine and proline metabolism with combined ProArg-free diet plus DFMO treatment. Average age at end point is eight weeks. Statistical comparisons to CD. Data are mean ± s.e.m. CD: n = 5; CD + DMFO: n = 5; ProArg-free: n = 8; ProArg-free + DFMO: n = 4. e, A ProArg-free diet enhances polyamine depletion in tumour tissue induced by DFMO in prolonged treatment. Average age at end point is 12 weeks. Statistical comparisons to CD. Insets, magnified graphs highlight the additional difference in polyamine levels induced by ProArg-free diet over DFMO only. Data are mean ± s.e.m. CD: n = 5; CD + DMFO: n = 5; ProArg-free: n = 6; ProArg-free + DFMO: n = 4. Two-tailed t-test. n denotes the number of mice measured by metabolomics. Source data
Fig. 4
Fig. 4. Ribo-seq reveals defective decoding of codons with adenosine in the third position following polyamine depletion.
a, For functional evaluation of translation, tumours were lysed in the presence of a translation inhibitor for preparation of RNA-seq and Ribo-seq libraries. Ribosome-protected RNA fragments were isolated and sequenced to assess translation. b, Normalized ribosome depth at positions encoding three or more consecutive proline residues. Decoding of these polyproline tracts is affected by combining DFMO (1% in the drinking water) with proline and arginine-free diet. c, Proline translation defects are codon-specific. Relative ribosome density centred around proline codons across treatment groups relative to CD (zero line). Left, density of ribosomes at polyproline tracts. Right, codon occupancy on proline codons outside of polyproline tracts. Increased occupancy manifests at CCA and less at CCC. d, Codons with adenosine in the third position show specific translation defects induced by the combined ProArg-free diet plus DFMO treatment compared with CD diet when comparing the transcriptome-wide relative ribosome occupancy. Codons that require tRNAs with modifications at position 34 for decoding are highly enriched in codon pausing following ProArg-free diet plus DFMO treatment compared with CD. Relative pausing of codons in the ribosomal P site. GalQ, galactosyl-queuosine; I, inosine; manQ, mannosyl-queuosine; mchm5U, 5-methoxycarbonyl-hydroxymethyluridine; mcm5s2U, 5-methoxycarbonylmethyl-2-thiouridine; ncm5U, 5-carbamoylmethyluridine; Q, queuosine. e, Schematic showing two mechanisms of polyamine depletion therapy. Only the combined treatment induces mild hallmarks of eIF5A hypusination deficiency and boosts the codon-specific translation defect induced by polyamine depletion. As described in Fig. 3, data in be are from the Th-MYCN mouse model. For all mean, n = 5. Panels a and e created in BioRender. Morscher, R. (2025) https://BioRender.com/75ofpvn (a); https://BioRender.com/iydko99 (e). Source data
Fig. 5
Fig. 5. Regulation of translation by polyamine depletion is driven by fractional codon content.
a, Gene set enrichment analysis (GSEA) of protein biosynthesis using omics layers: gene-expression (RNA-seq), gene translation (Ribo-seq) and protein (proteomics) levels. GSEA compares ProArg-free plus DFMO to CD using the Reactome gene sets. All pathways are depicted, ranked by significance (Benjamini–Hochberg correction) and signed by normalized enrichment score (NES). The most downregulated and upregulated sets at the protein level are cell cycle and neuronal system, respectively. Lines connect gene sets across the omics layers. b, Mean fraction of codons with adenosine in the third position (A-ending codons) across all pathways and significantly changed pathways identified in a. Pathways taken from Reactome gene sets. c, The percentage of codons with adenosine in the third position correlates with the average protein level across Reactome pathways. Pathways with an increasing fraction of codons with adenosine in the third position have lower protein levels in ProArg-free DFMO compared with CD. FC, fold change. d, Fold change across omics layers of top downregulated cell cycle proteins indicates that differences between ProArg-free diet plus DFMO and CD occur predominantly on the protein level. e, Percentage of codons with the respective nucleotide at the third position in the Itgb3bp gene (encoding CENPR protein) compared with the transcriptome background. In a,c,d, RNA-seq, ProArg-free + DFMO: n = 5; CD: n = 4. Ribo-seq, n = 5. Proteomics, ProArg-free + DFMO: n = 6; CD: n = 5. Panels a and b created in BioRender. Morscher, R. (2025) https://BioRender.com/ygrgncb (a); https://BioRender.com/566gynw (b). Source data
Fig. 6
Fig. 6. Polyamine depletion-mediated proteome rewiring induces neuroblastoma differentiation.
a, GSEA across omics layers in all three treatment groups using the Hallmark gene set. Only the ProArg-free plus DFMO treatment group showed a significant effect compared with CD. The effect was mainly on the translation and protein level. Shown are the five top enriched sets (complete sets in Extended Data Fig. 10c). Size indicates P value (Benjamini–Hochberg correction) and colour represents NES, with red indicating enrichment in the intervention group (CD + DFMO, ProArg-free or ProArg-free + DFMO) and blue indicating enrichment in the CD group. b, Western blot analysis of MYCN in tumours from CD and ProArg-free plus DFMO treatment arms. Negative control (C1), CHLA20 neuroblastoma cell line (MYCN non-amplified, MYC expressing); positive control (C2), IMR5 neuroblastoma cell line (MYCN-amplified). GAPDH is used as a loading control. Blots are representative of two independent experiments yielding similar results. c, Representative haematoxylin and eosin (H&E)-stained sections. CD and ProArg-free diet treatments show undifferentiated primitive neuroblasts, absent neuropil and prominent mitotic figures. CD plus DFMO shows poorly differentiated primitive neuroblasts with scant neuropil (arrowhead) and foci of cytodifferentiation (<5% differentiating, arrow). ProArg-free diet plus DFMO tumours show high fractions of differentiating neuroblasts (>5% differentiating) with increased cytoplasmic to nuclear ratio (arrow) and abundant neuropil (arrowhead). Sections are representative of many images with  the same observations. Scale bars, 50 μm. d, Summary of treatment effects. Cell cycle and MYCN programmes are downregulated at the protein level owing to translation inhibition and immature cancer cells are driven into neuronal differentiation. In a,c, RNA-seq: ProArg-free DFMO: n = 5; CD: n = 4. Ribo-seq: n = 5. Proteomics: ProArg-free DFMO: n = 6; CD: n = 5. Panel d created in BioRender. Morscher, R. (2025) https://BioRender.com/kk9n051. Source data
Extended Data Fig. 1
Extended Data Fig. 1. Metabolomic profiling of MYCN-amplified primary patient tumors and xenografts reveals reprogramming of the arginine-proline-glutamine axis.
a) Global metabolomic signatures of primary human neuroblastoma tumors analyzed by principal component analysis, with MYCN-amplified (red) and non-amplified (blue). b) Heatmap of significantly changed metabolites in primary neuroblastoma tumor samples (q < 0.05), comparing MYCN-amplified to non-amplified tumors. Unsupervised clustering performed using Ward’s method. c) Levels of all proteinogenic amino acids in primary neuroblastoma tumor tissue. Data in a-c as in Fig. 1b with n = 10 each group and p-values corrected for false discovery rate.*q < 0.05. Mean ± s.e.m. d) Relative levels of polyamine related metabolites in bilateral xenografts from respective MYCN-amplified and non-amplified neuroblastoma cell lines. *P < 0.05, **P < 0.01, two-tailed paired t-test. Mean ± s.e.m., n = 4. e) Proline concentration in MYCN-driven neuroblastoma tumors is significantly increased in the Th-MYCN mouse model, whereas glutamine, arginine, ornithine and glutamate levels across organs are within physiological range. d,e, Mean ± s.e.m., proline tumor n = 31 other organs n = 8-31, glutamine tumor n = 29 other organs n = 8-29, arginine tumor n = 25 other organs n = 8-25 and tumor ornithine n = 24; glutamate tumor n = 23 other organs n = 8-25. f) Relative metabolite levels across tumors harvested at early (< 50 mm3) compared to the late timepoint in the Th-MYCN model. **P < 0.01, ***P < 0.001, Two-tailed t-test. Mean ± s.e.m., early n = 10, late n = 14. Panels d and e created in BioRender. Noureddine, N. (2025) https://BioRender.com/vxtxvhq. Source data
Extended Data Fig. 2
Extended Data Fig. 2. Arginine and proline metabolism expression in primary neuroblastoma patients and cell lines.
a) Differential gene expression between MYCN-amplified and non-amplified primary human neuroblastomas. Genes related to arginine, proline and glutamine metabolism are denoted in red, MYCN in black and all other genes in grey. b) More detailed schematic of gene expression levels of enzymes across arginine, proline and glutamine metabolism with the color of each gene label indicating relative expression (MYCN-amplified/non-amplified). c) Heatmap of gene expression from genes related to arginine, proline and glutamine metabolism according to MYCN status. d) MYCN transcriptional signatures from gene expression associate with metabolite levels of the arginine and proline metabolic pathways. Data from metabolome profiling of n = 180 cancer cell lines. e) MYCN expression across neuroblastoma cell lines, colored by MYCN amplification status. Cell lines selected for xenografts are depicted by their name (Extended Data Fig. 1d). CHLA90, not in this dataset, is a MYCN non-amplified line. f) Relative expression of solute carrier group members (SLC) according to MYCN amplification status across neuroblastoma cell lines from Harenza et al. Proline transporters are highlighted in red. g) Proline transporter expression identifies SLC6A15 as the primary proline transporter and its upregulation in relation to MYCN amplification status in neuroblastoma cell lines. h) Expression of the proline transporter SLC6A15 across paediatric cancer cell lines highlights its expression across paediatric cancers. The center line represents the median, the box spans the interquartile range (IQR; 25th to 75th percentiles), and whiskers extend to 1.5I QR. Data points beyond this range are shown as outliers (solid black). n = 1-28 per cancer. Graphs a-c display primary neuroblastoma expression data. MYCN-amplified n = 93, Non-amplified n = 551. Graphs e, f and g display neuroblastoma cell line expression data. MYCN-amplified n = 27, Non-amplified n = 13. Source data
Extended Data Fig. 3
Extended Data Fig. 3. Direct metabolite contributions across organs and turnover flux in the Th-MYCN model.
a) Direct contributions of circulating nutrients to proline, arginine, ornithine and glutamine across organs and neuroblastoma tumors under a normal chow diet. Contributions derived from [U-13C]-labelled tracer infusions as given in the legend, complementing Fig. 1c. Mean ± s.e.m. b) Oral application of labeled nutrients identifies the dietary precursors of circulating metabolites. Gavage with [U-13C]arginine, proline and glutamine at a dose of 1/3 of a daily consumption of the respective amino acids. The graph indicates fractional labeling in the serum of related polyamine related metabolites over time in mice fed a normal chow diet. Mean ± s.e.m., n = 6. c) Circulatory serum turnover flux, Fcirc of proline, arginine, ornithine, glutamine and glucose under normal chow. Mean ± s.e.m., proline n = 4, arginine n = 8, ornithine n = 6, glutamine n = 9, glucose n = 4. d) Whole-body flux model of interconversion between sources of circulating proline, ornithine, arginine, glutamine and glucose in nmol C/min/g under normal chow. Mean fluxes above 1 nmol C/min/g are displayed. e) Circulatory serum turnover flux under a proline and arginine-free diet, Fcirc of proline, arginine, ornithine and glutamine. Mean ± s.e.m., proline n = 5, arginine n = 3, ornithine n = 3, glutamine n = 5. f) Whole-body flux model of interconversion between sources of circulating proline, ornithine, arginine and glutamine in nmol C/min/g under a ProArg-free diet. Mean fluxes above 1 nmol C/min/g are displayed. g) In vivo stable isotope tracing-based assessment of circulating precursors to intratumoral metabolites in Th-MYCN mice fed a ProArg-free diet. Labeling is given normalized to the serum of each infused [U-13C]metabolite. Mean ± s.e.m. Tracing: Proline serum n = 5, tumor n = 5; Glutamine serum n = 4, tumor n = 4; Arginine serum n = 3, tumor n = 3; Ornithine serum n = 3, tumor n = 3. h) Direct contributions of circulating nutrients in neuroblastoma tumors under a ProArg-free diet. Contributions derived from [U-13C]-labelled tracer infusions complementing Fig. 1h. Mean ± s.e.m., serum and tumor. i) Oral gavage of stable isotope tracing elucidates the dietary precursors of circulating metabolites. Gavage with [U-13C]proline bolus and fraction contribution labeling in the serum of related amino acids and polyamine precursor ornithine in mice fed a ProArg-free diet prior. Mean ± s.e.m., n = 6. j) Intestinal proline to ornithine conversion doubles in mice fed a ProArg-free diet, reaching more than 20% serum ornithine enrichment after a [U-13C]proline feed. A ProArg-free diet is used to minimize non-labelled proline flux from interconversion to ornithine. Mean ± s.e.m., n = 6. k) Putrescine labeling in tumor indicates contribution from ornithine infusion after 5 h. Normalized labeling from infusion under a normal chow and ProArg-free diet. Mean ± s.e.m., Chow n = 4; ProArg-free n = 3. l) Putrescine labeling in tumor indicates contribution from putrescine infusion after 5 h. Normalized labeling from infusion under a normal chow diet. Mean ± s.e.m. n = 7. Abbreviation: Small int., small intestine; ProArg-free, proline and arginine free. Panel b created in BioRender. Morscher, R. (2025) https://BioRender.com/5p7gqdc. Source data
Extended Data Fig. 4
Extended Data Fig. 4. Effect of proline and arginine amino acid depletion combined with DFMO treatment on MYCN-driven neuroblastoma in vivo.
a) Tumor weight at death in grams for the respective treatment groups. b) Delayed tumor growth as shown by time to palpable tumor onset across all treatment arms. c) Mouse weight at death in grams, adjusted for tumor weight.d) Tumor weight at death in grams, adjusted for mouse weight. e) Kaplan-Meier curve of tumor-free survival in the Th-MYCN model. Treatment groups undergo diet change at day 21 and DFMO treatment via drinking from day 0 and encompass either diet change alone (CD, Pro-free, Arg-free and ProArg-free) or their combination with DFMO. Related to Fig. 2, single amino acid depletion added. f) Tumor growth defined as tumor weight at death normalized by day of life in the single amino acid trial. Mean ± s.e.m. g) Mouse weight under arginine or proline single amino acid free diets compared to combined ProArg-free diets (also in c). h) Tumor weight at sacrifice after late-stage treatment start in the Th-MYCN model (palpable abdominal tumors). Treatment was limited to 14 days after which the mice were sacrificed to obtain tumor weight as primary endpoint. i) Number of mice that were sacrificed before endpoint. In the CD treatment group, four mice died before reaching 14 days, compared to only 1 in ProArg-free-DFMO group. For a, c, d, f g and h: two-tailed t-test compared to CD. *P < 0.05, **P < 0.01, ***P < 0.001, ****P < 0.0001. 0.0007. Mean ± s.e.m. For e: Log-rank test p-value compared to CD. For a-g Th-MYCN model, related to Fig. 2: CD n = 13, CD DFMO n = 14, ProArg-free n = 13, ProArg-free DFMO n = 14, Arg-free n = 14, Arg-free n = 15, Pro-free n = 15, Pro-free DFMO n = 15. For h-i Delayed treatment Th-MYCN model: CD n = 11, CD DFMO n = 10, ProArg-free n = 10, ProArg-free DFMO n = 9. Abbreviations: CD treatment, control diet; Pro, proline; Arg, arginine; Free, diet free; DFMO, difluoromethylornithine. Source data
Extended Data Fig. 5
Extended Data Fig. 5. Metabolite profiles of serum and tumors under dietary proline and arginine depletion and/or difluoromethylornithine (DFMO) treatment.
a) Heatmap of significantly changed serum metabolites compared to control diet (CD). Metabolites are selected if significantly changed (q < 0.05) in any of the 3 comparisons: Diet effect (ProArg-free vs. CD), DFMO Monotherapy (CD DFMO vs. CD) and Combined Treatment (ProArg-free DFMO vs. CD). Unsupervised clustering performed using Ward’s method. For each intervention, individual mice are displayed relative to the average level in 7 CD mice. n = 7-10. b-c) Differential serum metabolite levels in DFMO Monotherapy and Combined Treatment. Blue highlights metabolites that are significantly depleted (FDR < 0.05) and shades of red up regulated in the treatment group compared to CD. n = 7-10. d) Tumor levels of arginine, proline, glutamine and ornithine, compared to CD. n = 5-6 e) Tumor levels of proline related metabolites dipeptide glycol-l-proline and hydroxyproline, compared to CD. n = 5-6. f) Tumor levels of acetylated polyamines, compared to CD. n = 4-6. g) Comparison of polyamine levels in tumor tissue upon combining DFMO with diet changes or the polyamine uptake inhibitor AMXT1501. Zooms display differences in polyamine levels between ProArg-free DFMO and AMXT1501 DFMO. Mean ± s.e.m.,Double Diet Amino Acids n = 4-5. Uptake inhibition n = 8-10. h) Tumor amino acid and ornithine levels in different diets and DFMO co-treatment. ProArg-free combined amino acid depletion enhances ornithine depletion in tumor tissue compared to a single amino acid (Pro-free and Arg-free) diet. Mean ± s.e.m., n = 5-12. i) Tumor polyamine levels upon diet change and combination with DFMO show enhanced depletion only in the combined ProArg-free diet and not in the single amino acid depletion arms. Mean ± s.e.m., n = 4-5. For a-f: metabolomics was performed on prolonged treatment tumors (average sacrifice at 12 weeks in all arms). d-i: *P < 0.05, **P < 0.01, ***P < 0.001, ****P < 0.0001, two-tailed t-test. Mean ± s.e.m. Technical replicates are averaged for each mouse. Abbreviations: CD, control diet; ProArg-free, proline and arginine-free diet; DFMO, difluoromethylornithine; Pro-free, proline-free diet; Arg-free, arginine-free diet. Source data
Extended Data Fig. 6
Extended Data Fig. 6. Polyamine depletion causes codon specific translation defects.
a) eIF5A hypusination defects detected by isoelectric focusing followed by immunoblotting. Tumors of ProArg-free and CD DFMO arms, showing defective hypusination in only two CD DFMO tumors and five ProArg-free DFMO tumors. Neuroblastoma cell line IMR5 as negative control (PC1), not treated with DFMO, and positive control (PC2), treated for five days with 500 uM of DFMO. Stars denote tumors with a non-hypusinated eIF5A (eIF5A-K47acetyl) band compared to hypusinated band (eIF5A-hyp). b) Neuroblastoma cell line IMR5 (used as positive control in other panels) treated with increasing DFMO concentrations for five days and assessed by immunoblotting with an anti-hypusine antibody. c) eIF5A hypusination defects detected by immunoblotting. Tumors of ProArg-free DFMO show partially reduced hypusination. IMR5 (C1) and CHLA20 (C2) were added as negative controls for comparison to incomplete hypusination. d) Quantification of hypusination by isoelectric blots reported in a) and immunoblots reported in b). Mean ± s.e.m. *P < 0.05, **P < 0.01, ***P < 0.001, ****P < 0.0001, two-tailed t-test. n = 7-8 per group. e) Validation of isoelectric blots bands. IMR5 protein lysates treated with 500 uM DFMO for 5 days. In a single IEF gel, these 3 lysates were run in triplicate, the membrane cut, and independently probed without stripping, using anti-eIF5A (detecting all forms), anti-hypusine (detecting only hypusinated eIF5A), and anti-eIF5A-K47 acetyl (detecting only K47-acetylated forms). f) Schematic of eIF5A hypusination via DHPS using spermidine as a substrate. g) Relative ribosome density in relation to proline codons upon Eif5a and Dhps knock down (KD) as compared to short-hairpin control (sh-contrl). The left panels are centered by poly proline tracts and the right by proline codons outside thereof. In Dhps KD, increased occupancy shows at all proline codons independent of the nucleotide three position (e.g. adenosine-ending). Reprocessed and reanalyzed data from Nakanishi et al. n = 2 per group. h) In vitro translation setup of IMR5 neuroblastoma cell lysates that were harvested in log-phase growth. Lysates were co-incubated with in vitro transcribed mRNA fragments encoding a repeat of either 7 instances of CCA or CCG just 5’ upstream of luciferase. Changes in fluorescent intensity thereby reflect the effect of polyamines on the translation of the codon repeats. i) Polyamine supplementation with 1.5 mM spermidine preferentially facilitates translation of CCA codon repeats, as compared to CCG stretches. Relative fluorescence to baseline translation of two independent experiments are shown. j) Translation defects are codon specific. Relative ribosome density on all amino acid codons in combined drug-diet treatment (ProArg-free DFMO vs. CD). First letter of name denotes amino acid followed by the encoding codon. k) The diet effect (ProArg-free vs. CD) in the ribosomal P site is not driven by pausing at arginine and proline amino acid codons. l) DFMO treatment effect (CD DFMO vs. CD) is characterized by ribosome pausing depending on the nucleotide at the codon-three position in ribosome P site. m) Adding a ProArg-free diet to DFMO treatment is characterized by enhanced ribosome pausing depending on the nucleotide identity at the codon-three position in ribosomal P site (ProArg-free DFMO vs. CD DFMO). Boxplot where the center line represents the median, the box spans the interquartile range (IQR; 25th to 75th percentiles), and whiskers extend to 1.5I QR. Data points beyond this range are shown as outliers (solid black). One-way ANOVA. A-ending codons n = 14, T-ending codons n = 16, G-ending codons n = 15, C-ending codons n = 16. n) Increased pausing at A-ending codons when comparing ProArg-free DFMO vs. CD DFMO at the ribosomal P site. j-n shows mean of n = 5. Abbreviations: CD, control diet; ProArg-free, proline and arginine-free diet; DFMO, difluoromethylornithine. Panels f and h created in BioRender. Morscher, R. (2025) https://BioRender.com/sf37unt (f); https://BioRender.com/7ngicj2 (h). Source data
Extended Data Fig. 7
Extended Data Fig. 7. Adenosine-ending codon frequency correlates with translation defects.
a) Top down- and upregulated Reactome pathways in the GSEA analysis on the protein level when comparing the diet-drug combination to the control diet (ProArg-free DFMO vs. CD). b) Fraction of codons ending with respective nucleotide across all Reactome pathways (grey), cell cycle related (blue) and neuronal system (red). c) The fraction of A-ending codons is more divergent than the fraction of G-ending codons in cell cycle related (blue) and neuronal system (red) emphasizing A-ending codon content as a differential metric for regulating translation of these two pathways. d) Enrichment analysis based on the A, T, G or C ending codon fraction per gene. Pathways positively enriched (positive p-adj) have higher A, T, G or C ending fractional enrichment whereas negatively enriched pathways have a lower fraction. e) Across Reactome pathways, increasing enrichment of adenosine-ending codons correlates to downregulation on the protein level when comparing combined diet-drug treatment to control. Enrichment was computed using gene set enrichment analysis, where transcripts are ranked by adenosine-ending codon fraction and proteins by fold change on the protein levels. f) Protein intensity across cell cycle, the most downregulated pathway, where the difference between ProArg-free DFMO and CD is evaluated by protein fold-change on the y axis. Fold change distribution on the right side. g) ProArg-free DFMO and CD DFMO highlighting the additive diet effect on the downregulation of cell cycle proteins. Four top-down regulated proteins were identified in both comparisons. Fold change distribution on the right side. h) Protein intensities across the most upregulated pathway, neuronal system, where the difference between ProArg-free DFMO and CD is evaluated by protein fold-change on the y axis. Fold change distribution on the right side. i) ProArg-free DFMO and CD DFMO highlighting the additive diet effect on the upregulation of neuronal system proteins. Common top-upregulated proteins (log2 fold change >1) were identified in both comparisons. Fold change distribution on the right side. j) Relative codon preference comparing the Itgb3bp gene (CENPR protein) to the whole transcriptome. Percentages above the line highlight a preferential use for encoding the amino acid in CENPR by that specific codon type (red is adenosine ending). k) Relative amino acid codon preference comparing the pathway cell cycle to the whole transcriptome. Marks above the line highlight the preferential utilization of defined codons in the cell cycle genes to encode the same amino acid. l) The relative ribosome pausing sum as the sum of ribosome occupancy ratios of ProArg-free DFMO to CD according to the nucleotide at codon position three in Itgb3bp (CENPR protein). Specific dysfunction in decoding of A-ending codons is observed. m) Relative ribosome occupancy across Itgb3bp (CENPR protein) reveals a dysfunction in decoding adenosine-ending codons. Occupancy ratios were calculated between ProArg-free DFMO and CD. Summed by the nucleotide at codon position three in i). n) Percentage of codons with the respective nucleotide at the ending position in the whole transcriptome. o) Relative pausing sum of Cep57 and Kif2c, where the relative ribosome occupancy ratio between ProArg-free DFMO and CD are summed according to the nucleotide at the codon ending position. Hus1 did not show sufficient coverage. p) Correlation of relative pausing sum with protein levels in the top up and down regulated proteins. The relative ribosome occupancy ratio between ProArg-free DFMO and CD are summed according to the nucleotide at the codon ending position and normalized for gene length. For a, d, f, g, h, i and p: Proteomics ProArg-free DFMO n = 6; CD DFMO n = 6; CD n = 5. For l, m, o, and p: Ribo-Seq n = 5 per group; For b-e, the legend for pathways is shared above. Abbreviation: ‘Respiratory electron transport …’, ‘Respiratory electron transport; ATP synthesis by chemiosmotic coupling, and heat production by uncoupling proteins ‘; NES, Normalized Enrichment Score. Source data
Extended Data Fig. 8
Extended Data Fig. 8. Downregulated cell cycles proteins identified in vivo contribute to growth reduction in vitro.
a) Heatmap of gene expression from cell cycle genes of interest according to MYCN status highlights their overexpression in MYCN amplified primary tumors (n = 93), as compared to their non-amplified counterpart (n = 551). b) The three cell cycle genes are overexpressed in relation to MYCN status (non-amplified n = 551, amplified n = 93). c) CeNPR, KIF2C and CEP57 show a stage dependent expression profile with an increased expression in high-risk neuroblastoma. Stage 4 special (st4s) was removed for simplicity. Statistical comparison to stage 1. Number of patients per stage: st1 = 152, st2 = 113, st3 = 90, st4 = 211. d) Cell cycle proteins are concomitantly reduced upon ODC1 knock down (KD) using two short hairpin (sh) compared to scramble (SCR) in IMR5 neuroblastoma cell line. e) Relative expression of CENPR upon KD with two independent sh-CENPR to SCR in IMR5 and the confirmation of reduced protein levels on western blot. Mean ± s.e.m. n = 3 per group. f) Reduction of growth upon CENPR KD with two sh-CENPR constructs as compared to SCR. n = 16 measurements per day per condition. g) Relative expression of KIF2C upon KD with two independent sh-KIF2C as compared to SCR. And the confirmation of reduced protein levels on western blot. Mean ± s.e.m. n = 3 per group. h) Reduction of cell growth upon KIF2C KD compared SCR in the IMR5 neuroblastoma cell line. n = 10 measurements per day per condition. i) Western blot confirming reduced KIF2C and CENPR protein levels upon combined KD with sh-CENPR and sh-KIF2C. j) Cell growth upon combination of CENPR and KIF2C KD. n = 10 measurements per day per condition. k) Schematic of the involvement of the respective cell cycle proteins of interest S to in G2 phase transition as components of the CENPA-CAD complex. After being recruited to centromeres, they are involved in assembly of kinetochore proteins, mitotic progression and chromosome segregation. l) Cell cycle phase distribution as evaluated using flow cytometry of scrambled and combined sh-CENPR and sh-KIF2C KD. m) Concomitantly to a G0-G1 increase upon combined knock down of CENPR and KIF2C S-phase is decreased. Statistical comparison to SCR. Mean ± s.e.m. n = 3 per group. n) Decoupling hypusination dependent and independent polyamine effects. Inhibition of polyamine dependent hypusination via genetic knock down of Dhps combined with intracellular polyamine depletion by 20%ProArg media with 500uM DFMO. In neuroblastoma putrescine supplementation (100uM) rescues growth rates and protein levels as demonstrated by immunoblotting without rescuing hypusination of eIF5a. Mean ± s.e.m. n = 19-20 per group. Abbreviations: sh, short hairpin; ODC1, ornithine decarboxylase 1; KD, knock down; SCR, scramble; Pro, proline; Arg, arginine; DFMO, difluoromethylornithine. For b and c: Boxplot where the center line represents the median, the box spans the interquartile range (IQR; 25th to 75th percentiles), and whiskers extend to 1.5 IQR. Data points beyond this range are shown as outliers (solid black). For b, c, m and n: two-tailed t-test; *P < 0.05, **P < 0.01, ***P < 0.001, ****P < 0.0001. Panel k created in BioRender. Morscher, R. (2025) https://BioRender.com/u25yr73. Source data
Extended Data Fig. 9
Extended Data Fig. 9. Targeting metabolic dependencies of translation affects hallmarks of cellular regulation.
a) Immunohistochemistry showing Ki67 (proliferation marker) of representative Th-MYCN tumors. Arrows denote cells in areas with local cytodifferentiation. b) Hallmark gene set enrichment across omics layers. Displayed is the full gene set tested across each treatment group CD DFMO, ProArg-free and combined ProArg-free DFMO compared to CD. The top 5 significantly changed gene sets on protein level are highlighted in bold. Point size denotes the significance level and the color scale the normalized enrichment score (NES), with red showing enrichment in the intervention group (CD DFMO, ProArg-free or ProArg-free DFMO) and blue in CD. c) Western blot analysis of MYCN in tumors from CD DFMO and ProArg-free treatment arms. Control 1(C1) is CHLA20, NB cell line with MYC amplification (no MYCN expressed) C2 is control IMR5, NB cell line with MYCN amplification and high expression. d) Combined diet-drug treatment disrupts the MYCN-driven super enhancer core regulatory circuitry on the transcript expression (square), and the protein level (ellipsoid). Similarly, other elements of the core regulatory circuitry are affected. e) Combined diet-drug treatment disrupts the MYCN-driven super enhancer adrenergic and retino-sympathetic regulatory circuitry on the transcript expression (square), and the protein level (ellipsoid). f) The polyamine biosynthetic pathway with targets reported to be regulated by MYCN on the transcriptional level highlighted by red arrows. g) Regulation of core polyamine biosynthesis pathway members given by fold change across the omics layers. Despite MYCN loss on the protein level, core targets including AMD1 (RNA level) and ODC1 (protein level) are upregulated. Others are broadly unchanged. h) Levels of enzymes in polyamine biosynthesis across treatment groups. Adjusted p-value is from the comparison between CD and ProArg-free DFMO. i) Western blot analysis of neuroblastoma cell line IMR5 treated with 5 uM MYCi975 for four days show downregulation of MYCN, no change of ODC1 and eIF5A hypusination. j) The mouse orthologue for TP53, TRP53 and its core regulator MDM2 are unchanged across all four treatment groups in the Th-MYCN neuroblastoma tumors (CD, CD DFMO, ProArg-free or ProArg-free DFMO). k) Ribosome density along the TRP53 coding sequence normalized to CDS mean. Insert highlights the proline rich region with no signs of ribosome stalling at the respective proline codons in the ProArg-free DFMO combination treatment. For c, d and e RNA-Seq: CD DFMO, ProArg-free and ProArg-free DFMO n = 5; CD n = 4, Ribo-Seq: n = 5 per group, Proteomics: CD DFMO, ProArg-free and ProArg-free DFMO n = 6; CD n = 5. For h and j: Boxplot where the center line represents the median, the box spans the interquartile range (IQR; 25th to 75th percentiles), and whiskers extend to 1.5 IQR. Data points beyond this range are shown as outliers (solid black). CD DFMO, ProArg-free and ProArg-free DFMO n = 6; CD n = 5. Abbreviations: CD, control diet; ProArg-free, proline arginine free diet; DFMO, difluoromethylornithine; c-d: Reprocessed and reanalyzed data from Elkon et al. n = 2 per group. e and f: Reprocessed and reanalyzed data from Volegova et al. n = 2 per group. b,i and j: Data generated as part of this study. n = 3 per group. Source data
Extended Data Fig. 10
Extended Data Fig. 10. Proline and arginine amino acid depletion effect with DFMO in human xenografts in vivo.
a) Blinded histological assessment by a pathologist of differentiation status and abundance of neuropil status in tumor sections (linked to Fig. 6c) in Th-MYCN mice. n = 6 per group. b) Schematic of xenografts induced in nude mice by the MYCN-amplified human neuroblastoma cell line IMR5. Upon reaching 200 mm3 mice were randomized to receive either a CD or ProArg-free diet with or without DFMO drug application via the drinking water (1 %). c) Tumor volume of individual xenografts in mice across treatment groups. d) Average neuroblastoma xenograft tumor volume according to the four treatment groups CD, CD DFMO, ProArg-free and ProArg-free DFMO. Upon reaching the maximal tumor volume in an individual tumor (2 cm3) this measurement was counted towards the mean until death of the last mouse in this group. Mean ± s.e.m. e) Example of neuroblastoma tumor regression in a ProArg-free DFMO treated mouse (day 77 compared to day 100). f) Kaplan-Meier survival curve related to b) with death encoded for human endpoints or tumor volume above 2 cm3. g) Mouse weight corrected for tumor weight across time after engraftment of IMR5 xenografts. h) qPCR quantification of MYCN and ODC1 gene expression in IMR5 xenograft tumors across treatment groups. n = 7-8 per group. Mean ± s.e.m. i) Western blot analysis of MYCN and the DFMO target ODC1 and in IMR5 xenograft tumors after treatment. j) Proliferation rate as assessed by immune histochemistry staining (Ki67 staining) on tumor sections of the four treatment groups. Data acquired by a pathologist blinded to treatment groups. k) Differentiation status according to clinical-diagnostic standards and scoring for neuropil abundance in H&E-stained histology sections derived from the IMR5 intervention trial. Data acquired by a pathologist blinded to treatment groups. Abbreviations: CD, control diet; ProArg-free, proline arginine free diet; DFMO, difluoromethylornithine. For b-h IMR5 xenograft model: CD n = 11, CD DFMO n = 13, ProArg-free n = 12, ProArg-free DFMO n = 12. For f: Log-rank test p-value compared to CD. *P < 0.05, **P < 0.01, ***P < 0.001, ****P < 0.0001. For h: two-tailed t-test compared to CD. *P < 0.05, **P < 0.01, ***P < 0.001, ****P < 0.0001. Panel b created in BioRender. Morscher, R. (2025) https://BioRender.com/sd1cd2k. Source data

Update of

References

    1. Matthay, K. K. et al. Neuroblastoma. Nat. Rev. Dis. Primers2, 16078 (2016). - PubMed
    1. Pinto, N. R. et al. Advances in risk classification and treatment strategies for neuroblastoma. J. Clin. Oncol.33, 3008–3017 (2015). - PMC - PubMed
    1. Elia, I. & Haigis, M. C. Metabolites and the tumour microenvironment: from cellular mechanisms to systemic metabolism. Nat. Metab.3, 21–32 (2021). - PMC - PubMed
    1. DeBerardinis, R. J. & Chandel, N. S. Fundamentals of cancer metabolism. Sci. Adv.2, e1600200 (2016). - PMC - PubMed
    1. Oesterheld, J. et al. Eflornithine as postimmunotherapy maintenance in high-risk neuroblastoma: externally controlled, propensity score-matched survival outcome comparisons. J. Clin. Oncol.42, 90–102 (2024).

MeSH terms

LinkOut - more resources