. 2025 Sep 24;14(1):48.
doi: 10.1186/s40035-025-00508-2.

Reduced synaptic vesicle protein 2A in extracellular vesicles and brains of Alzheimer's disease: associations with Aβ, tau, synaptic proteins and APOE ε4

Affiliations

Reduced synaptic vesicle protein 2A in extracellular vesicles and brains of Alzheimer's disease: associations with Aβ, tau, synaptic proteins and APOE ε4

Jana Nussbaumer et al. Transl Neurodegener. .

Abstract

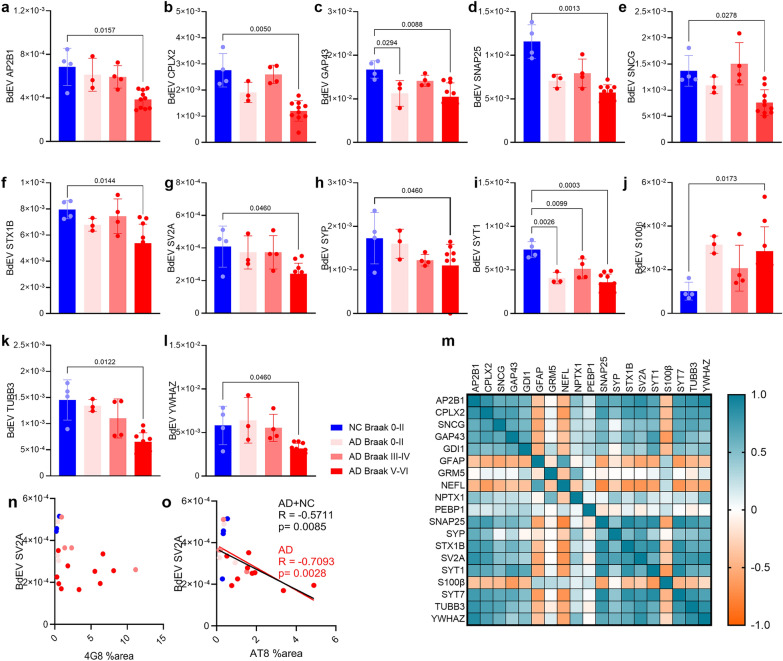
Background: Alzheimer's disease (AD) is characterized by accumulation of amyloid-β (Aβ) plaques, tau neurofibrillary Tangles and synaptic dysfunction. The aim of this study was to map the distributions of synaptic vesicle protein 2A (SV2A) and other synaptic proteins in the brain and the brain-derived extracellular vesicles (BDEVs) of AD patients, analyze their associations with Aβ, tau, and the apolipoprotein E (APOE) ε4 allele, and investigate the biological role of SV2A.

Methods: Mass spectrometry-based proteomics of BDEVs and immunohistochemistry staining were conducted on postmortem brain samples from 57 AD patients and 48 nondemented controls. The levels of SV2A, synaptophysin (SYP), and other synaptic proteins in the brain tissues and the BDEVs, and their associations with Aβ, tau (phospho-tau and Braak stages), other proteins and the APOE ε4 allele, were analyzed.

Results: SV2A levels were significantly lower in AD patients than in nondemented controls, particularly in the hippocampus and entorhinal cortex. APOE ε4 carriers presented further reductions in SV2A levels compared with noncarriers. The SV2A levels in BDEVs and brain tissues were positively correlated with SYP levels and negatively correlated with Aβ and phospho-tau levels. Reductions in SV2A were associated with decreased levels of other synaptic proteins, such as synaptotagmins, GAP43, and SNAP25. SV2A emerged as a central hub with interactions with proteins from subnetworks related to synaptic vesicle formation and fusion.

Conclusion: SV2A levels in brain tissues and BDEVs are reduced in AD patients, particularly in those carrying the APOE ε4 allele, and are correlated with Aβ and tau pathologies. SV2A may serve as a valuable biomarker for monitoring synaptic dysfunction and progression in AD.

Keywords: APOE ε4; Alzheimer’s disease; Amyloid-β; Extracellular vesicles; Proteomics; Synaptic vesicle protein 2A; Synaptophysin; Tau.


Conflict of interest statement

Declarations. Ethics approval and consent to participate: All the autopsied human brain tissue experiments were carried out in accordance with ethical permission obtained from the regional human ethics committee and the medical ethics committee of the VU Medical Center for NBB tissue. The consent for participation was obtained from the NBB, Lille Neurobank and CHUV. Consent for publication: Consent for publication was obtained from NBB, Lille Neurobank and CHUV. Competing interests: CH and RMN are employees and shareholders of Neurimmune AG. The authors declare that they have no conflicts of interest.

Figures

Fig. 1
Fig. 1
Proteomics of BDEVs from AD and NC brains. a Schemetic of experimental flow for brain-derived EV proteomics. b Histogram showing the relative concentrations of particles in the NCs and ADs of different Braak stages. c Histogram showing the relative quantities (rIBAQs) of proteins in the NCs and ADs of different Braak stages. d WGCNA cluster dendrogram and significant modules. el Comparisons of module eigenvalues between NCs and ADs of different Braak stages for mitochondria (e), cell signaling (f), synaptic vesicles (g), ribosomes (h), extracellular vesicle signaling (i), the endoplasmic reticulum (j), axonal transport (k), and proteasomes (l). m Protein‒protein interaction networks for proteins of the WGCNA modules (circles), with additional protein complexes (octagons) and phenotypes (rectangles). Border color indicates the module of the protein, and fill color indicates the r of correlative analysis (Pearson’s correlation; red = positive, r > 0.5; blue = negative, r < 0.5). Lines with different colors indicates different types of interaction (black: unspecified; blue: positive regulation; red: negative regulation; and green: binding). The dashed lines indicate indirect interactions
Fig. 2
Fig. 2
Comparison of cortical BDEV markers between NC and AD brains and correlation analysis. al BDEV levels of AP2B1, CPLX2, GAP43, SNAP25, SNCG, STX1B, SV2A, SYP, SYT1, S100β, TUBB3 and YWHAZ in the NC Braak 0–II, and AD of Braak 0–II, III–IV, and V–VI. m Nonparametric Spearman’s rank analysis of the rIBAQ matrix of correlations in the AD + NC pooled group (detailed P values and r values are provided in Table 2 and supplemental files). no Nonparametric Spearman’s rank analysis revealed a negative correlation between BDEV SV2A and AT8 tau but not with 4G8 Aβ % area in the prefrontal cortex tissue block (including gray and white matter)
Fig. 3
Fig. 3
SV2A and SYP staining in the hippocampus, entorhinal cortex, frontal cortex and temporal cortex of NC and AD APOE ε4 carriers and noncarriers. af, kp Representative images of IHC staining for SV2A (af) and SYP (kp) in the hippocampi of the NC and AD APOE ε4 noncarriers and carriers. Zoomed-in images of the CA1 region and the entorhinal cortex (EC). gj, qt Representative images of IHC staining for SV2A (gj) and SYP (qt) in the frontal cortex (FC) and temporal cortex (TC) of AD patients. Zoom-in images of gray matter (GM) and white matter (WM) in the cortex regions. Scale bars, 50 μm (b, d, f, l, n, p), 100 μm (j, t), and 400 μm (h, r)
Fig. 4
Fig. 4
Reduced SV2A but not SYP levels in the hippocampus and entorhinal cortex of AD patients compared with NCs and associations with the APOE ε4 and Braak stage. a, b, g, h SV2A and SYP levels in the dentate gyrus (DG), CA3/CA2, CA1, and subiculum (Sub) of the hippocampus and the entorhinal cortex (EC) in AD patients compared with those in NCs (SV2A: NC n = 26, AD n = 27; SYP: NC n = 24, AD n = 25) (a, g) and in female and male AD patients and NCs (b, h). c, i Comparison of hippocampal SV2A and SYP levels between NC and AD patients at different Braak stages. d, j SV2A and SYP levels in APOE ε4 carriers and noncarriers of AD and NCs. e, f, k SV2A and SYP levels were higher in the gray matter (GM) than in the white matter (WM) of the frontal cortex (FC) or temporal cortex (TC) (SV2A FC, NC n = 14, AD n = 12; SV2A TC, NC n = 10, AD n = 14; SYP FC, AD n = 5; SYP TC, AD n = 4)
Fig. 5
Fig. 5
SV2A protein level is lower in the presence of amyloid-β plaques (4G8, 6E10) and phospho-tau (AT8) in AD patients than in NCs. a, b Representative overview of 4G8 amyloid-β (brown) IHC staining in the NC and AD groups. cn Representative overview and zoomed-in view of immunofluorescence staining of SV2A (red), 6E10 amyloid-β (green) and AT8 (cyan) in the hippocampi of the NC and AD groups. Nuclei were counterstained with DAPI (white). Core plaque (e), diffuse plaque (f), neuropil thread (k), mature tangle (l), neuritic plaque (m), and ghost tangle (n) in AD brain. Scale bars, 2 mm (ad, gj) and 20 μm (e, f, kn). DAPI: 4′,6-diamidino-2-phenylindole
Fig. 6
Fig. 6
Correlation analysis for SV2A and SYP levels with amyloid-β, Braak stage and tau. ad Negative correlations between 4G8 amyloid-β and SV2A levels in the hippocampus and EC in the AD + NC pooled group. ei Negative correlations of SV2A levels with Braak stage in the hippocampus and EC regions in the AD + NC pooled group. j SV2A and AT8 (phospho-tau) levels were negatively correlated in the subiculum of AD patients. kp Positive correlations between SYP and SV2A levels in different regions in AD patients and NCs. AD; red line, NC; black line, AD + NC. Detailed P and r values are provided in Table S2

References

    1. Jack CR Jr., Andrews JS, Beach TG, Buracchio T, Dunn B, Graf A, et al. Revised criteria for diagnosis and staging of Alzheimer’s disease: Alzheimer’s association workgroup. Alzheimers Dement. 2024;20(8):5143–69. - PMC - PubMed
    1. Kinney JW, Bemiller SM, Murtishaw AS, Leisgang AM, Salazar AM, Lamb BT. Inflammation as a central mechanism in Alzheimer’s disease. Alzheimers Dement (N Y). 2018;4:575–90. - PMC - PubMed
    1. de Wilde MC, Overk CR, Sijben JW, Masliah E. Meta-analysis of synaptic pathology in Alzheimer’s disease reveals selective molecular vesicular machinery vulnerability. Alzheimer’s Dement. 2016;12(6):633–44. - PMC - PubMed
    1. Tzioras M, McGeachan RI, Durrant CS, Spires-Jones TL. Synaptic degeneration in Alzheimer disease. Nat Rev Neurol. 2023;19(1):19–38. - PubMed
    1. Colom-Cadena M, Spires-Jones T, Zetterberg H, Blennow K, Caggiano A, DeKosky ST, et al. The clinical promise of biomarkers of synapse damage or loss in Alzheimer’s disease. Alzheimers Res Ther. 2020;12(1):21. - PMC - PubMed

LinkOut - more resources