. 2025 Sep 3.
doi: 10.1039/d5na00361j. Online ahead of print.

In vitro and in vivo validation studies of optimized iron oxide nanoparticles carrying targeting ligands for a new therapeutic strategy in head and neck cancers

Affiliations

In vitro and in vivo validation studies of optimized iron oxide nanoparticles carrying targeting ligands for a new therapeutic strategy in head and neck cancers

Sonia Furgiuele et al. Nanoscale Adv. .

Abstract

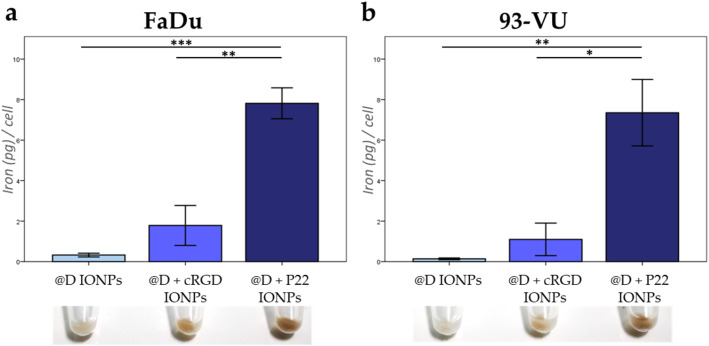
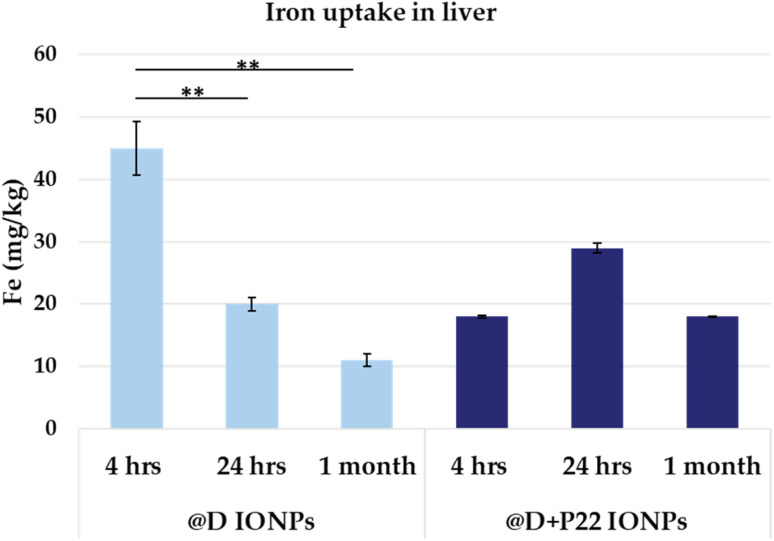
Iron oxide nanoparticles (IONPs) are increasingly used in the biomedical field. Indeed, they can improve patient diagnosis, as they are excellent T 2 contrast agents for magnetic resonance imaging (MRI), and they can be considered a therapeutic and radiosensitizing agent for cancer by influencing the redox balance. However, to achieve specific accumulation of nanoparticles in the tumor, active targeting with specific ligands is required. In this context, we have developed IONPs that would specifically target head and neck cancer (HNC) cells. First, we optimized IONP synthesis and produced dendronized IONPs that were coupled with the targeting ligand cRGD (@D + cRGD IONPs) or peptide 22 (@D + P22 IONPs). The former is a tripeptide with affinity for integrins while the latter is a dodecapeptide analog of GE11, an EGF (epidermal growth factor) derived polypeptide with affinity for EGFR. EGFR is overexpressed in these HNC cells. Next, we highlighted the interest of using @D + P22 IONPs in order to enhance internalization of IONPs in vitro. Furthermore, we evaluated the biodistribution of IONPs in vivo and showed by MRI an immediate T 2 contrast in the liver and kidney, whatever the type of IONP. Finally, we developed an in vivo model of mice with FaDu xenografts and showed by MRI a tendency for higher accumulation of @D + P22 IONPs (10.1% decrease of T 2 calculated in the tumoral region by measurement) compared to @D IONPs (0.15%) within the tumors. These preliminary results are encouraging and require further investigations, but they suggest the potential interest of using this IONP model for targeting EGFR-positive tumors.


Conflict of interest statement

There are no conflicts to declare.

Figures

Fig. 1
Fig. 1. Molecular structure of dendron D1-2P-CO2H from SuperBranche® (Strasbourg, France).
Fig. 2
Fig. 2. Evaluation of EGFR expression in 6 HNC cell lines. (a) Confocal microscopy images of EGFR [MA5-13269] in red, and nuclei were stained with DAPI in blue. (b) Western blot analysis (left panel) and quantification (right panel) of EGFR in the 6 lines. Molecular weight markers confirm an EGFR band at 170 kDa and actin band at 42 kDa. Specificity of the detection method was validated during the experimental phase by including a melanoma line lacking EGFR (MM074, negative control) and a breast cancer line known to overexpress EGFR (MDA-MB-231, positive control), although these data are not shown here. One-way ANOVA and a Tukey post hoc test were conducted; *p < 0.05; **p < 0.001; ***p < 0.001; the results present the means ± SD from three independent experiments.
Fig. 3
Fig. 3. Iron content in HNC cell lines by Perls' Prussian blue colorimetric method. (a) FaDu and (b) 93-VU cells exposed for 24 h to 50 μg mL−1 of @D IONPs, @D + cRGD IONPs or @D + P22 IONPs. One-way ANOVA and a Tukey post hoc test were performed; *p < 0.05; **p < 0.001; ***p < 0.001; the results present the means ± SD from three independent experiments. Representative examples of cell pellets containing dark NPs under each experimental condition are given.
Fig. 4
Fig. 4. Confocal microscopy images of IONP intracellular localization in HNC cell lines. FaDu and 93-VU cells were exposed for 24 h to 50 μg mL−1 of (a) @D IONPs or (b) @D + P22 IONPs, scale = 10 μm. Four different pictures were presented for each condition. (c) Confocal 3-dimensional acquisition from the bottom to the top of the FaDu cell line exposed for 24 h to 50 μg mL−1 of @D + P22 IONPs, scale = 20 μm. Nuclei were stained with DAPI in blue, IONP clusters with anti-PEG in green and EGFR with anti-EGFR [MA5-13070] in red.
Fig. 5
Fig. 5. Evaluation of apoptosis in HNC cell lines induced by IONPs detected using a Muse® cell analyzer. FaDu and 93-VU cell lines were cultured for 24 h with 50 μg mL−1 of @D IONPs or @D + P22 IONPs. (a) Four populations of cells can be distinguished in this assay: non-apoptotic cells (live cells); early apoptotic cells; late stage apoptotic and dead cells (mostly nuclear debris). (b) Graphs represent the percentage of total apoptosis under each condition (CTL−, nontreated cells). The results were given for three independent experiments and present means ± SD. Statistical analysis did not reveal significant differences.
Fig. 6
Fig. 6. ROS evaluation after HNC cell lines were exposed to 50 μg mL−1 of @D IONPs or @D + P22 IONPs for 24 h. (a) Two populations can be distinguished on the graph: ROS-negative (in blue) and ROS-positive (in red) cells. (b) Graphs represent the percentage of ROS+ cells for the two cell lines when exposed to the two IONP types compared to the nontreated cells (CTL−). The results were obtained from three independent experiments and present means ± SD. Statistical analysis did not reveal significant differences.
Fig. 7
Fig. 7. Illustration of in vivo MRI data in T2 contrast of mice treated with 45 μmol Fe per kg of @D IONPs or @D + P22 IONPs. Follow up of (a) liver, (b) bone marrow and (c) kidney pre-injection and at different timings as specified in the scans (D = day, W = week, and M = month). A blue arrow points at (or a green square surrounds) the area in which a change in contrast is observed.
Fig. 8
Fig. 8. Iron uptake measured by ICP-AES analysis of livers of healthy mice (at least 3 mice per condition) 4 h, 24 h and 1 month after intravenous injection of IONPs. One-way ANOVA and the Tukey post hoc test were conducted; **p < 0.01; the results present the means ± SD from three independent experiments.
Fig. 9
Fig. 9. Illustration of in vivo MRI data of mice with tumors treated with 60 μmol Fe per kg of (a) @D IONPs (N = 2) or (b) @D + P22 IONPs (N = 4) at pre-injection, 1 h 45 min and one day after injection. A dotted circle surrounds the area in which the ROI measurement was performed.
Fig. 10
Fig. 10. Iron uptake measured by ICP-AES analysis of tumors of mice 24 h after intravenous injection of @D IONPs (N = 3) or @D + P22 IONPs (N = 4). Statistical analysis did not reveal significant differences.
Fig. 11
Fig. 11. Confocal microscopy images of IONP localization in the liver and tumor of mice (a) without injection of IONPs, (b) with 60 μmol Fe per kg of @D IONPs and (c) with 60 μmol Fe per kg of @D + P22 IONPs, scale = 5 μm. Four pictures were presented for each condition. Nuclei were stained with DAPI in blue, IONP clusters with anti-PEG in green and EGFR with anti-EGFR [MA5-13070] in red.

References

    1. Gao X. Wang S. Tian Z. Wu Y. Liu W. A Bibliometric Analysis on Studies of Nanomedicine Applications in Head and Neck Squamous Cell Carcinoma. Transl. Cancer Res. 2021;10:251–260. doi: 10.21037/tcr-20-2852. - DOI - PMC - PubMed
    1. Ferlay J. Colombet M. Soerjomataram I. Mathers C. Parkin D. M. Piñeros M. Znaor A. Bray F. Estimating the Global Cancer Incidence and Mortality in 2018: GLOBOCAN Sources and Methods. Int. J. Cancer. 2019;144:1941–1953. doi: 10.1002/ijc.31937. - DOI - PubMed
    1. Du E. Mazul A. L. Farquhar D. Brennan P. Anantharaman D. Abedi-Ardekani B. Weissler M. C. Hayes D. N. Olshan A. F. Zevallos J. P. Long-Term Survival in Head and Neck Cancer: Impact of Site, Stage, Smoking, and Human Papillomavirus Status. Laryngoscope. 2019;129:2506–2513. doi: 10.1002/lary.27807. - DOI - PMC - PubMed
    1. Mitchell M. J. Billingsley M. M. Haley R. M. Wechsler M. E. Peppas N. A. Langer R. Engineering Precision Nanoparticles for Drug Delivery. Nat. Rev. Drug Discovery. 2020:1–24. doi: 10.1038/s41573-020-0090-8. - DOI - PMC - PubMed
    1. Blanco-Andujar C. Walter A. Cotin G. Bordeianu C. Mertz D. Felder-Flesch D. Begin-Colin S. Design of Iron Oxide-Based Nanoparticles for MRI and Magnetic Hyperthermia. Nanomedicine. 2016;11:1889–1910. doi: 10.2217/nnm-2016-5001. - DOI - PubMed