. 2025 Sep 10:16:1625472.
doi: 10.3389/fphar.2025.1625472. eCollection 2025.

Nanoparticle-induced systemic toxicity and immune response in Galleria mellonella larvae

Affiliations

Nanoparticle-induced systemic toxicity and immune response in Galleria mellonella larvae

Kusal Shasheen Payoe et al. Front Pharmacol. .

Abstract

Introduction: Nanotechnology is one of the most rapidly advancing scientific fields, offering innovative solutions in diverse areas such as medicine, agriculture, and materials science. However, concerns regarding the environmental and biological toxicity of nanomaterials continue to rise. It is thus essential to develop reliable, ethical, and cost-effective models to assess the in vivo toxicity of Nanoparticles (NPs). This study aims to evaluate the immunotoxicity and systemic effects of various inorganic nanoparticles using Galleria mellonella (GM) larvae as a non-mammalian in vivo model.

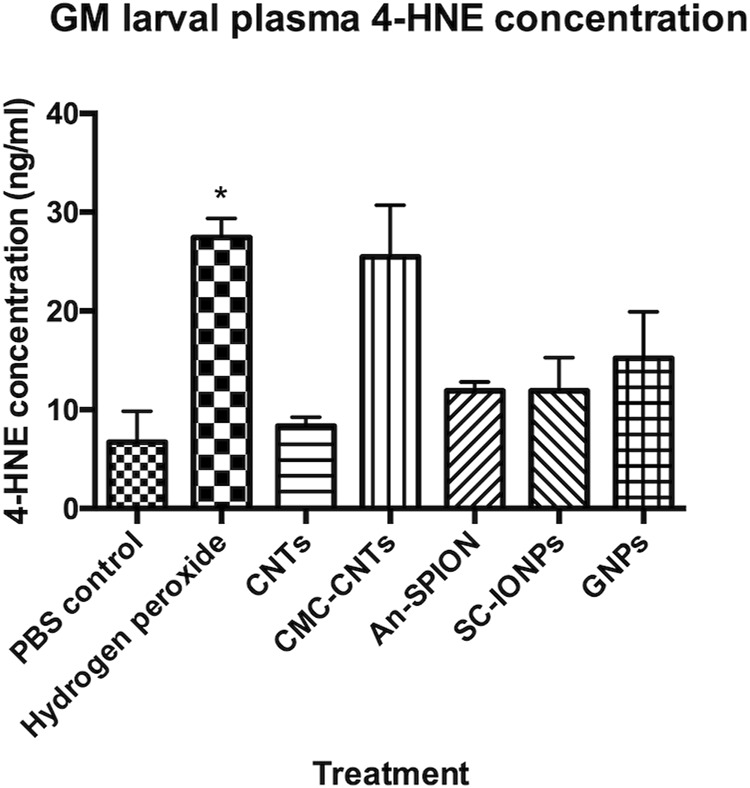
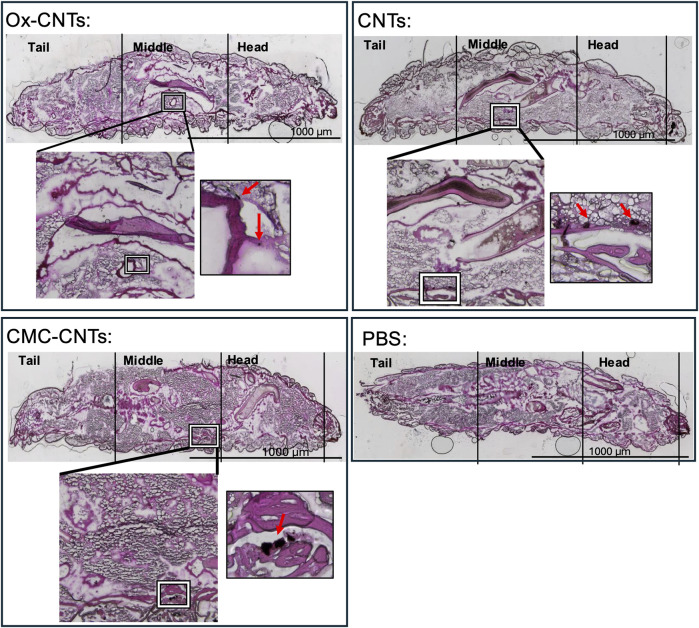
Methods: GM larvae were exposed to different types of NPs, including starch-coated and anionic superparamagnetic iron oxide nanoparticles (SPIONs), double-walled carbon nanotubes (CNTs), and gold nanoparticles (GNPs). Flow cytometry was used to monitor haemocyte numbers, while larval survival assays assessed mortality. Histological analyses were conducted to detect CNT accumulation in tissues. The immunosuppressive effects of GNPs were assessed in GM larvae challenged with sub-lethal doses of Pseudomonas aeruginosa and Acinetobacter baumannii.

Results: The results demonstrate NP retention in GM tissues and showed that surface and size properties of NPs significantly influenced their biological effects. Anionic SPIONs lacking a starch coating caused greater haemocyte depletion and higher mortality than their biocompatible coated counterparts. GNP toxicity was found to be size-dependent, with particles between 60 and 100 nm producing the most severe haemocyte depletion, which was comparable to that obtained with the immune suppressant cyclophosphamide.

Conclusion: Overall, this study supports the use of GM larvae as an effective model for nanoparticle toxicity screening and demonstrates the usefulness of this model in detecting both toxic and immunosuppressive properties of nanomaterials.

Keywords: Galleria mellonella; haemocytes; immunosupression; in vivo toxicity; infection; nanoparticle uptake.


Conflict of interest statement

The authors declare that the research was conducted in the absence of any commercial or financial relationships that could be construed as a potential conflict of interest. The author(s) declared that they were an editorial board member of Frontiers, at the time of submission. This had no impact on the peer review process and the final decision.

Figures

FIGURE 1
FIGURE 1
Flow cytometry density plot charts, representing the events/cells gathered from PBS control larvae. (A) Cellular debris is eliminated by the forward scatter/side scatter gating method. (B) In addition, aggregated cells are identified due to their high side scatter and are eliminated to only obtain individual cells. (C) All events/cells that are positive for the nuclear acid stain (PI) are visualised. (D) The polygon gate is applied to the PI positive events to confirm cellular debris elimination.
FIGURE 2
FIGURE 2
CTX induced immunosuppression in GM-larvae. GM larvae were injected with 147 mg/kg of the immunocytotoxic drug CTX. (A) Haemolymph was extracted after 24 h to numerate total circulating haemocyte counts (THC) by flow cytometry. THC was reduced by 46% compared to PBS controls (n = 3 independent experiments). Error bars show standard deviation. Asterixis represent statistically significant differences in THC in unpaired t-test (∗∗∗∗: p-value <0.0001). (B) GM larval survival was assessed over 72 h. CTX treatment induced a mild (4%) but significant (p < 0.05) toxic effect on the larvae (n = 3 independent experiments with >45 larvae per condition). Asterisks represent a statistically significant difference in larval survival, when compared to the relevant control, in a Log-Rank (Mantel- Cox) test (∗: p-value <0.05).
FIGURE 3
FIGURE 3
Larval survival analysis to determine in vivo toxicity of NPs. Kaplan-Meier survival curves, presenting percentage survival of GM larvae over 72 h after injection of NPs, n ≥ 45 larvae per condition with n = 3 independent experiments. Asterisks represent a statistically significant difference in larval survival, when compared to the relevant control, in a Log-Rank (Mantel- Cox) test (∗∗: p-value <0.01; ∗∗∗∗: p-value <0.0001). (A) Survival of larvae injected with 15 mg/kg SPIONs (starch-coated and anionic charged) was assessed in controls (PBS injected) and immunosuppressed (CTX-treated) larvae. (B) Percentage survival of GM larvae after injection with 10 mg/kg CNTs (oxidised, unmodified and CMC-coated) in controls (PBS injected) and immunosuppressed (CTX treated). (C) Percentage survival of GM larvae after injection with 5.6 mg/kg GNPs of differing sizes (20, 60 and 100 nm) in controls (PBS injected) and immunosuppressed (CTX-treated) larvae.
FIGURE 4
FIGURE 4
Flow cytometric analysis of isolated larval haemocytes to determine Total Haemocyte Count. Graphs presenting mean GM larval THC content per microlitre +/− SD for (A) SPIONs, (B) CNTs and (C) GNPs, in both the control and after treatment with CTX for 24 h prior to injection of NPs. THC was measured via flow cytometry analysis 24 h post-NP injections. Controls were injected with only PBS. Asterisks represent a statistically significant difference when compared to the relevant control, in an unpaired t-test (∗: p-value <0.05; ∗∗: p-value <0.01; ∗∗∗: p-value <0.001; ∗∗∗∗: p-value <0.0001). Results from n = 3 independent experiments are shown. Flow cytometric analysis was carried out on duplicate samples from each sample.
FIGURE 5
FIGURE 5
4-HNE-ELISA measuring generation of ROS in vivo. Graph presenting larval plasma 4-HNE concentrations (ng/mL), measured in plasma samples acquired from groups of larvae, 24 h post-larval injections with either SC-SPIONs or An-SPION, 100 nm GNPs, CNTs and CMC-CNTs. The figure presents mean concentration ±SD of two independent experiments, assayed in duplicate and normalised to protein content. Asterisks represent statistically significant difference when compared to the PBS control, in an unpaired t-test (∗: p-value <0.05)
FIGURE 6
FIGURE 6
Uptake of NPs into GM haemocytes 24 h post-injection. Haemocytes isolated from plasma samples from larvae injected with 15 mg/kg SC-SPION were fixed and stained with AlexaFluor546-labeled WGA to reveal the plasma membrane (red). The nucleus was stained with Hoechst 33342 (blue). (A) single confocal section is shown, scale bars 10 μm. (y and x) orthogonal views of the same confocal image taken at the lines indicated in (A) demonstrate uptake of fluorescent SC-SPION (green, arrows). (B) Brightfield images of haemocytes isolated from larvae treated with 10 mg/kg CNT show altered morphology compared to control haemocytes and are clustered around CNTs (dark spots, arrows). (C) Brightfield images of haemocytes isolated from GNP injected larvae (5.6 mg/kg) have similar morphology to control haemocytes. Only larger size GNPs can be seen as dark spots associated with the cells (arrows; scale bar 15 μm). Representative images of n = 3 independent experiments with three biological replicates per experiment are shown.
FIGURE 7
FIGURE 7
Histochemical analysis of larval cryosections showing in vivo CNT accumulation. Histological analysis of CNT distribution 24 h post-injection in GM larvae. H&E stain of 20 μm cryosections along the rostro-caudal axis taken 24 h after injection of 10 mg/kg CNTs. Larvae sections present tail, middle and head. ×4 magnification overview photomicrographs of the injected larva are shown in the coloured bright field (CBF) channel (scale bars 1,000 μm) where the aggregated CNTs are identifiable by their relative darkness (indicated by square). For comparison, an overview photomicrograph of a larva injected with vehicle (PBS) is shown. The zoomed in overlay of the CBF shows ×10 magnification photomicrograph detailing CNT localisation indicated in the square.
FIGURE 8
FIGURE 8
Flow cytometric survival and morphological analysis of isolated larval haemocytes to determine THC and survival after immune challenge. (A) Graph representing changes to GM larval THC, induced by CTX, P Aeruginosa PA14 and 60 nm GNP treatments either alone or in combination. (B) Graph representing changes to GM larval THC, induced by CTX, A Baumannii AB5075 and 60 nm GNP treatments either alone or in combination. THC was measured via flow cytometry analysis, 24 h post-bacterial inoculations in duplicates. As controls, THC of larvae injected with only PBS, CTX or 60 nm GNPs was measured. Mean THC from three independent experiments +/-SD with three biological replicates are shown. Asterisks represent a statistically significant difference when compared to the relevant control, in an unpaired t-test (∗:p-value <0.05; ∗∗:p-value <0.01; ∗∗∗:p-value <0.001; ∗∗∗∗:p-value <0.0001). (C) Representative Brightfield images of larval haemocytes taken from the same experiments show haemocyte morphology. Scale bars 15 μm. Changes to haemocyte morphology are indicated with white and black arrows. White arrows point to cells with increase appearance of filopodia and clustering. Black arrows point to extracellular material permeating from the haemocytes. (D) Survival of GM larvae treated with CTX, CTX, P Aeruginosa PA14, A Baumannii AB5075 and 60 nm GNPs either alone or in combination was analysed by determining percentage of live/dead larvae 24 h after treatment, n = 3 independent experiments with >45 larvae per condition, error bars show standard deviation.

References

    1. Ambrosi C., Scribano D., Sarshar M., Zagaglia C., Singer B. B., Palamara A. T. (2020). Acinetobacter baumannii targets human carcinoembryonic antigen-related cell adhesion molecules (CEACAMs) for invasion of pneumocytes. mSystems 5, e00604-20. 10.1128/msystems.00604-20 - DOI - PMC - PubMed
    1. Aoki K., Saito N. (2020). Biocompatibility and carcinogenicity of carbon nanotubes as biomaterials. Nanomaterials 10, 264. 10.3390/nano10020264 - DOI - PMC - PubMed
    1. Bortolamiol T., Lukanov P., Galibert A.-M., Soula B., Lonchambon P., Datas L., et al. (2014). Double-walled carbon nanotubes: quantitative purification assessment, balance between purification and degradation and solution filling as an evidence of opening. Carbon 78, 79–90. 10.1016/j.carbon.2014.06.051 - DOI
    1. Bouwmeester H., Brandhoff P., Marvin H. J. P., Weigel S., Peters R. J. (2014). State of the safety assessment and current use of nanomaterials in food and food production. Trends Food Sci. and Technol. 40, 200–210. 10.1016/j.tifs.2014.08.009 - DOI
    1. Campbell J. S., Pearce J. C., Bebes A., Pradhan A., Yuecel R., Brown A. J. P., et al. (2024). Characterising phagocytes and measuring phagocytosis from live Galleria mellonella larvae. Virulence 15, 2313413. 10.1080/21505594.2024.2313413 - DOI - PMC - PubMed

LinkOut - more resources