Review
. 2025 Aug 28;7(5):fcaf309.
doi: 10.1093/braincomms/fcaf309. eCollection 2025.

Sleep deprivation affects memory function, depression and anxiety-like behaviours in rats and mice: a systematic review and meta-analysis

Affiliations
Review

Sleep deprivation affects memory function, depression and anxiety-like behaviours in rats and mice: a systematic review and meta-analysis

Xiaofan Zhang et al. Brain Commun. .

Abstract

Sleep deprivation paradigms have been employed in rat and mouse models to elucidate the function of sleep. The effects of sleep deprivation on memory function, as well as changes in depression- and anxiety-like behaviours, have been extensively investigated; however, the findings have often been inconsistent. In the present study, we conducted a comprehensive literature review of researches utilizing sleep deprivation paradigms in both rats and mice. A total of 164 original studies were analysed to extract results from behavioural tests concerning memory function and depression- and anxiety-like behaviours in wild-type rats or mice before and after sleep deprivation. The meta-analysis revealed that sleep deprivation consistently impaired memory function, irrespective of the paradigms, durations and species involved [P = 0.000, SMD (standardized mean difference) 95% CI (confidence intervals at 95%): -0.73 (-0.89, -0.57) for sleep deprivation; P = 0.000, SMD (95% CI): -0.75 (-0.93, -0.57) for rapid eye movement sleep deprivation]. Similar, albeit less pronounced, effects were observed on depression-like behaviours [P = 0.000, SMD (95% CI): -0.41 (-0.52, -0.29) for sleep deprivation; P = 0.000, SMD (95% CI): -0.60 (-0.79, -0.42) for rapid eye movement sleep deprivation]. The impact of sleep deprivation on anxiety-like behaviours was more variable. When considering both mice and rats, sleep deprivation generally exhibited anxiogenic effects [P = 0.049, SMD (95% CI): -0.19 (-0.39, -0.00) for sleep deprivation; P = 0.705, SMD (95% CI): 0.04 (-0.18, 0.27) for rapid eye movement sleep deprivation]. However, subgroup analyses indicated that rodent species and sleep durations demonstrated distinct responses to sleep deprivation. This study provides critical insights for selecting optimal paradigms, durations, species and behavioural tests in experimental designs.

Keywords: anxiety; depression; memory; sleep deprivation; species.


Conflict of interest statement

The authors declare that they have no competing interests.

Figures

Graphical Abstract
Graphical Abstract
Figure 1
Figure 1
Publication bias with global effects of sleep deprivation. (A) The funnel plot was constructed to illustrate the relationship between the study's precision [standard error of the standardized mean difference, S.E. (SMD)] and effect sizes (SMD) (n = 32). (B) Begg's funnel plot was utilized to assess publication bias concerning the global effects of sleep deprivation. The horizontal line in the funnel plot represents the random-effects summary estimate, while the sloping lines indicate the expected 95% CI for the standard error (n = 32). (C) A summary of outcomes derived from the SYRCLE's Risk of Bias (RoB) assessment tool is presented (n = 164). Each dot in Fig. 1A and B represents the combined data from the analysis of the global effects of sleep deprivation. n, sample size; SMD, standardized mean difference.
Figure 2
Figure 2
Flowchart of the articles selection process.  n, sample size.
Figure 3
Figure 3
Forest plot for the effects of SD on anxiogenesis, depression and memory function loss, respectively. Memory function: control group sample size (Con-n) = 2514, Experimental group sample size (Exp-n) = 2533. Depression-like behaviours: control group sample size (Con-n) = 588, experimental group sample size (Exp-n) = 596. Anxiety-like behaviours: Control group sample size (Con-n) = 735, Experimental group sample size (Exp-n) = 719. The black square and horizontal line represent each study's odds ratio and 95% CI, respectively, with a point estimate. The black diamond indicates the effect size of each study. The summary effect for each subgroup and overall is visualized as the diamond at the bottom of the plot. CI, confidence interval; EPM, elevated plus maze test; FC, fear conditioning test; FST, forced swim test; MWM, Morris water maze test; n, sample size; NLR, novel location recognition test; NOR, novel object recognition test; OF, open field test; PAT, passive avoidance test; PMDAT, plus-maze discriminative avoidance task; RAWM, radial arm water maze test; SD, sleep deprivation; SMD, standardized mean difference; SPT, sucrose preference test; TST, tail suspend test.
Figure 4
Figure 4
Forest plot for the effects of REMSD on anxiogenesis, depression and memory function loss, respectively. Memory function: Control group sample size (Con-n) = 1745, Experimental group sample size (Exp-n) = 1768. Depression-like behaviours: Control group sample size (Con-n) = 371, Experimental group sample size (Exp-n) = 372. Anxiety-like behaviours: Control group sample size (Con-n) = 438, Experimental group sample size (Exp-n) = 446. The meanings of the black square, horizontal line and black and diamonds in the figure are consistent with those in Fig. 3. CI, confidence interval; EPM, elevated plus maze test; FC, fear conditioning test; FST, forced swim test; MWM, Morris water maze test; n, sample size; NLR, novel location recognition test; NOR, novel object recognition test; OF, open field test; PAT, passive avoidance test; PMDAT, plus-maze discriminative avoidance task; RAWM, radial arm water maze test; REMSD, rapid eye movement sleep deprivation; SMD, standardized mean difference; SPT, sucrose preference test; TST, tail suspend test.
Figure 5
Figure 5
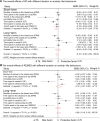
Forest plots the effects of SD (A) and REMSD (B) on anxiety-like behaviours between mice and rats. (A) The overall effects of SD on anxiety-like behaviours in different species. (B) The overall effect of REMSD on anxiety-like behaviours in different species. Anxiety-like behaviours: SD: Mice: Control group sample size (Con-n) = 307, Experimental group sample size (Exp-n) = 283; Rats: Control group sample size (Con-n) = 428, Experimental group sample size (Exp-n) = 436. REMSD: Mice: Control group sample size (Con-n) = 224, Experimental group sample size (Exp-n) = 233; Rats: Control group sample size (Con-n) = 214, Experimental group sample size (Exp-n) = 213. The meanings of the black square, horizontal line and black and diamonds in the figure are consistent with those in Fig. 3. CI, confidence interval; EPM, elevated plus maze test; n, sample size; OF, open field test; PMDAT, plus-maze discriminative avoidance task; REMSD, rapid eye movement sleep deprivation; SD, sleep deprivation; SMD, standardized mean difference.
Figure 6
Figure 6
Forest plot of long-term and short-term SD (A) and REMSD (B) on anxiety-like behaviours. (A) The overall effects of SD with different duration on anxiety-like behaviours. (B) The overall effects of REMSD with different duration on anxiety-like behaviours. SD: Long-term: Control group sample size (Con-n) = 296, Experimental group sample size (Exp-n) = 292; Short-term: Control group sample size (Con-n) = 439, Experimental group sample size (Exp-n) = 427. REMSD: Long-term: Control group sample size (Con-n) = 246, Experimental group sample size (Exp-n) = 254; Short-term: Control group sample size (Con-n) = 192, Experimental group sample size (Exp-n) = 192. The meanings of the black square, horizontal line and black and diamonds in the figure are consistent with those in Fig. 3. CI, confidence interval; EPM, elevated plus maze test; n, sample size; OF, open field test; PMDAT, plus-maze discriminative avoidance task; REMSD, rapid eye movement sleep deprivation; SD, sleep deprivation; SMD, standardized mean difference.
Figure 7
Figure 7
The effect size of the parameters to evaluate memory function and depressive-like behaviours after sleep deprivation. The differences were assessed using one-way ANOVA. The sensitivity of the parameters revealed no significant differences in (A) memory function tests [F(14, 217) = 0.809, P = 0.659] and (B) depressive-like behaviour tests [F(2, 54) = 2.587, P = 0.085]. The effect sizes of the selected parameters that demonstrated statistical significance were derived from the meta-analysis of cluster four (Supplementary Table 3). These parameters were obtained from behavioural tests evaluating memory function and depressive-like behaviours, including FC, FST, MWM, NLR, NOR, PAT, RAWM, TST and SPT. (A) Memory Function Tests: Freezing% context fear (FC), n = 25; Freezing% cue fear (FC), n = 9; Escape Latency(s) (MWM), n = 24; Distance% in target quadrant (MWM), n = 13; Number of platform crossing (MWM), n = 21; Time spent in target quadrant(s) (MWM), n = 13; Time% in target quadrant (MWM), n = 29; Discrimination index% (NLR), n = 9; Discrimination index% (NOR), n = 22; Recognition index% (NOR), n = 12; Long-term memory (PAT), n = 17; Time% in aversive enclosed arm (PMDAT), n = 3; Long-term memory 24 h (RAWM), n = 7; Long-term memory 5 h (RAWM), n = 11; Short-term memory 30 min (RAWM), n = 17. (B) Depressive-like Behaviour Tests: Immobility (S) (FST), n = 35; Sucrose preference% (SPT), n = 14; immobility (S) (TST), N = 8. Each dot represents the effect size generated from one experiment. Data are presented as mean ± SEM. FC, fear conditioning; FST, forced swim test; MWM, Morris water maze; n, sample size; NLR, novel location recognition; NOR, novel object recognition; PAT, passive avoidance test; RAWM, radial arm water maze; SD, sleep deprivation; TST, tail suspend test; SPT, the sucrose preference test.

References

    1. Scammell TE, Arrigoni E, Lipton JO. Neural circuitry of wakefulness and sleep. Neuron. 2017;93(4):747–765. - PMC - PubMed
    1. McKillop LE, Vyazovskiy VV. Sleep and ageing: From human studies to rodent models. Curr Opin Physiol. 2020;15:210–216. - PMC - PubMed
    1. Van Twyver H. Sleep patterns of five rodent species. Physiol Behav. 1969;4(6):901–905.
    1. Pires GN, Bezerra AG, Tufik S, Andersen ML. Effects of experimental sleep deprivation on anxiety-like behaviour in animal research: Systematic review and meta-analysis. Neurosci Biobehav Rev. 2016;68:575–589. - PubMed
    1. Matenchuk BA, Mandhane PJ, Kozyrskyj AL. Sleep, circadian rhythm, and gut microbiota. Sleep Med Rev. 2020;53:101340. - PubMed

LinkOut - more resources