

Optimizing Agronomic Zinc Biofortification in Carrots
- PMID: 40995556
- PMCID: PMC12455016
- DOI: 10.1002/pei3.70086
Optimizing Agronomic Zinc Biofortification in Carrots
Abstract
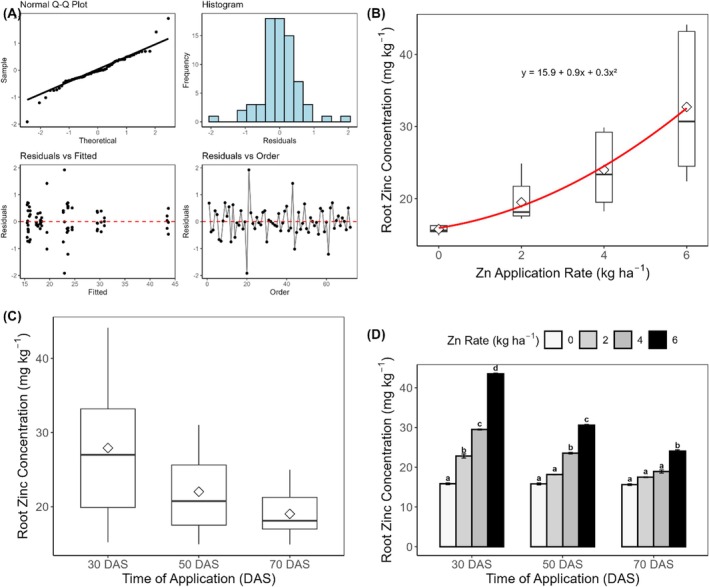
Zn deficiency affects over 2 billion people globally, particularly in regions with Zn-deficient soils. Biofortification of staple crops offers a sustainable solution to this challenge. This study investigated Zn application methods (soil vs. foliar), rates (0-6 kg ha-1), and timings (30, 50, and 70 days after sowing [DAS]) on growth, yield, and Zn accumulation in carrots under greenhouse conditions. Zn application significantly improved plant growth parameters, chlorophyll content, and yield. Chlorophyll content increased by approximately 36% as Zn rates increased from 0 to 6 kg ha-1. Zn application at 6 kg ha-1 increased carrot yield by 97.2% compared to the control. Foliar application achieved superior shoot Zn enrichment, with concentrations 51% higher than soil application at the highest rate. Root Zn concentrations showed no significant difference between application methods, suggesting distinct Zn translocation mechanisms between aerial and underground tissues. Early application (30 DAS) was most effective for root Zn accumulation, increasing concentrations by 175% compared to the control. An observed quadratic response to Zn application suggests an optimal threshold (6 kg ha-1) for maximizing biofortification efficiency while maintaining economic feasibility. Early Zn intervention is essential for sandy soils with rapid nutrient leaching potential, and combined soil-foliar applications effectively address limited nutrient retention capacity. These findings demonstrate that Zn biofortification can simultaneously meet nutritional objectives and improve agricultural productivity in carrots, providing viable strategies for regions with similar soil constraints.
Keywords: Daucus carota L; Zn application methods; Zn biofortification; nutrient accumulation; time of Zn application; tropical agriculture.
© 2025 The Author(s). Plant‐Environment Interactions published by New Phytologist Foundation and John Wiley & Sons Ltd.
Conflict of interest statement
The authors declare no conflicts of interest.
Figures


References
-
- Adekiya, A. O. , Alori E. T., Ogunbode T. O., Sangoyomi T., and Oriade O. A.. 2023. “Enhancing Organic Carbon Content in Tropical Soils: Strategies for Sustainable Agriculture and Climate Change Mitigation.” Open Agriculture Journal 17, no. 1: 1–15.
-
- Ahammed, S. , Rahim M., and Hossain M.. 2025. “Potato Biofortification With Zinc: Comparison between Soil Application and Foliar Spray.” Journal of Experimental Agriculture International 47, no. 5: 341–355.
-
- Akca, H. , and Taban S.. 2024. “Optimising Grain Zn Biofortification in Bread Wheat: Innovative Fertilisation Strategies for Field Conditions.” Journal of Soil Science and Plant Nutrition 24, no. 3: 4714–4726.
LinkOut - more resources
Full Text Sources
Research Materials