. 2025 Sep 23:8:0895.
doi: 10.34133/research.0895. eCollection 2025.

NUFIP1-Mediated Ribophagy Alleviates PANoptosis of CD4+ T Lymphocytes in Sepsis via the cGAS-STING Pathway

Affiliations

NUFIP1-Mediated Ribophagy Alleviates PANoptosis of CD4+ T Lymphocytes in Sepsis via the cGAS-STING Pathway

Pengyue Zhao et al. Research (Wash D C). .

Abstract

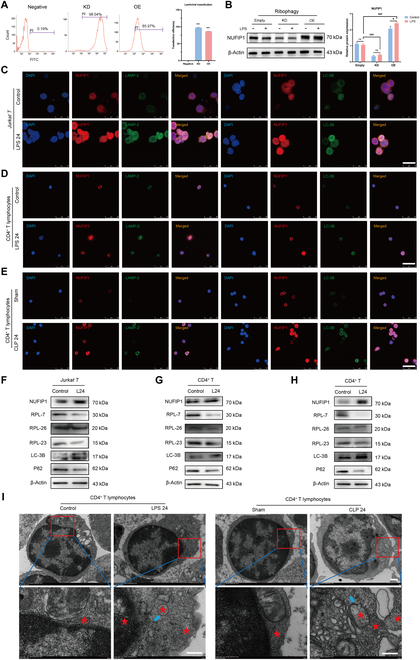
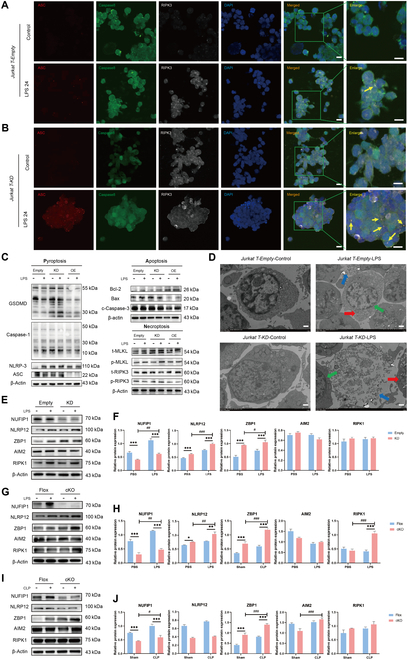
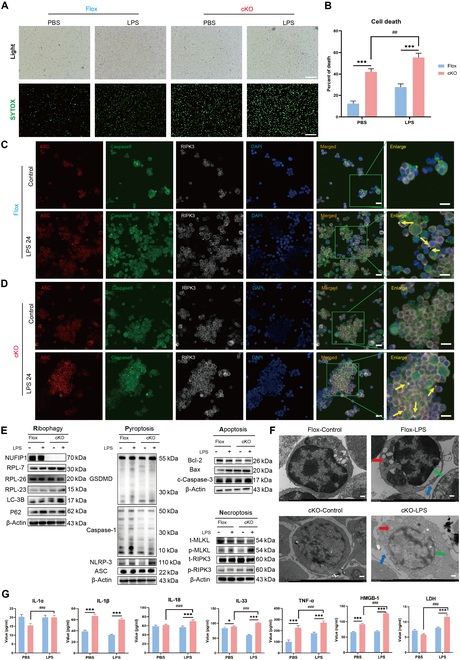
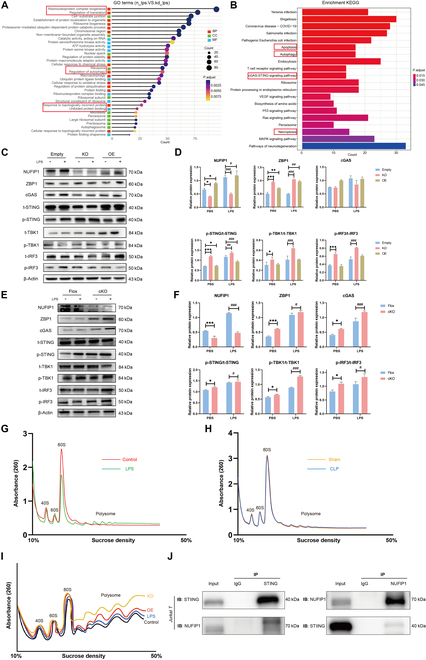
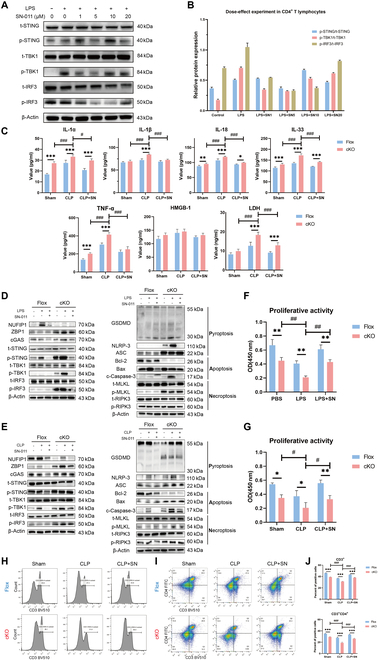
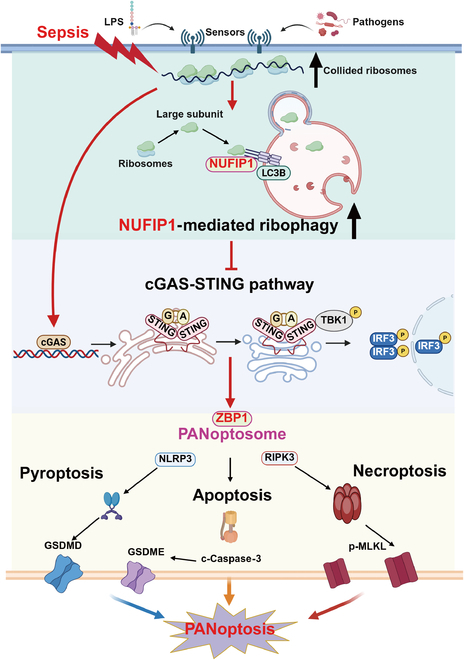
T lymphocyte dysfunction represents a pivotal determinant of immunosuppression in sepsis. Our previous studies demonstrated that nuclear fragile X mental retardation-interacting protein 1 (NUFIP1)-mediated ribophagy conferred cytoprotection against apoptosis in CD4+ T lymphocytes during sepsis, thereby preserving host immunocompetence. Despite growing evidence linking PANoptosis to the pathogenesis of various diseases, the potential role of ribophagy in modulating CD4+ T lymphocytes' PANoptosis in sepsis remains largely unclear. In the present study, we employed both lipopolysaccharide-stimulated Jurkat T cells and cecal ligation and puncture (CLP)-induced sepsis models to demonstrate marked exacerbation of CD4+ T lymphocyte PANoptosis following NUFIP1 knockdown (KD), associated with impaired immune function, as evidenced by diminished cytokine production and T cell proliferation. Tandem mass tagging (TMT) proteomic analysis identified Z-nucleic acid binding protein 1 (ZBP1)-mediated PANoptosome formation and the cyclic GMP-AMP synthase-stimulator of interferon genes (cGAS-STING) pathway as critical nodes in ribophagy-dependent cytoprotection. Mechanistically, sepsis-induced ribosome collision activated the cGAS-STING signaling axis, which in turn recruited NUFIP1 to STING protein complexes. Clinical analysis of septic patients revealed enhanced ribophagy and PANoptosis in peripheral blood CD4+ T cells, consistent with the experimental findings. These results suggest that NUFIP1-mediated ribophagy alleviates CD4+ T lymphocyte PANoptosis in sepsis via the cGAS-STING pathway, highlighting the therapeutic potential of targeting ribophagy and PANoptosis pathways to mitigate immune paralysis and improve the outcomes following septic insults.


Conflict of interest statement

Competing interests: The authors declare that they have no competing interests.

Figures

Fig. 1.
Fig. 1.
PANoptosis of CD4+ T lymphocytes in sepsis. (A) Apoptosis of Jurkat T cells was detected by TUNEL after LPS stimulation at different time points. The scale bar represents 100 μm. n = 3 technical repetitions. (B) Necrosis of Jurkat T cells was detected by SYTOX-Green after LPS stimulation at different time points. The scale bar represents 100 μm. n = 3 technical repetitions. (C) WB determined the expression of PANoptosis-related proteins in Jurkat T cells after LPS stimulation at different time points. (D) The expression and colocalization of PANoptosis core protein ASC/caspase-8/RIPK3 in Jurkat T cells stimulated with LPS were determined by LSCM. The yellow arrows represent PANoptosomes, and the scale bar represents 25 μm. (E) The expression and colocalization of ASC/caspase-8/RIPK3 in splenic CD4+ T cells stimulated with LPS were determined by LSCM. (F) Expression and colocalization of ASC/caspase-8/RIPK3 in splenic CD4+ T cells by LSCM after CLP operation. (G) WB detected the expression of CD4+ T lymphocyte PANoptosis-related protein in sepsis. (H) Cytokine secretion levels of splenic CD4+ T cells in culture supernatant were measured by ELISA. n = 6 technical repetitions. (I) Serum cytokine levels of mice in different groups were measured by ELISA. n = 6 technical repetitions. (J) The morphological characteristics of PANoptosis in Jurkat T cells were observed by TEM. The red arrow denotes the intracellular vesicles associated with pyroptosis; the green arrow signifies the nuclear condensation and chromatin shrinkage characteristic of cell apoptosis; the blue arrow indicates the loss of cell membrane integrity in necroptosis; and the scale bars represent 500 nm (top) and 100 nm (bottom). (K) The morphological characteristics of PANoptosis in splenic CD4+ T lymphocytes in vitro were observed by TEM. (L) The morphological characteristics of PANoptosis in splenic CD4+ T lymphocytes in vivo were observed by TEM. Data were expressed as means ± SEM. An unpaired 2-sided Student’s t test was applied to test the statistical significance. *P < 0.05, **P < 0.01, ***P < 0.001.
Fig. 2.
Fig. 2.
Sepsis induces activation of ribophagy in CD4+ T lymphocytes. (A) The transfection efficiency of lentivirus in different groups was measured by flow cytometry. n = 3 technical repetitions. (B) The expression of NUFIP1 protein in different groups of Jurkat T cells was detected by WB. n = 3 technical repetitions. (C) The expression and colocalization of NUFIP1, LAMP2, and LC3B in Jurkat T cells stimulated with LPS were detected by LSCM. The scale bar represents 25 μm. (D) The expression and colocalization of NUFIP1, LAMP2, and LC3B in splenic CD4+ T cells stimulated with LPS were detected by LSCM. The scale bar represents 25 μm. (E) The expression and colocalization of NUFIP1, LAMP2, and LC3B in splenic CD4+ T cells by LSCM after CLP operation. The scale bar represents 25 μm. (F) The expression of ribophagy-related proteins in Jurkat T cells stimulated with LPS was detected by WB. (G) The expression of ribophagy-related proteins in splenic CD4+ T cells stimulated with LPS was detected by WB. (H) The expression of ribophagy-related proteins in splenic CD4+ T cells was detected by WB after CLP operation. (I) The morphological changes of CD4+ T lymphocyte organelles and ribophagy in sepsis were determined by TEM. The red stars indicate the ribosomes, and the blue arrows represent autophagosomes. The scale bars represent 500 nm (top) and 100 nm (bottom). Data were expressed as means ± SEM. An unpaired 2-sided Student’s t test was applied to test the statistical significance. *P < 0.05, ***P < 0.001. ###P < 0.001 compared with the empty-LPS group.
Fig. 3.
Fig. 3.
Effect of NUFIP1-mediated ribophagy on ZBP1-PANoptosis in sepsis. (A) The expression and colocalization of ASC/caspase-8/RIPK3 in Jurkat-empty cells stimulated with LPS were determined by LSCM. The yellow arrows represent PANoptosomes, and the scale bar represents 25 μm. (B) The expression and colocalization of ASC/caspase-8/RIPK3 in Jurkat-KD cells stimulated with LPS were determined by LSCM. The yellow arrows represent PANoptosomes, and the scale bar represents 25 μm. (C) The expression of PANoptosis-related proteins in Jurkat T cells after transfection with lentivirus was detected by WB. (D) The morphological characteristics of PANoptosis in Jurkat T cells after transfection with lentivirus were observed by TEM. The red arrow denotes the intracellular vesicles associated with pyroptosis; the green arrow signifies the nuclear condensation and chromatin shrinkage characteristic of cell apoptosis; the blue arrow indicates the loss of cell membrane integrity in necroptosis; and the scale bar represents 500 nm. (E and F) Expression of 3 key proteins mediating PANoptosome formation in Jurkat T cells of empty and KD groups under LPS stimulation by WB. n = 3 technical repetitions. (G and H) Expression of key proteins mediating PANoptosome formation in splenic CD4+ T cells of the Flox and cKO groups under LPS stimulation by WB. n = 3 technical repetitions. (I and J) The expression of key proteins mediating PANoptosome formation in splenic CD4+ T cells of the Flox and cKO groups was examined by WB after CLP operation. n = 3 technical repetitions. Data were expressed as means ± SEM. A 2-way ANOVA test was applied to test the statistical significance. ***P < 0.001 compared with the empty/Flox group; #P < 0.05, ##P < 0.01, ###P < 0.001 compared with the KD-PBS/cKO-PBS/cKO-sham group.
Fig. 4.
Fig. 4.
Impact of conditional deletion of NUFIP1 on PANoptosis of splenic CD4+ T lymphocytes in septic mice. (A and B) The necrosis of splenic CD4+ T lymphocytes in mice stimulated with LPS was detected by SYTOX-Green. The scale bar represents 100 μm. n = 3 technical repetitions. (C) The expression and colocalization of ASC/caspase-8/RIPK3 in splenic CD4+ T lymphocytes of Flox mice stimulated with LPS were detected by LSCM. The yellow arrows represent PANoptosomes, and the scale bar represents 25 μm. (D) The expression and colocalization of ASC/caspase-8/RIPK3 in splenic CD4+ T lymphocytes of cKO mice stimulated with LPS were detected by LSCM. The yellow arrows represent PANoptosomes, and the scale bar represents 25 μm. (E) Expression of PANoptosis-related proteins in splenic CD4+ T lymphocytes of cKO mice stimulated with LPS under WB. (F) Morphological characteristics of PANoptosis in splenic CD4+ T lymphocytes of Flox and cKO mice stimulated with LPS under TEM. The red arrow denotes the intracellular vesicles associated with pyroptosis; the green arrow signifies the nuclear condensation and chromatin shrinkage characteristic of cell apoptosis; the blue arrow indicates the loss of cell membrane integrity in necroptosis; and the scale bar represents 500 nm. (G) Cytokine levels in the culture supernatant of splenic CD4+ T cells were measured by ELISA in Flox and cKO groups. n = 6 technical repetitions. Data were expressed as means ± SEM. A 2-way ANOVA test was applied to test the statistical significance. *P < 0.05, ***P < 0.001 compared with the Flox group. ##P < 0.01, ###P < 0.001 compared with the cKO-PBS group.
Fig. 5.
Fig. 5.
Impact of conditional deletion of NUFIP1 on immune response of CD4+ T lymphocytes, organ injury, and the 1-week survival rate of mice in sepsis. (A) The proliferative activity of splenic CD4+ T cells was measured by CCK-8 after CLP operation. n = 3 technical repetitions. (B) Serum cytokine levels in the Flox and cKO groups were measured by ELISA after CLP operation. n = 4 technical repetitions. (C and E) Proportion of CD3+ T lymphocytes in the peripheral blood of mice in different groups detected by flow cytometry. n = 3 technical repetitions. (D and F) The proportion of CD3+CD4+ T lymphocytes in the peripheral blood of mice in different groups was detected by flow cytometry. n = 3 technical repetitions. (G and H) The ratio of Th1/Th2 of splenic CD4+ T cells was detected by flow cytometry. n = 3 technical repetitions. (I and J) Percentage of Tregs of splenic CD4+ T cells detected by flow cytometry. n = 3 technical repetitions. (K and L) Percentage of Th17 cells of splenic CD4+ T cells detected by flow cytometry. n = 3 technical repetitions. (M to Q) H&E staining assessment of various organ lesions, including heart (M), lung (N), liver (O), and kidney (P) in different groups of mice. The scale bar represents 50 μm. n = 3 biological independent samples. (R) One-week survival curves of different groups of mice (**P < 0.01 compared with the sham group; #P < 0.05 compared with the Flox-CLP group). n = 10 biological independent samples. Data were expressed as means ± SEM. A 2-way ANOVA test was applied to test the statistical significance. *P < 0.05, **P < 0.01, ***P < 0.001 compared with the Flox group. ##P < 0.01, ###P < 0.001 compared with the cKO-sham group.
Fig. 6.
Fig. 6.
NUFIP1 deficiency disrupts ribophagy and ribosomal collision to trigger cGAS-STING-dependent PANoptosis in septic CD4+ T lymphocytes. (A) Differentially expressed protein GO pathway enrichment maps of Jurkat T cells in the normal control and KD groups stimulated with LPS. (B) Differentially expressed protein KEGG pathway enrichment map of Jurkat T cells in the normal control and KD groups stimulated with LPS. (C and D) Expression of cGAS-STING signaling-related proteins in different groups of Jurkat T cells under LPS stimulation by WB. n = 3 technical repetitions. (E and F) Expression of cGAS-STING signaling-related proteins in splenic CD4+ T cells of the Flox and cKO groups under LPS stimulation by WB. n = 3 technical repetitions. (G) Ribosomal collision events of Jurkat T cells assessed by polysome profiling under PBS or LPS. (H) Ribosomal collision events of CD4+ T cells assessed by polysome profiling under sham or CLP. (I) The effects of NUFIP1 gene interference on ribosomal collisions within Jurkat T cells were assessed by polysome profiling. (J) The interaction between NUFIP1 and STING in Jurkat T cells was detected by Co-IP. Data were expressed as means ± SEM. A 2-way ANOVA test was applied to test the statistical significance. *P < 0.05, **P < 0.01, ***P < 0.001 compared with the empty-PBS/Flox-PBS group; #P < 0.05, ##P < 0.01, ###P < 0.001 compared with the empty-LPS/Flox-LPS group.
Fig. 7.
Fig. 7.
Regulatory effects of cGAS-STING signaling on CD4+ T lymphocyte PANoptosis and immune response in septic mice. (A and B) The optimal concentration of SN-011 on splenic CD4+ T lymphocytes under LPS stimulation was determined by WB. n = 3 technical repetitions. (C) Serum cytokine levels in the Flox and cKO groups were measured by ELISA after CLP. n = 6 technical repetitions. (D) The effects of SN-011 on the cGAS-STING pathway and PANoptosis-related protein expression in splenic CD4+ T lymphocytes under LPS stimulation were detected by WB. (E) The effects of SN-011 on cGAS-STING signaling and PANoptosis-related protein expression in splenic CD4+ T lymphocytes by WB after CLP. (F and G) The effect of SN-011 on the proliferative activity of splenic CD4+ T lymphocytes in sepsis mice was measured by CCK-8. n = 3 technical repetitions. (H to J) The effect of SN-011 on the proportion of CD3+ T (H) and CD3+CD4+ T lymphocytes (I) in the peripheral blood of mice of different groups was detected by flow cytometry. n = 3 technical repetitions. Data were expressed as means ± SEM. A 2-way ANOVA was applied to test the statistical significance. *P < 0.05, **P < 0.01, ***P < 0.001 compared with the Flox group. #P < 0.05, ##P < 0.01, ###P < 0.001 compared with the cKO-LPS/CLP groups.
Fig. 8.
Fig. 8.
Regulatory effects of cGAS-STING signaling on peripheral immune status in septic mice and ribophagy, PANoptosis, and immune function of peripheral blood CD4+ T lymphocytes in sepsis patients. (A to E) H&E staining assessed the effects of SN-011 on multiple organ damage, including heart (A), lung (B), liver (C), and kidney (D) in different groups of mice. The scale bar represents 50 μm. n = 3 biological independent samples (two-way ANOVA was applied to test the statistical significance; ##P < 0.01, ###P < 0.001 compared with the cKO-CLP groups). (F and G) Impact of SN-011 on the 1-week survival rate of Flox (F) and cKO (G) mice. n = 10 biological independent samples (**P < 0.01 compared with the sham group; #P < 0.05, ###P < 0.001 compared with the cKO-CLP group). (H) The apoptosis of CD4+ T lymphocytes in the peripheral blood of patients with and without sepsis was detected by TUNEL. The scale bar represents 100 μm. n = 3 technical repetitions. (I) The apoptosis of CD4+ T lymphocytes in the peripheral blood of patients with and without sepsis was determined by Hoechst 33258. The scale bar represents 100 μm. n = 3 technical repetitions. (J) Necrosis of CD4+ T lymphocytes in the peripheral blood of patients with and without sepsis was detected by SYTOX-Green. The scale bar represents 100 μm. n = 3 technical repetitions. (K) The expression of ribophagy and PANoptosis-related proteins in the peripheral blood CD4+ T lymphocytes of patients with and without sepsis was analyzed by WB. (L) The proliferative activity of CD4+ T lymphocytes in the peripheral blood of patients with and without sepsis was detected by CCK-8. n = 3 technical repetitions. (M) Serum cytokine levels in patients with and without sepsis were measured by ELISA. n = 5 technical repetitions. (N and O) The proportions of CD3+ T (N) and CD3+CD4+ T (O) lymphocytes in the peripheral blood of patients with and without sepsis were analyzed by flow cytometry. n = 3 technical repetitions. Data were expressed as means ± SEM. An unpaired 2-sided Student’s t test was applied to test the statistical significance. *P < 0.05, **P < 0.01, ***P < 0.001.
Fig. 9.
Fig. 9.
Mechanism schematic diagram of the current study. Illustrations were created with BioRender.

References

    1. Meyer NJ, Prescott HC. Sepsis and septic shock. N Engl J Med. 2024;391(10141):2133–2146. - PubMed
    1. Rudd KE, Johnson SC, Agesa KM, Shackelford KA, Tsoi D, Kievlan DR, Colombara DV, Ikuta KS, Kissoon N, Finfer S, et al. Global, regional, and national sepsis incidence and mortality, 1990-2017: Analysis for the Global Burden of Disease Study. Lancet. 2020;395(10219):200–211. - PMC - PubMed
    1. Yao RQ, Zhao PY, Li ZX, Liu YY, Zheng LY, Duan Y, Wang L, Yang R-L, Kang H-J, Hao J-W, et al. Single-cell transcriptome profiling of sepsis identifies HLA-DRlowS100Ahigh monocytes with immunosuppressive function. Mil Med Res. 2023;10(1):27. - PMC - PubMed
    1. Du X, Dong Z, Yan Y, Gong Y, Yuan M, Ma C, Xu L, Qu Y, Qu M, Pan P, et al. Immunomodulatory nanozymes eradicate intracellular infections and rescue immunoparalysis for treating multidrug-resistant bacterial sepsis. Exploration. 2025;20250127.
    1. Zhang SY, Xu QP, Shi LN, Li SW, Wang WH, Wang QQ, Lu L-X, Xiao H, Wang J-H, Li F-Y, et al. Soluble CD4 effectively prevents excessive TLR activation of resident macrophages in the onset of sepsis. Signal Transduct Target Ther. 2023;8(1):236. - PMC - PubMed

LinkOut - more resources