. 2025 Dec;17(1):2557979.
doi: 10.1080/19490976.2025.2557979. Epub 2025 Sep 25.

Tryptophan catabolites from microbiota ameliorate immune-mediated hepatitis through activating aryl hydrocarbon receptor of T cells

Affiliations

Tryptophan catabolites from microbiota ameliorate immune-mediated hepatitis through activating aryl hydrocarbon receptor of T cells

Bo Li et al. Gut Microbes. 2025 Dec.

Abstract

Intestinal dysbiosis and T cell-mediated immune attack are implicated in the pathogenesis of autoimmune hepatitis (AIH). However, the mechanisms by which microbiota-derived metabolites modulate immune homeostasis in AIH remain elusive. Here, we demonstrated that microbiota-derived indole-3-carboxaldehyde (ICA) was significantly reduced in patients with AIH. Treatment with ICA restricted the activation of effector T cells by activating AhR in T lymphocytes. Nuclear translocation of AhR induced the transcription of PI3K interacting protein 1 (Pik3ip1), which inhibited the PI3K/Akt/mTOR signaling pathway. In vivo supplementation of ICA suppressed effector T cells and mitigated the tissue damage and hepatic inflammation in two mouse models of T cell-mediated hepatitis. Importantly, T cell-specific deletion of AhR abrogated the protective effects of ICA in AIH-like mouse model. Finally, administration of Lactobacillus reuteri resulted in elevated level of ICA and protected mice from liver damage. Our data suggest that ICA supplementation ameliorates immune-mediated hepatitis through agonizing AhR in T cells, presenting a promising therapeutic strategy for AIH.

Keywords: Indole-3-carboxaldehyde; PI3K interacting protein 1; aryl hydrocarbon receptor; immune-mediated hepatitis; lactobacillus reuteri.


Conflict of interest statement

No potential conflict of interest was reported by the author(s).

Figures

Figure 1.
Figure 1.
Level of indole-3-carboxaldehyde is reduced in patients of AIH. (A) fecal concentrations of ICA, IAA, IPA, ILA in the same cohorts of AIH (n = 42) and healthy controls (n = 34) as measured by UHPLC-MS/MS. Correlation analysis between fecal ICA and levels of biochemical indexes including (B) ALT, (C) AST and (D) AKP in patients with AIH (n = 42). Data are shown as mean ± SEM. **p < .01 by Mann–Whitney test. Spearman correlation analysis in Figure B-D.
Figure 2.
Figure 2.
Treatment of ICA restricts activation of effector T cells. (A) Representative flow cytometry plots and statistical analyses of expression levels of CD25 and CD69 on peripheral T cells from patients with AIH (n = 6) after being incubated with α-CD3/CD28 mAbs and ICA (250 μM) or vehicle for 36 hours. (B) Representative flow cytometry plots and statistical analyses of CFSE assessing the proliferation of peripheral T cells sorted from patients with AIH (n = 6) incubated with α-CD3/CD28 mAbs and ICA (250 μM) or vehicle for 72 hours. (C) ELISA measurement of IFN-γ and IL-2 secreted by T cells from patients with AIH (n = 6) incubated with α-CD3/CD28 mAbs and ICA (250 μM) or vehicle for 36 hours. Representative flow cytometry plots and statistical analyses of (D) frequency of IFN-γ-producing CD4+ T cells (n = 6) and (E) expression of tbet (n = 5) treated with or without ICA (250 μM) under the polarizing condition of Th1. (F) representative flow cytometry plots and statistical analyses of frequency of Treg (CD4+CD25highFOXP3+) induced with or without ICA (250 μM) under the polarizing condition of Treg (n = 6). Data are shown as mean ± SEM. **p < .01, **p < .001 by student’s paired t test.
Figure 3.
Figure 3.
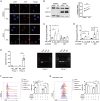
ICA upregulates Pik3ip1 expression and suppresses PI3K/Akt/mTOR signaling in T lymphocytes. (A) Volcano plots show global gene-expression profiles of primary human T cells treated with ICA (250 μM) or vehicle and stimulated for 16 hours with α-CD3/CD28 mAbs. Transcripts with a Log2(Fold change) > 1 and FDR < 0.01 in ICA-treated T cells are shown in red (upregulated, 272 genes) or blue (downregulated, 291 genes). (B) Kyoto encyclopedia of genes and genomes (KEGG) pathways differed between the ICA group and the vehicle group (p < 0.05). (C) Gene set enrichment analysis (GSEA) of PI3K-Akt signaling pathway and Akt1 targeted genes. The normalized enrichment (NES) and the p value are labeled. (D)Fold change of Pik3ip1 mRNA assessed by quantitative PCR in primary human T cells (n = 5). (E) treatment of ICA (250 μM) increased the expression of Pik3ip1 in T lymphocytes, with or without the stimulation of α-CD3/CD28 mAbs for 12 hours. The two bands of different exposure time demonstrate a consistent change of Pik3ip1 at 37kDa (the unglycosylated form) and 45kDa (the glycosylated form). The relative quantification of blots intensity was done by comparing the ICA group to the vehicle. (F) After being treated with ICA or vehicle for 16 hr, primary T cells were stimulated with α-CD3/CD28 mAbs. The indicated proteins involved in PI3K signaling were examined by Immunoblot analysis at indicated timepoints. Flow cytometric analysis of (G) pS6 expression and (H) 2-NBDG levels in CD4+ T cells treated with ICA and vehicle and stimulated with α-CD3/CD28 mAbs for 12 and 36 hours, respectively. Data are shown as mean ± SEM. **p < .05, **p < .01, ***p < .001 by two-tailed Student’s t test. Data are representative of three independent experiments (D-H).
Figure 4.
Figure 4.
AhR engaged by ICA transcriptionally activates Pik3ip1 in T cells. (A) Human peripheral T cells were immunostained for AhR after being stimulated with ICA (250 μM) and α-CD3/CD28 mAbs overnight. (B) The T cells incubated with ICA or vehicle and activated for 24 h were fractionated, and the cytoplasmic and nuclear protein fractions were then blotted for AhR, LAMIN A/C and GAPDH. The representative blots and quantification of AhR protein levels (ratio of the nuclear to the total AhR) are shown. T cell transcription of (C) AhR and (D) its downstream CYP1A1 at indicated timepoints were analyzed by qPCR. (E) ChIP analysis of the interaction between AhR and Pik3ip1gene in primary human T cells activated with α-CD3/CD28 mAbs. Primer 2 is designed with the promoter sequences of Pik3ip1, and the negative control primer 1 corresponds to the 3’ non-coding region of Pik3ip1. The productions of qPCR were confirmed by gel electrophoresis. (F, G) Representative flow cytometry plots and statistical analyses of the phosphorylated levels of S6 and Akt in human primary T cells infected with lentivirus containing AhR-specific shRNA or scramble shRNA. The infection rate of lentivirus was about 40–50%, and GFP+ T cells were gated before analysis. Data are shown as mean ± SEM. **p < .05, **p < .01 by two-tailed student’s t test. Data are representative of three independent experiments (A-G).
Figure 5.
Figure 5.
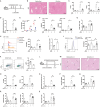
Supplementation of ICA mitigated T cell-mediated hepatitis. (A) Experimental design of ConA model and ICA supplementation schedule. (B) Representative H&E staining (×100) of livers in mice treated with vehicle or ICA intraperitoneally and subjected to ConA challenge for 16 hours. (C) Serum levels of ALT and AST in vehicle- and ICA-treated groups (n = 4–6 per group). (D) Quantification of inflammatory and necrotic area. (E) IFN-γ detected by ELISA at indicated timepoints after ConA injection. (F) statistical analyses of expression levels of CD25 in hepatic CD4+ T cells and CD8+ T cells. (G) Statistical analyses of the hepatic frequency of Tregs (CD4+NK1.1FOXP3+). (H) Representative flow cytometry plots and statistical analyses of IFN-γ+ MFI in hepatic CD4+ T cells in vehicle and ICA-treated groups. For detection of intracellular cytokines after ConA challenge, HMNCs were freshly isolated and treated with brefeldin a for 6 hours at 37°C to block cytokine release. (I) Quantitative PCR results of Pik3ip1 in hepatic T lymphocytes. (J) flow cytometry analyses of Pik3ip1 expression in hepatic T cells. (K) Representative flow cytometry plots and statistical analyses of the phosphorylation level of S6 in hepatic T cells. (L) experimental design of AAV IL-12 models and ICA supplementation schedule. (M) representative H&E staining (×100) of livers in mice administered with AAV IL-12 and treated with vehicle or ICA for 4 weeks. (N) Serum levels of ALT and AST in vehicle- and ICA-treated AAV IL-12 mice (n = 6 per group). (O) quantification of inflammatory and necrotic area. (P) ELISA measurement of serum IFN-γ. (Q) ELISA measurement of serum IgG. Statistical analyses of (R) activated CD4+ T cells and CD8+ T cells and (S) hepatic Tregs (CD4+NK1.1 FOXP3+) in mice administered with AAV luc (control AAV) or AAV IL-12 and being treated with or without ICA. Data are shown as mean ± SEM. **p < .05, **p < .01 by two-tailed student’s t test. Data are representative of at least two independent experiments.
Figure 6.
Figure 6.
Amelioration of hepatitis by ICA supplementation requires T cell expression of AhR. (A) representative H&E staining (×100) of livers in AhRfl/fl and AhRfl/fl Cd4-Cre mice treated with vehicle or ICA intraperitoneally and subjected to ConA challenge. (B) quantification of inflammatory and necrotic area in each group (n = 4–5 per group). (C) serum levels of ALT and AST, respectively. (D) statistical analyses of expression levels of CD25 in hepatic CD4+ T cells and CD8+ T cells in AhRfl/fl and AhRfl/fl Cd4-Cre mice treated with vehicle or ICA. Ctrl group refers to the AhRfl/fl mice, and AKO refers to AhRfl/fl Cd4-Cre mice. Data are shown as mean ± SEM. **p < .05, **p < .01, ***p < .001 by two-tailed Student’s t test. Data are representative of two independent experiments (A-D).
Figure 7.
Figure 7.
Lactobacillus reuteri enhanced levels of ICA and ameliorated immune hepatitis. (A) experimental design of ConA-induced hepatitis in C57BL/6 mice and L.Reuteri administration schedule. (B) Serum concentrations of ICA in mice administered with L.Reuteri or PBS as measured by UHPLC-MS/MS. (C) Representative H&E staining (×100) of livers in mice orally gavage of L.Reuteri or PBS and subjected to ConA challenge. (D) Quantification of inflammatory and necrotic area in each group (n = 6 per group). (E) Serum levels of ALT and AST. (F) ELISA measurement of serum IFN-γ. (G) Statistical analyses of expression levels of CD25 in hepatic CD4+ T cells and CD8+ T cells. (H) Experimental design of AAV IL-12 models and L.Reuteri administration schedule. (I) representative H&E staining (×100) of livers. (J) Quantification of inflammatory and necrotic area in each group (n = 6 per group). (K) Statistical analyses of expression levels of CD69 in hepatic CD4+ T cells and CD8+ T cells. Data are shown as mean ± SEM. **p < .05, **p < .01, ***p < .0001 by two-tailed student’s t test. Data are representative of two independent experiments (D-K).

References

    1. Mieli-Vergani G, Vergani D, Czaja AJ, Manns MP, Krawitt EL, Vierling JM, Lohse AW, Montano-Loza AJ.. Autoimmune hepatitis[J]. Nat Rev Dis Primers. 2018;4(1):18017. doi: 10.1038/nrdp.2018.17. - DOI - PubMed
    1. Webb GJ, Hirschfield GM, Krawitt EL, Gershwin ME. Cellular and molecular mechanisms of autoimmune hepatitis. Annu Rev Pathol. 2018;13(1):247–17. doi: 10.1146/annurev-pathol-020117-043534. - DOI - PubMed
    1. Longhi MS, Zhang L, Mieli-Vergani G, Vergani D. B and T cells: (still) the dominant orchestrators in autoimmune hepatitis. Autoimmun Rev. 2024;23(7–8):103591. doi: 10.1016/j.autrev.2024.103591. - DOI - PMC - PubMed
    1. Arenz M, Meyer Zum Büschenfelde KH, Löhr HF. Limited T cell receptor Vbeta-chain repertoire of liver-infiltrating T cells in autoimmune hepatitis. J Hepatol. 1998;28(1):70–77. doi: 10.1016/S0168-8278(98)80204-3. - DOI - PubMed
    1. Yoshizawa K, Ota M, Katsuyama Y, Ichijo T, Inada H, Umemura T, Tanaka E, Kiyosawa K. T cell repertoire in the liver of patients with autoimmune hepatitis. Hum Immunol. 1999;60(9):806–815. doi: 10.1016/S0198-8859(99)00058-0. - DOI - PubMed

MeSH terms

LinkOut - more resources