. 2025 Nov;267(3):329-346.
doi: 10.1002/path.6474. Epub 2025 Sep 25.

Dysregulated mitochondrial energy metabolism drives the progression of mucosal field effects to invasive bladder cancer

Affiliations

Dysregulated mitochondrial energy metabolism drives the progression of mucosal field effects to invasive bladder cancer

Sangkyou Lee et al. J Pathol. 2025 Nov.

Abstract

Multiplatform mutational and gene expression profiling complemented with proteomic and metabolomic spatial mapping were used on the whole-organ scale to identify the molecular profile of bladder cancer evolution from field effects. Analysis of the mutational landscape identified three types of mutations, referred to as α, β, and γ. Time modeling of the mutations revealed that carcinogenesis may span 30 years and can be divided into dormant and progressive phases. The α mutations developed in the dormant phase. The progressive phase lasted 5 years and was signified by expanding β mutations, but it was driven to invasive cancer by γ mutations. The mutational landscape emerged on a background of disorganized urothelial differentiation, activated epithelial-mesenchymal transition, and enhanced immune infiltration with T-cell exhaustion. Complex dysregulation of mitochondrial energy metabolism with downregulation of oxidative phosphorylation emerged as the leading mechanism driving the progression of mucosal field effects to invasive cancer. © 2025 The Author(s). The Journal of Pathology published by John Wiley & Sons Ltd on behalf of The Pathological Society of Great Britain and Ireland.

Keywords: bladder cancer; dysregulation of mitochondrial energy metabolism; mutational landscape; time modeling.


Figures

Figure 1
Figure 1
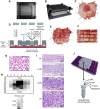
Preparation of whole‐organ maps for multiplatform genomic, proteomic, and metabolomic profiling. (A) Top view of the mapping grid for whole‐organ sampling. (B) Oblique view of the mapping grid. (C) Photograph of an open cystectomy sample pinned to a paraffin block showing a fungating tumor involving the posterior bladder wall. (D) Diagram of the details of the mapping grid preserving the urothelium for histologic mapping and permitting simultaneous DNA/RNA and protein extraction. PBS, phosphate‐buffered saline. (E) The open cystectomy sample shown in (C) with impressions of the mapping grid for histologic sampling. (F) Enlarged view of the mucosal area of the open cystectomy sample with the impression of the mapping grid showing the sampling pattern for histologic mapping of the mucosa. (G) A urothelial single‐cell suspension after sample collection from geographically mapped mucosal areas used for DNA/RNA and protein extraction. (H) A whole‐organ histologic map prepared by sampling of the entire bladder mucosa in the cystectomy sample shown in (C). MD, mild dysplasia; MdD, moderate dysplasia; SD, severe dysplasia. (I) Representative microscopic images corresponding to normal urethelium (NU), low‐grade intraepithelial neoplasia (LGIN), high‐grade intraepithelial neoplasia (HGIN), and urothelial carcinoma (UC). (J) Geographically mapped urothelial cell suspensions corresponding to the histologic map shown in H used for DNA/RNA and protein extraction.
Figure 2
Figure 2
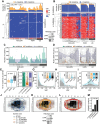
Mutational landscape of bladder cancer evolution from field effects. (A) Heatmap of nonsilent mutations showing variant allele frequencies (VAFs) in individual mucosal samples. The numbers of mutations in individual mucosal samples are shown in the top diagram. (B) Heatmap of VAFs ≥ 0.01 in genes showing variant alleles in at least three mucosal samples. The numbers of β and γ mutations in individual mucosal samples are shown in the top diagram. An enlarged view of panel B is available in the supplementary material, Figure S15. (C) The numbers of α, β, and γ mutations in individual mucosal samples. (D) VAFs of α, β, and γ mutations in individual mucosal samples. An enlarged view of panel D is available in the supplementary material, Figure S15. (E) Boxplot of the number of mutations in mucosal samples classified as normal urethelium (NU), low‐grade intraepithelial neoplasia (LGIN), high‐grade intraepithelial neoplasia (HGIN), and urothelial carcinoma (UC). (F) VAFs of α, β, and γ mutations. (G) Histogram showing the clonality of VAFs of α mutations. Inset, boxplot of VAFs of α mutations in three groups of samples corresponding to NU/LGIN, HGIN, and UC. (H) Histogram showing the clonality of VAFs of β mutations. Inset, boxplot of VAFs of β mutations in three groups of samples corresponding to NU/LGIN, HGIN, and UC. (I) Histogram showing the clonality of VAFs of γ mutations. Inset, boxplot of VAFs of γ mutations in three groups of samples corresponding to NU/LGIN, HGIN, and UC. (J) Spatial distribution of 50 randomly selected α mutations superimposed on a histologic map of a cystectomy. (K) Spatial distribution of β mutations superimposed on a histologic map of a cystectomy. (L) Spatial distribution of 50 randomly selected γ mutations superimposed on a histologic map of a cystectomy. (M) Proportions of COSMIC driver mutations in α, β, and γ mutations. In G, H, and L, NU samples are shown in orange, HGIN samples are shown in blue, and UC samples are shown in black. Also, in J, K, and L, the color‐coded ovals represent mutation spread.
Figure 3
Figure 3
Modeling of bladder cancer evolution from its mutational landscape. (A) Parsimony analysis showing an evolutionary tree of expansion of successive clones of cells in the field effects corresponding to normal urethelium (NU), low‐grade intraepithelial neoplasia (LGIN) along three branches designated as δ, ε, and ζ. The hypothetical beginning of the process is designated as node 0 and depicted as in the gray circle. (B) Heatmap of genetic distances for successive clones with three clusters corresponding to branches δ, ε, and ζ in A. The beginning of carcinogenesis is shown in the lower left corner, indicated by the black arrow. (C) The numbers of mutations in individual cystectomy samples organized in the same order as in B. (D) VAFs in individual cystectomy samples organized in the same order as in B. Of note is the increase in VAFs in samples corresponding to branch ζ. (E) Ages of all synonymous and nonsynonymous mutations predicted by mathematical modeling. Inset: the selection coefficient in relation to the predicted mutation age. (F) Ages of α mutations predicted by mathematical modeling. Inset: the selection coefficients for α mutations. (G) Ages of β mutations predicted by mathematical modeling. Inset: the selection coefficients for β mutations. (H) Ages of γ mutations predicted by mathematical modeling. Inset: the selection coefficients for γ mutations. (I) Bar graph of nucleotide substitutions in the dormant and progressive phases of bladder carcinogenesis. (J) Left: numbers of silent and nonsilent mutations in the dormant and progressive phases, respectively, of bladder carcinogenesis. Right: VAFs in the dormant and progressive phases of bladder carcinogenesis. (K) Proportions of SNVs in nucleotide motifs for each category of substitution in the dormant and progressive phases of bladder carcinogenesis. (L) Weight scores for mutagenesis patterns in the dormant and progressive phases of bladder carcinogenesis. (M) Composition of the mutational signatures in α, β, and γ mutations in the dormant and progressive phases of bladder carcinogenesis.
Figure 4
Figure 4
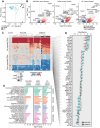
RNA‐seq–based gene expression profile of bladder cancer evolution from mucosal field effects. (A) PCA of gene expression data for all mucosal samples. (B) Volcano plots of RNA expression levels comparing log2 fold changes with −log p values in normal urethelium (NU)/low‐grade intraepithelial neoplasia (LGIN), high‐grade intraepithelial neoplasia (HGIN), and urothelial carcinoma (UC) samples versus those in control samples. (C) Heatmap of the top 30 upregulated and top 30 downregulated genes in mucosal samples. (D) Boxplot of the top 30 upregulated and top 30 downregulated genes in C depicting changes in NU/LGIN and HGIN/UC samples compared with control samples. (E) Monotonically dysregulated KEGG pathways showing −log p values for the comparison of NU/LGIN, HGIN, and UC samples with control samples.
Figure 5
Figure 5
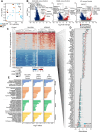
Proteomic profile of bladder cancer evolution from mucosal field effects. (A) PCA of protein expression data for all mucosal samples. (B) Volcano plots of all annotated proteins comparing log2 fold changes with −log p values in normal urethelium (NU)/low‐grade intraepithelial neoplasia (LGIN), high‐grade intraepithelial neoplasia (HGIN), and urothelial carcinoma (UC) samples versus those in control samples. (C) Heatmap of the top 50 upregulated and top 50 downregulated proteins in mucosal samples. (D) Boxplot of the top 50 upregulated and top 50 downregulated proteins in C depicting whole changes in NU/LGIN and HGIN/UC samples compared with controls. (E) Monotonically dysregulated KEGG protein pathways showing −log p values for the comparison of NU/LGIN, HGIN, and UC samples with control samples.
Figure 6
Figure 6
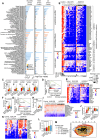
Interactive analysis of molecular pathways in bladder cancer development from field effects. (A) Combined analysis of monotonically dysregulated pathways in normal urethelium (NU)/low‐grade intraepithelial neoplasia (LGIN), high‐grade intraepithelial neoplasia (HGIN), and urothelial carcinoma (UC) (one‐sided Fisher's exact test p value). (B) Proteomic expression levels for enzymes in mitochondrial oxidative phosphorylation complexes. Enlarged views of panels A and B are available in the supplementary material, Figure S16. (C) Boxplot of the expression levels for enzymes in oxidative phosphorylation complexes in three groups of samples corresponding to NU/LGIN, HGIN, and UC compared with control urothelium. (D) GSEA of protein expression levels in oxidative phosphorylation complexes in the mucosal samples compared with control urothelium. (E) Expression levels for enzymes involved in the citric acid cycle. (F) Boxplot of expression levels for enzymes involved in the citric acid cycle in three groups of samples corresponding to NU/LGIN, HGIN, and UC compared with control urothelium. (G) GSEA of expression levels for proteins involved in the citric acid cycle in the mucosal samples compared with control urothelium. (H) Boxplot of the energy scores in three groups of samples corresponding to NU/LGIN, HGIN, and UC compared with control urothelium. (I) Expression levels for metabolites involved in the citric acid cycle. (J) Boxplot of lactate dehydrogenase A (left) and lactic acid (right) levels in three groups of samples corresponding to NU/LGIN, HGIN, and UC compared with control urothelium. (K) Expression levels for enzymes involved in glycolysis. (L) Boxplot of the expression levels for glycolysis enzymes in three groups of samples corresponding to NU/LGIN, HGIN, and UC compared with control urothelium. (M) Spatial distribution of the downregulated enzymes involved in mitochondrial oxidative phosphorylation in B superimposed on a histologic map of a cystectomy.

References

    1. Sinjab A, Han G, Wang L, et al. Field carcinogenesis in cancer evolution: what the cell is going on? Cancer Res 2020; 80: 4888–4891. - PMC - PubMed
    1. Curtius K, Wright NA, Graham TA. An evolutionary perspective on field cancerization. Nat Rev Cancer 2018; 18: 19–32. - PubMed
    1. Bondaruk J, Jaksik R, Wang Z, et al. The origin of bladder cancer from mucosal field effects. iScience 2022; 25: 104551. - PMC - PubMed
    1. Majewski T, Yao H, Bondaruk J, et al. Whole‐organ genomic characterization of mucosal field effects initiating bladder carcinogenesis. Cell Rep 2019; 26: 2241–2256.e4. - PubMed
    1. Lawson ARJ, Abascal F, Coorens THH, et al. Extensive heterogeneity in somatic mutation and selection in the human bladder. Science 2020; 370: 75–82. - PubMed