. 2025 Sep 26:10.1158/2159-8290.CD-24-1565.
doi: 10.1158/2159-8290.CD-24-1565. Online ahead of print.

Functional mapping of epigenomic regulators uncovers coordinated tumor suppression by the HBO1 and MLL1 complexes

Affiliations

Functional mapping of epigenomic regulators uncovers coordinated tumor suppression by the HBO1 and MLL1 complexes

Yuning J Tang et al. Cancer Discov. .

Abstract

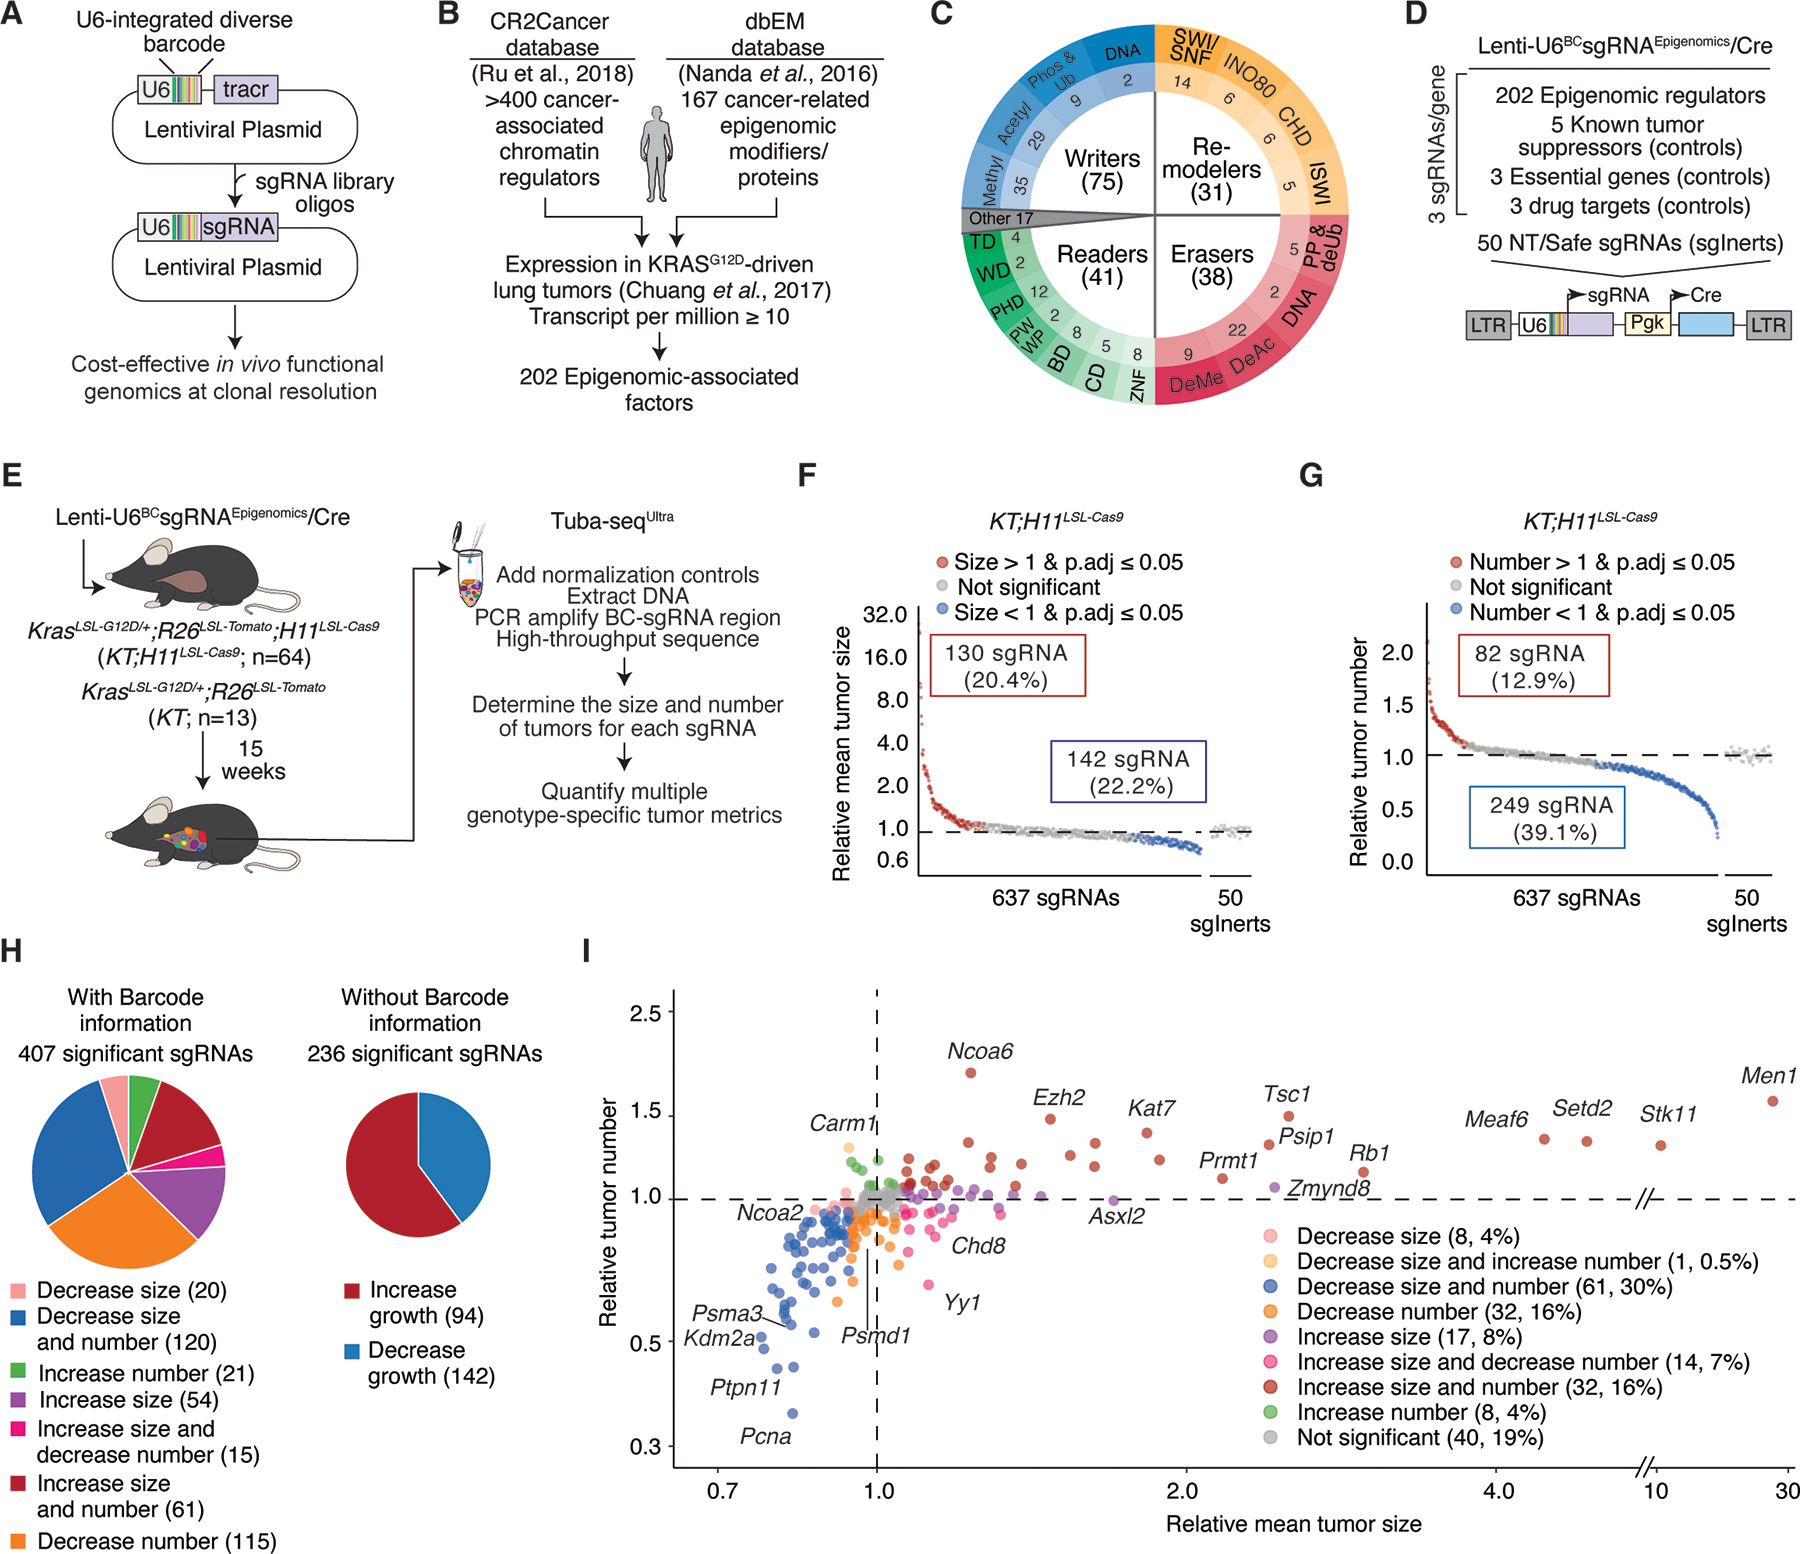
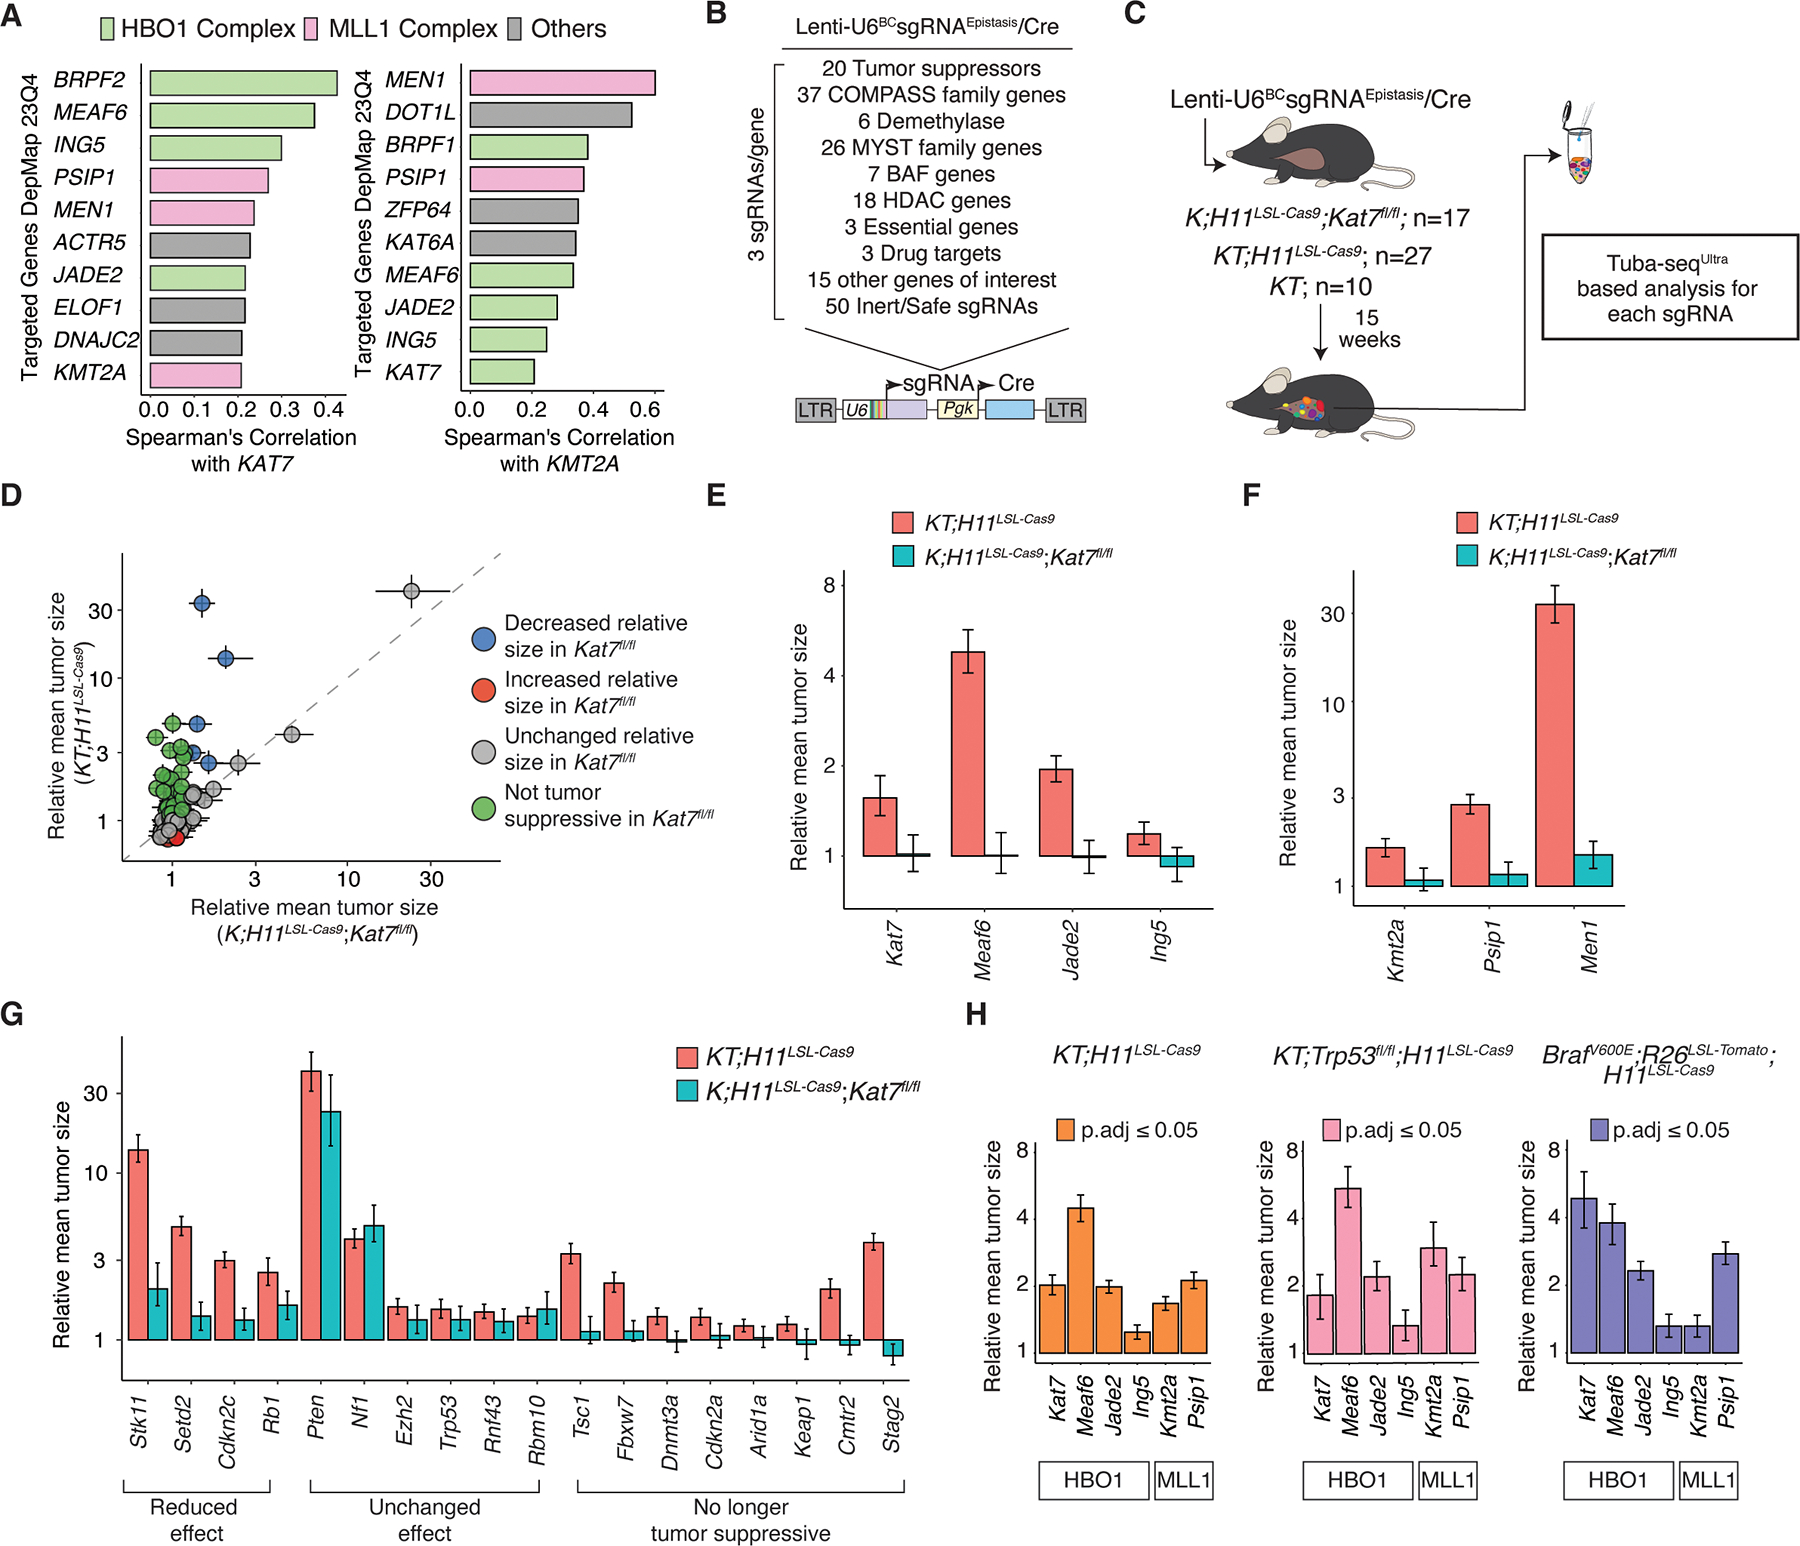
Epigenomic dysregulation is widespread in cancer. However, the specific epigenomic regulators and the processes they control to drive cancer phenotypes are poorly understood. We employed a novel high-throughput in vivo method to perform iterative functional screens of >250 epigenomic regulators within autochthonous oncogenic KRAS-driven lung tumors. We identified many previously unappreciated epigenomic tumor-suppressor and tumor-dependency genes. We show that a specific HBO1 complex and MLL1 complex are robust tumor suppressors in lung adenocarcinoma. Histone modifications generated by HBO1 complex are frequently reduced in human lung adenocarcinomas and are associated with worse clinical features. HBO1 and MLL1 complexes co-occupy shared genomic regions, impact chromatin accessibility, and control the expression of canonical tumor suppressor genes and lineage fidelity. The HBO1 complex is epistatic with the MLL1 complex and other tumor suppressor genes in lung adenocarcinoma development. Collectively, these results provide a phenotypic roadmap of epigenomic regulators in lung tumorigenesis in vivo.


Conflict of interest statement

Conflict of Interest Statement

M.M.W and D.A.P are founders and hold equity in Guide Oncology. The other authors declare no competing interest.

Figures

Figure 1.
Figure 1.. High-throughput analyses uncover the functional landscape of epigenomic regulation during autochthonous lung tumorigenesis.
A. Integration of diverse barcodes into the U6 promoter enables scalable, in vivo functional genomics with clonal resolution. B. Genes from broad classes of epigenomic regulators were prioritized for selection based on cancer-associated human databases and expression in KRASG12D-driven lung adenocarcinoma cells from analogous genetically engineered mouse model. C. Selected genes encompass all major categories of epigenomic regulators, including Writers, Readers, Remodelers, and Erasers, along with other genes associated with epigenomic regulation D. Generation of Tuba-seqUltra (U6 barcode Labeling with per-Tumor Resolution Analysis) lentiviral library. The Lenti-U6BCsgRNAEpigenomics/Cre library targets epigenomic regulators (3 sgRNAs/gene), known tumor suppressor genes, drug targets, essential genes, and includes non-targeting (NT) and safe-targeting (sgSafe) control sgRNAs (collectively referred to as sgInerts). sgSafe sgRNAs target genomic loci without known biological function. E. Tumors were initiated with the Lenti-U6BCsgRNAEpigenomics/Cre library in the indicated numbers of KrasLSL-G12D/+;R26LSL-TdTomato;H11LSL-Cas9 (KT;H11LSL-Cas9) and KT mice. KT mice, which lack Cas9, were used as controls to quantify the relative representation of each sgRNA in the library and to assess tumor growth effects. Tumors developed for 15 weeks before Tuba-seqUltra analysis. F-G. Impact of each sgRNA on tumor growth (Relative mean tumor size; log-normal mean tumor size relative to sgInert tumors) and tumor initiation/early growth (Relative tumor number) in KT;H11LSL-Cas9 mice. Each dot represents an sgRNA. Statistical significance was determined by bootstrap resampling with 10,000 iterations. Significant sgRNAs are colored as indicated. H. Clonal-level analyses deconvolute the effects of different sgRNAs on tumor size and number, uncovering many more effects than sgRNA-level analyses without barcode-level information (computed here as relative tumor burden). I. Gene-level analysis of tumor growth (relative mean tumor size) and tumor initiation/early growth (relative tumor number). Each dot represents a gene. Established tumor suppressors, essential genes, top novel epigenomic tumor suppressors, and representative genes in other categories are labeled. Note the split x-axis.
Figure 2.
Figure 2.. Top tumor-suppressive and tumor-dependency epigenomic regulators in lung tumorigenesis.
A-B. Top 30 tumor-suppressive genes from the Lenti-U6BCsgRNAEpigenomics/Cre library that impact tumor size (A) and/or tumor number (B). Bars represent the relative log-normal mean tumor size (A) or relative tumor number (B), aggregated across sgRNAs for each gene. Statistical significance was determined by bootstrap resampling with 10,000 iterations. Error bars represent 95% confidence intervals. Setd2 is a known tumor suppressor in lung cancer and an epigenomic regulator. C-D. Top 30 tumor-dependency genes from the Lenti-U6BCsgRNAEpigenomics/Cre library that impact tumor size (C) and/or tumor number (D). Bars represent the relative log-normal mean tumor size (C) or relative tumor number (D), aggregated across sgRNAs for each gene. Statistical significance was determined by bootstrap resampling with 10,000 iterations. Error bars represent 95% confidence intervals. E. Gene Ontology annotation of tumor suppressive epigenomic regulators. Gene hits for each functional category are shown in brackets. Statistical significance was determined by Fisher’s exact test with Benjamini-Hochberg correction. F. Tumor-suppressive subunits in HBO1 and MLL1/2 complexes. Numbers in brackets indicate gene rank by effect size (tumor size, tumor number). G-J. Kaplan-Meier survival curves for the indicated mouse genotypes with inactivation of Kat7 (G), Meaf6 (H), Kmt2a (I), and Psip1 (J) in lung tumors. sgRNAs targeting genomic loci with no known biological function (sgSafe) in KT;H11LSL-Cas9 were used as controls for sgPsip. Mice transduced with sgSafes have no significant difference in survival compared to KT mice (Supplemental Figure 4F) and were included to control for any potential growth effects arising from non-specific genome cleavage. Dashed lines indicate median survival, and statistical significance was determined by log-rank test. Note the split x-axes.
Figure 3.
Figure 3.. Saturation analysis of MYST and COMPASS families reveals specific tumor-suppressive complexes.
A. Genes from the MYST and COMPASS families, as well as other genes of interest, were included for in vivo functional saturation analysis. B. The Lenti-U6BCsgRNASaturation/Cre library contains sgRNAs targeting 38 epigenomic regulators from the initial analyses (Figures 1–2), 47 newly selected epigenomic regulators, as well as tumor suppressors, essential genes, non-targeting and safe-targeting sgRNAs (collectively referred to as sgInerts). C-D. Impact of each sgRNA on tumor size (C) and tumor number (D) in KT;H11LSL-Cas9 mice. Each dot represents an sgRNA. Significant sgRNAs are colored as indicated. E. Gene-level analysis of tumor growth (relative mean tumor size) and tumor initiation/early growth (relative tumor number) for the Lenti-U6BCsgRNASaturation/Cre library. Each dot represents a gene. Established tumor suppressors, essential genes, top novel epigenomic tumor suppressors, and representative genes in other classes are labeled. Newly included genes are shown in bold and underlined. Note the split x-axis. F-G. Effects of inactivating genes from the HBO1 or the MOZ/MORF complexes on tumor size (F) and tumor number (G). Bars show aggregated data of all sgRNAs for each gene. Statistical significance was determined by bootstrap resampling with 10,000 iterations. Error bars represent 95% confidence intervals. The complex(es) to which each subunit belongs are indicated below each graph. H. The tumor-suppressive HBO1JADE2-ING5 complex, in which all subunits are tumor suppressor genes. I-J. Effects of inactivating genes from the MLL1/2/3/4 complexes on tumor size (I) and tumor number (J). Bars show aggregated data of all sgRNAs for each gene. Statistical significance was determined by bootstrap resampling with 10,000 iterations. Error bars represent 95% confidence intervals. The complex(es) to which each subunit belongs are indicated below each graph.
Figure 4.
Figure 4.. Disruption of the HBO1 complex and its target histone modifications in mouse and human lung adenocarcinoma.
A. Representative immunohistochemistry staining for H3K14ac in mouse lung tumors initiated by the indicated vectors in KT;H11LSL-Cas9 mice. Lower panels (scale bar, 50 μm) are higher magnification images of areas in the upper panel (scale bar, 100 μm). B. Representative western blots of FACS-isolated lineage (CD45/CD31/Ter119/F4/80) negative, TdTomato positive (LinTdTom+) neoplastic cells from tumors initiated in KT;H11LSL-Cas9 mice with Lenti-sgKat7/Cre or Lenti-sgSafe/Cre vector. Each lane is from a different mouse. C. Densitometry quantification of western blots. Relative intensities are normalized to ACTIN. Error bars represent +/− standard error of the mean, and each dot represents a different mouse. Statistical significance was determined by Student’s t-test. D. Representative western blots of FACS-isolated LinTdTom+ neoplastic cells from KT;H11LSL-Cas9 mice with Lenti-sgMeaf6/Cre or Lenti-sgSafe/Cre vectors initiated tumors. Each lane is from a different mouse. E. Densitometry quantification of western blots. Relative intensities are normalized to ACTIN. Error bars represent +/− the standard error of the mean, and each dot represents a different mouse. Statistical significance was determined by Student’s t-test. F. Representative western blots of FACS-isolated LinTdTom+ neoplastic cells from tumors initiated in KT and KT;H11LSL-Cas9;Kat7fl/fl mice with Lenti-sgSafe/Cre vector. Each lane is from a different mouse. G. Densitometry quantification of western blots. Relative intensities are normalized to ACTIN. Error bars represent +/− standard error of the mean, and each dot represents a different mouse. Statistical significance was determined by Student’s t-test. H. Type and frequency of mutations in subunits of the HBO1JADE2-ING5 tumor-suppressive complex in human lung adenocarcinoma. The number of individuals (n) is indicated. I. Representative immunohistochemistry staining of human lung cancer samples expressing high, medium, low, or absent levels of H3K14ac (scale bar, 100 μm; inset scale bar, 5 μm). J. Percentage of human lung tumors expressing different levels of H3K14ac in normal lung tissue (Normal), mixed lung adenocarcinoma with bronchioalveolar carcinoma (Mixed), and lung adenocarcinoma (LUAD). Statistical significance was determined using the Kruskal-Wallis test with Benjamini-Hochberg correction. K. Percentage of human lung tumors categorized by clinical tumor grade and stage. Reduced H3K14ac levels are correlated with higher human lung tumor grade and stage. Statistical significance was determined by Kruskal-Wallis test with Benjamini-Hochberg correction. L. Representative western blots of human bronchial epithelial cell lines and lung adenocarcinoma cell lines. Oncogene status of each cell line is annotated.
Figure 5.
Figure 5.. The HBO1 and MLL1 complexes regulate chromatin accessibility and co-occupy shared genomic loci.
A. FACS-isolated lineage (CD45/CD31/Ter119/F4/80) negative, TdTomato positive (LinTdTom+) neoplastic cells from dissociated tumor-bearing mouse lungs were used for bulk ATAC-seq. B. Mean average (MA) plots of chromatin accessibility changes in sgKat7 and sgKmt2a tumor cells relative to sgSafe cells. Red and blue dots represent statistically significant ATAC-seq peaks (cut-off: p.adj ≤ 0.05). Data shown are derived from two independent ATAC-seq experiments. C. Genomic annotation and percentage distribution of significantly decreased chromatin accessibility regions (cut-off: log2 fold-change < 0 & p.adj ≤ 0.05) in sgKat7 or sgKmt2a cells relative to sgSafe cells. D. Heatmaps of significantly decreased chromatin accessibility regions in sgKmt2a cells relative to sgSafe cells (cut-off: log2 fold-change < 0 & p.adj ≤ 0.05). The same genomic regions are shown for sgKat7 cells relative to sgSafe cells, indicating broad similarity of decreased chromatin accessibility between these two genotypes. E. Overlap of significantly decreased chromatin accessibility regions between sgKat7 and sgKmt2a cells relative to sgSafe controls. F. Top transcription factor motifs enriched in shared genomic regions with significantly decreased chromatin accessibility in sgKat7 and sgKmt2a cells relative to sgSafe cells. G. Heatmaps of normalized CUT&RUN signals for the indicated proteins and histone modifications within ±3 kb of transcription start sites (TSS) for all genes in the KrasG12D; p53−/− murine lung adenocarcinoma cell line (KPTC). H. Genomic annotation and percentage distribution of CUT&RUN signals for the indicated proteins and histone modifications in the KPTC cell line. I. Overlap of CUT&RUN signals between the indicated proteins and histone modifications. J. Representative CUT&RUN tracks showing binding of the indicated proteins and histone modifications in the KPTC cell line at canonical tumor suppressor genes (Stk11, Cdkn2c) and transcription factors (Foxa1, Foxm1) that regulate lung epithelial development. These data demonstrate direct co-occupancy of HBO1 and MLL1 complexes and their target modifications near the promoters of these genes. Numbers in square brackets indicate the range of normalized peak scores for the tracks below.
Figure 6.
Figure 6.. The HBO1 and MLL1 complex genes regulate cell state identity and canonical tumor suppressor gene expression.
A. FACS-isolated lineage (CD45/CD31/Ter119/F4/80) negative, TdTomato positive (LinTdTom+) neoplastic cells from dissociated tumor-bearing mouse lungs were used for scRNA-seq. B. UMAPs of scRNA-seq data for the indicated genotypes. C. Differential gene expression between cell clusters that are predominantly sgKat7 or sgKmt2a compared to cell clusters that are predominantly sgSafe. The specific clusters for each group are shown in Supplemental Figure 15. Red dots indicate statistically significant up-regulated genes (cut-off: log2 fold-change ≥ 0.14 & p.adj ≤ 0.05), and blue dots indicate statistically significant down-regulated genes (cut-off: log2 fold-change ≤ −0.14 & p.adj ≤ 0.05). The total number of statistically significant genes is indicated. D. Dot plots of canonical tumor suppressor genes between the indicated cluster-based comparisons. Asterisks (*) indicate statistical significance (cut-off: log2 fold-change ≤ −0.14 or ≥ 0.14 & p.adj ≤ 0.05). E-F. Cell type signature scores for sgKat7 or sgSafe transduced tumor cells (E), and sgKmt2a or sgSafe transduced tumor cells (F). Violin plots show cell type signature scores for cells in predominantly sgKat7 or sgSafe clusters (E), and cells in predominantly sgKmt2a or sgSafe clusters (F). Median cell type signature score is indicated by a dot on each violin plot. Statistical significance was determined by Wilcoxon rank-sum test. G-H. Dot plots of AT2 and gastrointestinal marker genes between cell clusters that are predominantly sgKat7 (G) or sgKmt2a (H) compared to cell clusters that are predominantly sgSafe. Asterisks (*) indicate statistical significance (cut-off: log2 fold-change ≤ −0.14 or ≥ 0.14 & p.adj ≤ 0.05).
Figure 7.
Figure 7.. Kat7 is epistatic with the MLL1 complex and canonical tumor suppressor genes.
A. Correlation of cancer dependency scores from DepMap showing the top genes correlated with KAT7 include genes within the HBO1 and MLL1 complexes. Similarly, genes highly correlated with KMT2A include members of the MLL1 and HBO1 complexes. B. Genes included in the Lenti-U6BCsgRNAEpistasis/Cre library. C. Tumors were initiated with the Lenti-U6BCsgRNAEpistasis/Cre library in the indicated numbers of KT;H11LSL-Cas9 and KT mice. Tumors developed for 15 weeks before Tuba-seqUltra analysis. D. Mean tumor size relative to inert sgRNAs for the genes targeted in the Lenti-U6BCsgRNAEpistasis/Cre library is shown for K;H11LSL-Cas9;Kat7fl/fl mice (x-axis) and KT;H11LSL-Cas9 mice (y-axis). Each dot represents a gene. The diagonal line (y = x) indicates no difference in relative mean tumor size between the two mouse genotypes. Error bars represent 95% confidence intervals. E. Mean tumor size relative to sgInerts for HBO1JADE2-ING5 complex genes in KT;H11LSL-Cas9 and K;H11LSL-Cas9;Kat7fl/fl mice. F. Mean tumor size relative to sgInerts for MLL1 complex tumor suppressor genes in KT;H11LSL-Cas9 and K;H11LSL-Cas9;Kat7fl/fl mice. G. Mean tumor size relative to sgInerts for canonical tumor suppressor genes in KT;H11LSL-Cas9 and K;H11LSL-Cas9;Kat7fl/fl mice. Genes are considered to have reduced tumor suppressive effects in K;H11LSL-Cas9;Kat7fl/fl mice if their 95% confidence intervals do not overlap with the lower bound of the 95% confidence interval in KT;H11LSL-Cas9 mice. Genes are no longer considered tumor suppressive if the 95% confidence interval crosses 1 or is below 1 in K;H11LSL-Cas9;Kat7fl/fl mice but is greater than 1 in KT;H11LSL-Cas9 mice. H. Mean tumor size relative to sgInerts when targeting genes in the HBO1JADE2-ING5 or MLL1 complex in lung tumors from the indicated mouse genotypes.

Update of

References

    1. Hanahan D Hallmarks of Cancer: New Dimensions. Cancer Discov 2022;12(1):31–46 doi 10.1158/2159-8290.CD-21-1059. - DOI - PubMed
    1. Struhl K The distinction between epigenetics and epigenomics. Trends Genet 2024;40(12):995–7 doi 10.1016/j.tig.2024.10.002. - DOI - PMC - PubMed
    1. Liang WW, Lu RJ, Jayasinghe RG, Foltz SM, Porta-Pardo E, Geffen Y, et al. Integrative multi-omic cancer profiling reveals DNA methylation patterns associated with therapeutic vulnerability and cell-of-origin. Cancer Cell 2023;41(9):1567–85 e7 doi 10.1016/j.ccell.2023.07.013. - DOI - PMC - PubMed
    1. Corces MR, Granja JM, Shams S, Louie BH, Seoane JA, Zhou W, et al. The chromatin accessibility landscape of primary human cancers. Science 2018;362(6413) doi 10.1126/science.aav1898. - DOI - PMC - PubMed
    1. Geffen Y, Anand S, Akiyama Y, Yaron TM, Song Y, Johnson JL, et al. Pan-cancer analysis of post-translational modifications reveals shared patterns of protein regulation. Cell 2023;186(18):3945–67 e26 doi 10.1016/j.cell.2023.07.013. - DOI - PMC - PubMed