Clinical Trial
. 2025 Sep 25;16(1):8385.
doi: 10.1038/s41467-025-63104-y.

Development of clinical immunity to Plasmodium vivax following repeat controlled human malaria infection

Affiliations
Clinical Trial

Development of clinical immunity to Plasmodium vivax following repeat controlled human malaria infection

Mimi M Hou et al. Nat Commun. .

Abstract

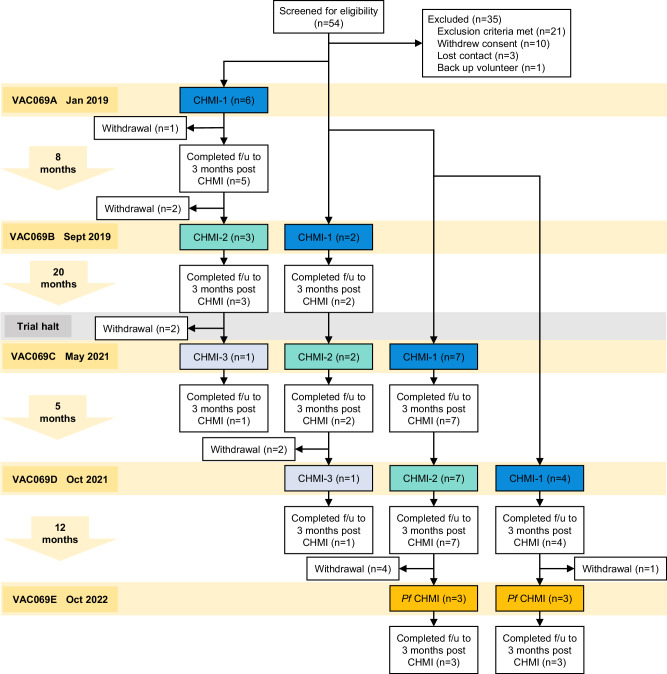
Clinical immunity to malaria can lead to asymptomatic infection, but the underlying mechanisms remain unclear. To examine the development of clinical immunity, we conducted a multi-cohort, repeat controlled human malaria infection (CHMI) study with Plasmodium vivax, and a heterologous rechallenge with P. falciparum (ClinicalTrials.gov NCT03797989). Malaria-naïve adults underwent CHMI up to three times, by administration of red blood cells infected with P. vivax PvW1 clone or P. falciparum 3D7 clone. Nineteen participants underwent primary CHMI with P. vivax, 12 returned for secondary homologous CHMI and 2 for tertiary homologous CHMI. Six participants who had completed P. vivax CHMI then underwent heterologous rechallenge with P. falciparum. We find that clinical immunity to P. vivax develops rapidly after a single CHMI, protecting participants against fever and laboratory abnormalities. This is underpinned by the attenuation of inflammatory cytokines and chemokines, as well as reduced coagulation and endothelium activation. In contrast, there is no evidence of anti-parasite immunity, suggesting that mechanisms of clinical immunity can operate independently of pathogen load to reduce the damage caused by malaria infection. In addition, we show that clinical immunity to P. vivax is parasite species-specific and provides no protection against CHMI with P. falciparum.


Conflict of interest statement

Competing interests: The authors declare no competing interests.

Figures

Fig. 1
Fig. 1. Flowchart of VAC069 study design and participant recruitment.
VAC069 was a multicohort study with each cohort (A–E) corresponding to a CHMI. In VAC069A to D, new participants were enrolled to undergo primary CHMI with P. vivax (CHMI-1). In VAC069B to D, participants who had completed CHMI in the previous cohort were invited to undergo secondary homologous CHMI (CHMI-2), followed by tertiary homologous CHMI (CHMI-3) in VAC069C and D. In VAC069E, participants who had previously completed one or two CHMIs with P. vivax were invited to undergo heterologous CHMI with P. falciparum (Pf CHMI). Follow-up (f/u) continued for 3 months after each CHMI. The trial was halted in 2020 due to the COVID-19 pandemic. The time intervals between each CHMI are shown to the left.
Fig. 2
Fig. 2. The parasite multiplication rate is comparable between primary and secondary P. vivax CHMI despite the boosting of anti-merozoite antibodies.
A Parasitaemia was measured up to twice daily by qPCR and is shown for each participant during primary P. vivax (CHMI-1) and secondary P. vivax CHMI (CHMI-2). The mean parasitaemia is shown in bold, and the dashed line indicates the treatment threshold of 10,000 genome copies (gc) ml−1. B Peak parasitaemia for each participant as measured by qPCR during primary and secondary P. vivax CHMI. There was no significant difference between primary and secondary infection (two-tailed p = 0.9, Wilcoxon matched pairs signed-rank test). C Parasite multiplication rate (fold-change per 48 h) was modelled from each participant’s log10-transformed qPCR data. No significant difference was observed between primary and secondary P. vivax CHMI (two-tailed p = 0.2, Wilcoxon matched pairs signed-rank test). In (B, C), box and whisker plots show median and interquartile range (IQR) with whiskers representing 1.5× IQR. All data are shown as dots. D Serum IgG responses were measured to seven P. vivax merozoite antigens using a multiplexed assay: Apical Membrane Antigen 1 (PvAMA1), Duffy-Binding Protein (PvDBP), Erythrocyte Binding Protein (PvEBP), GPI-Anchored Micronemal Antigen (PvGAMA), Merozoite Surface Protein 1 (PvMSP1), 6-Cysteine Protein p12 (PvP12) and Tryptophan Rich Antigen 25 (PvTRAg25). Gene IDs are shown in brackets. Antibody responses to CD4 were measured as a negative control. The following time-points are shown: baseline (1 or 2 days before P. vivax challenge), 7 days after challenge (C + 7), day of diagnosis and 45–56 days after challenge (C + 56). In (AD), n = 19 (primary CHMI) and n = 12 (secondary CHMI).
Fig. 3
Fig. 3. A single P. vivax infection induces long-lived mechanisms of clinical immunity.
A, B Clinical signs and symptoms of malaria in participants undergoing primary P. vivax CHMI (CHMI-1) compared to secondary P. vivax CHMI (CHMI-2) in the VAC069 study. Data are shown as a proportion of the total number of participants undergoing CHMI. A shows the maximum severity of any solicited adverse event (AE) reported by an individual in the 48 h before and after diagnosis; (B) shows the frequency and severity of each solicited AE. C Maximum recorded temperature during primary and secondary P. vivax CHMI. The pink dots represent the one participant who experienced fever upon rechallenge. All data shown, statistical comparison using two-tailed Wilcoxon matched pairs signed-rank test (p = 0.0099) only for participants undergoing two CHMIs (n = 12). DH Laboratory parameters (biochemistry and full blood counts) were measured during primary and secondary P. vivax CHMI at baseline (1 or 2 days before challenge); 7 and 14 days after challenge (C + 7 and C + 14); on the day of diagnosis; 1, 3 and 6 days after treatment (T + 1, T + 3 and T + 6); 45 to 56 days (C + 56) and 96 days (C + 96) after challenge. Statistically significant differences between CHMI-1 and CHMI-2 were identified at each time-point by using mixed-effects modelling and linear regression. D shows alanine aminotransferase (ALT, T + 6 p = 1.1 × 10−7); (E) shows albumin (diagnosis p = 0.039, T + 1 p = 1.3 × 10−5, T + 3 p = 8.6 × 10−7, T + 6 p = 1.3 × 10−6). F shows the minimum haemoglobin concentration with data split by participant sex. There was no significant difference between CHMI-1 and CHMI-2 (Wilcoxon matched pairs signed-rank test, two-tailed p = 0.8 for females, p = 0.09 for males). G shows lymphocyte count (diagnosis and T + 1 p < 2 × 10−16, T + 6 p = 0.029); (H) shows platelet count (diagnosis p = 3.5 × 10−8, T + 1 p < 2 × 10−16, T + 3 p = 4.1 × 10−10). Box and whisker plots show median and interquartile range (IQR) with whiskers representing 1.5× IQR (outliers are shown as dots). In (AF), n = 19 (primary P. vivax CHMI) and n = 12 (secondary P. vivax CHMI).
Fig. 4
Fig. 4. Clinical immunity to P. vivax is underpinned by attenuated inflammation.
AC Circulating biomarkers of inflammation, coagulation and endothelial cell activation were quantified during and after primary and secondary P. vivax CHMI using a bead-based multiplexed protein assay. We analysed plasma proteins at baseline (1 or 2 days before challenge); 12 days after challenge (C + 12); on the day of diagnosis; 1, 3 and 6 days after treatment (T + 1, T + 3 and T + 6); and 45 to 56 days after challenge (C + 56). A shows pyrogenic cytokines and their regulators (IL-1Ra: diagnosis p = 0.0016, T + 1 p = 6.8 × 10−11, IL-6: diagnosis p = 0.0024, T + 1 p = 2.1 × 10−7, sTNFRII: diagnosis p = 4.1 × 10−7, T + 1 p < 2 × 10−16, T + 3 p = 8.5 × 10−5). (B) shows chemokines and cytokines involved in T cell recruitment and activation (CXCL10: T + 1 p = 3.9 × 10−5, IL-12p70: diagnosis p = 0.0033, T + 1 p = 0.0048, IL-18: diagnosis p = 6.6 × 10−4, T + 1 p = 4.2 × 10−15, T + 3 p < 2 × 10−16, T + 6 p = 6.0 × 10−13) and (C) shows markers of coagulation and endothelial cell activation (D-Dimer: T + 1 p = 2.1 × 10−8, E-selectin: diagnosis p = 0.0038, T + 1 p = 1.2 × 10−7, T + 3 p = 2.4 × 10−5, T + 6 p = 0.014, ICAM-1: diagnosis p = 3.6 × 10−4, T + 1 p = 2.9 × 10−10, T + 3 p = 4.8 × 10−9, T + 6 p = 7.6 × 10−5). Box and whisker plots show median and interquartile range (IQR) with whiskers representing 1.5× IQR (outliers are shown as dots). Statistically significant differences between CHMI-1 and CHMI-2 were identified at each time-point by using mixed-effects modelling and linear regression. In (AC), n = 10 (primary P. vivax CHMI) and n = 7 (secondary P. vivax CHMI).
Fig. 5
Fig. 5. Clinical immunity is parasite species-specific.
A Parasitaemia as measured by qPCR during primary (CHMI-1) and secondary P. vivax CHMI (CHMI-2) and heterologous rechallenge with P. falciparum. Mean parasitaemia is shown in bold. The dashed line indicates the treatment threshold of 10,000 genome copies (gc) ml−1. B shows the maximum severity of any solicited adverse event (AE) reported by an individual in the 48 h before and after diagnosis, as a proportion of the total number of participants, during primary and secondary P. vivax CHMI and heterologous P. falciparum rechallenge. C Heatmap showing the log2 fold-change of 24 plasma analytes during primary and secondary P. vivax CHMI and heterologous P. falciparum rechallenge. Data are shown relative to values at baseline (1 or 2 days before challenge) at the following time-points: 7 (C + 7) or 12 (C + 12) days after challenge with P. falciparum or P. vivax, respectively; day of diagnosis; 1, 3 and 6 days after treatment (T + 1, T + 3, T + 6); and 45 to 56 days after challenge (C + 56). Analytes are ordered by unsupervised hierarchical clustering, and those that vary significantly between primary and secondary P. vivax CHMI and between secondary P. vivax CHMI and P. falciparum rechallenge are indicated in green; grey is non-significant. Significance was assessed using mixed-effects modelling and linear regression. The data for each CHMI are paired. DG Laboratory parameters were measured during primary and secondary P. vivax CHMI and heterologous P. falciparum rechallenge, at the same time-points as in (C), as well as at 96 days (C + 96) after challenge. D shows lymphocyte count (no significant difference between first vivax and heterologous falciparum rechallenge for minimum lymphocyte counts (p = 0.97 by two-tailed Wilcoxon matched pairs signed-rank test); (E) shows platelet count (diagnosis p = 2.0 × 10−9, T + 1 and T + 3 p < 2 × 10−16); (F) shows alanine aminotransferase (ALT, T + 6 p = 5.1 × 10−9); (G) shows albumin (T + 1 p = 3.7 × 10−5, T + 3 p = 4.0 × 10−9, T + 6 p = 9.7 × 10−10) p = 0.0084. Box and whisker plots show median and interquartile range (IQR) with whiskers representing 1.5× IQR (outliers are shown as dots). In (EG), statistically significant differences between primary P. vivax CHMI and heterologous P. falciparum rechallenge were identified at each time-point using mixed-effects modelling and linear regression. In (A, B) and (DG), n = 19 (primary P. vivax CHMI), n = 12 (secondary P. vivax CHMI) and n = 6 (heterologous P. falciparum CHMI). In (C) n = 10 (primary P. vivax CHMI), n = 7 (secondary P. vivax CHMI) and n = 6 (heterologous P. falciparum CHMI).

References

    1. Word Health Organisation. World Malaria Report 2024: Addressing Inequity in the Global Malaria Response (2024).
    1. Battle, K. E. et al. Mapping the global endemicity and clinical burden of Plasmodium vivax, 2000–17: a spatial and temporal modelling study. Lancet394, 332–343 (2019). - PMC - PubMed
    1. Twohig, K. A. et al. Growing evidence of Plasmodium vivax across malaria-endemic Africa. PLoS Negl. Trop. Dis.13, e0007140 (2019). - PMC - PubMed
    1. Baird, J. K. African Plasmodium vivax malaria improbably rare or benign. Trends Parasitol.38, 683–696 (2022). - PubMed
    1. Milne, K. et al. Mapping immune variation and var gene switching in naive hosts infected with Plasmodium falciparum. eLife10, e62800 (2021). - PMC - PubMed

Publication types

Associated data

LinkOut - more resources